
Detection of Financial Crisis in Indonesia based on Import and Yen
Exchange Rate to Rupiah Indicators using Combined of Volatility
and Markov Switching Models
Etik Zukhronah
1
, Sugiyanto
1
and Isna Ruwaidatul Azizah
2
1
Study Program of Statistics, Universitas Sebelas Maret Surakarta, Indonesia
2
Department of Mathematics, Universitas Sebelas Maret Surakarta, Indonesia
Keywords: Crisis, Detection, Import, Yen Exchange Rate to Rupiah, SWARCH.
Abstract: In 1997 and 1998 Indonesia experienced the most severe financial crisis, so early detection is needed to
anticipate the impact of the crisis. The financial crisis can be detected by import and yen exchange rate to
rupiah indicators. In this paper, it used import and yen exchange rate to rupiah data from January 1990 to
December 2016 to form the model, while the data from January until December 2017 were used to validate
the model. To overcome the problem of structural change in the data, it is used Markov switching model,
while to detect the volatility shift it is used ARCH model and the combination of both models is Markov
switching ARCH (SWARCH) model. The aim of this study is to determine the appropriate model and to
detect financial crisis based on import and yen exchange rate to rupiah indicators. The results show that the
appropriate model for import and yen exchange rate to rupiah data is SWARCH(2,1). Based on the model, it
can be predicted that Indonesia will not experience a financial crisis in 2018.
1 INTRODUCTION
The financial crisis in Asia came from the fall in
currency values bath in Thailand in 1997. In 1997 and
1998, Indonesia experienced a financial crisis.
Currently, global trade is already unavoidable, and
the exchange rate affects the economy of a country.
For example, when the rupiah becomes more valuable
to foreign currencies, the price of imported goods will
be cheaper for the Indonesian population and
Indonesian export goods are more expensive for
foreign countries (Mishkin, 2008). There are 15
indicators that could be used to detect financial crisis
for example import, export, price stock, and rupiah
exchange rate (Kaminsky et al., 1998).
Engle (1982) uses the Autoregressive Conditional
Heteroscedasticity ( ARCH ) model for resolving the
problem of heteroscedasticity. Model ARCH could
not be used to cover the data that have structural
changes . Therefore, Hamilton (1989) used the
Markov switching model for resolving the problem of
structural changes on data. However, Markov
switching model cannot solve the problem of
volatility so Hamilton and Susmel 1994) used the
Markov switching ARCH (SWARCH) model to
overcome structural changes and volatility of the
data. The aim of this paper is to determine the
appropriate model of import and yen exchange rate to
rupiah data. The model is used to detect the financial
crisis in 2018.
2 THEORY
2.1 Autoregressive (AR) and
Autoregressive Conditional
Heteroscedasticity (ARCH) Model
An AR model is as follows
(1)
where r
t
is log return in the t
th
period which is
formulated as
,
is a parameter of AR
model at p
th
time, and
is residue at t
th
time (Tsay,
2005). The next model that we are used is ARCH (p)
model. The model could be written as
Zukhronah, E., Sugiyanto, . and Azizah, I.
Detection of Financial Crisis in Indonesia based on Import and Yen Exchange Rate to Rupiah Indicators using Combined of Volatility and Markov Switching Models.
DOI: 10.5220/0008519402050209
In Proceedings of the International Conference on Mathematics and Islam (ICMIs 2018), pages 205-209
ISBN: 978-989-758-407-7
Copyright
c
2020 by SCITEPRESS – Science and Technology Publications, Lda. All rights reserved
205

where
is a constant of ARCH model,
is a
parameter of ARCH model , and
is a variance of
residual at t
th
period.
2.2 Cluster Analysis
Cluster analysis is used to group a set of objects into
two or more clusters based on the similarity of objects
based on various characteristics. One method in
cluster analysis is Ward method that based on the sum
of square error (SSE), which is defined as
′
where
is the i
th
object,
is the average value of
the object in the cluster , and
is the number of
objects on the cluster , where
(Rencher, 2003).
2.3 Markov Switching ARCH
(SWARCH) Model
Hamilton and Susmel (1994) formulates SWARCH
model as below
where
is a variance of residue at i
th
period,
is
a residue of AR model and conditional variance of
is modeled as an ARCH(p) process.
2.4 Smoothed Probability
Smoothed probability is the probability of a state in
the t
th
period that based on all observational data
which formulated as
where
is a set of data from the past until time
(Hamilton and Susmel, 1994).
2.5 Crisis Detection
Crisis forecasting is determined by the forecasting
value of smoothed probability at time (t+1) which is
based on smoothed probability at time t, and
formulated as follows
where
is the probability of transition from state i
to state j and
is smoothed
probability at state i and time (t-1).
3 RESEARCH METHODS
Data that used in this paper is import and yen
exchange rate to rupiah data from January 1990 to
December 2016, there are 324 data. The steps of the
analysis are as follows.
1. Plot data for knowing the pattern of data.
Augmented Dickey-Fuller (ADF) test is used to
test the stationary of data. If the data are not
stationary, then do transform log return.
2. Analyze the AR model by looking at the plot of
PACF then perform a heteroscedasticity effect
test using the Lagrange Multiplier test .
3. Identify the volatility model and conduct
diagnostic tests.
4. Form the combined of Markov switching and
volatility models with the number of states
obtained from cluster analysis.
5. Calculate the value of smoothed probability to
detect a crisis.
4 RESULTS AND DISCUSSIONS
Figure 1 and 2 are a plot of import and yen exchange
rate to rupiah respectively. Figure 1 shows that the
import and yen exchange rate to rupiah data have
fluctuations and indicate that the data is not
stationary. To prove the allegation, the ADF test was
carried out and the probability value was 0.4446 for
import data and 0.2549 for yen exchange rate to
rupiah. Both the probability value is greater than 0.05,
it can be concluded that the import and yen exchange
rate to rupiah is not stationary. Furthermore, it was
done the transformation of log return and based on the
ADF test, it is obtained the both probabilities are 0.01
that these are smaller than 0:05, so it can be concluded
that the import and yen exchange rate to rupiah were
stationary. Furthermore, we estimated the parameter
of AR model based on plot of PACF as shown in
Table 1.
ICMIs 2018 - International Conference on Mathematics and Islam
206

Figure 1: Plot of import data.
Figure 2: Plot of yen exchange rate to rupiah.
Table 1: Results of estimation of AR model for import and
yen exchange rate to rupiah.
AR(2) model
for import
AR(1) model
for yen
exchange
rate to
rupiah
Based on Lagrange Multiplier test, it was
obtained the probability value for import data of
0.004175 and for yen exchange rate to rupiah of
0.000016. Because the both probabilities are smaller
than 0.05, this shows that the residue of AR model
contains the effect of heteroscedasticity. The next
step is to estimate the parameter of ARCH model as
shown in Table 2.
Table 2: Estimation of the ARCH model for import and yen
exchange rate to rupiah.
ARCH(1) model for
import
ARCH(1) model yen
exchange rate to
rupiah
The results of the Ljung-Box test, it was obtained
the probability value for import data is 0.5344 and for
yen exchange rate to rupiah is 0.0912. Both of
probabilities are greater than 0.05, it means that the
residue of the ARCH model does not contain
autocorrelation. Based on the Lagrange Multiplier
test , the probability value for import data is 0.333 and
0.1213 for the yen exchange rate to rupiah which is
greater than 0.05, it means that the residual of ARCH
model does not contain heteroscedasticity effects.
Whereas the Kolmogorov Smirnov test, it was
obtained the probability value for import data of 0.8
and for the yen exchange rate to rupiah of 0.6 which
is greater than 0.05. It can be concluded that the
residual of ARCH model is normally distributed.
Then cluster analysis is performed to determine
the number of states that can be formed. Based on the
cluster analysis, the results show that there are 2
clusters that can be formed, so that there are 2 states
in the formation of the SWARCH model. The
ARCH(1) model is combined with the Markov
switching model 2 state to overcome differences in
conditions not crisis and crisis on import data.
Transition probability matrix for import data are as
follows
In the transition probability matrix
, the first
column shows that the value of the probability of
holding on the low volatility state is 0.6669482 and
the probability of change in low to high volatility is
0.3330518 . In the second column, it indicated that the
probability of change in high to low volatility is
0.1511154 and the probability of holding on the high
volatility state is 0.8488846.
Based on the results of the analysis, the model that
full filled the assumption is the ARCH(1) model and
there are 2 states so that the SWARCH model that is
formed is SWARCH(2,1). Estimation results of the
parameter SWARCH(2,1) model for import data is
where is the average value of the log return data
import and the conditional volatility model is
Furthermore, the probability transition matrix for
the yen exchange rate to rupiah data is as follows
Parameter estimation result of SWARCH(2,1)
model for yen exchange rate to rupiah data is
Detection of Financial Crisis in Indonesia based on Import and Yen Exchange Rate to Rupiah Indicators using Combined of Volatility and
Markov Switching Models
207
where the conditional variance model is
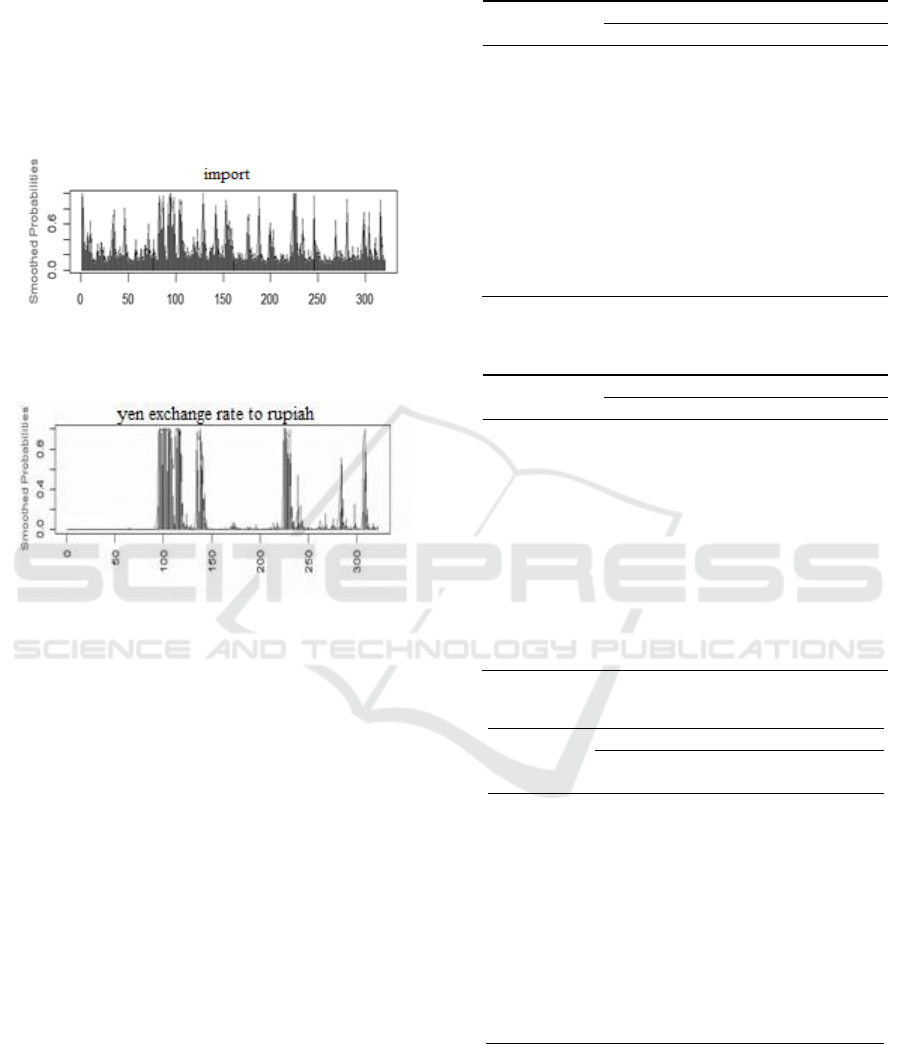
Furthermore, it is calculated the smoothed probability
to check the crisis condition. Figure 3 and Figure 4
are the value of smoothed probability for import and
yen exchange rate respectively.
Figure.3: Plot of smoothed probability of import.
Figure 4: Plot of smoothed probability of yen exchange rate
to rupiah.
The results of calculating the crisis limit on the
value of smoothed probability, it can be concluded
that the value of smoothed probability of import data
which more than 0.790915 is in a crisis and of yen
exchange rate to rupiah data which more than
0.448561 is in a crisis. Table 3 and Table 4 show the
comparison of forecasting and actual smoothed
probability value for import and yen exchange rate to
rupiah indicators in 2017 respectively.
Based on Table 3, the forecasting smoothed
probability value and the actual value do not
experience a significant difference, except in June
2017 on import data. This is happened because the
value of imports in June declined significantly but the
value of yen remained high so that financial
conditions in Indonesia were prone to crisis. In the
next month the import value rose again and stabilized
for the following months so that the SWARCH(2,1)
model for import data and yen exchange rate to rupiah
could be used to detect financial crises in Indonesia.
Table 3: Forecasting and Actual Smoothed Probability
Value for import in 2017.
Period
Import
Forecasting
Actual
Jan 2017
0.09058303
0.3051957
Feb 2017
0.08181023
0.4093009
Mar 2017
0.07728494
0.2398876
Apr 2017
0.07495064
0.2612489
May 2017
0.07374653
0.4023360
Jun 2017
0.07312542
0.9373966
Jul 2017
0.07280503
0.4731825
Aug 2017
0.07263976
0.2058910
Sept 2017
0.07255451
0.1341276
Oct 2017
0.07251053
0.1067105
Nov 2017
0.07248785
0.1126172
Dec 2017
0.07247615
0.1352822
Table 4: Forecasting and Actual Smoothed Probability
Value for yen exchange rate to rupiah in 2017.
Period
Yen Exchange Rate to Rupiah
Forecasting
Actual
Jan 2017
0.0151432
0.04266027
Feb 2017
0.0136995
0.01158024
Mar 2017
0.0124787
0.00366135
Apr 2017
0.0114462
0.00278140
May 2017
0.0105731
0.00735416
Jun 2017
0.0092109
0.00554720
Jul 2017
0.0080589
0.01410902
Aug 2017
0.0070847
0.00645248
Sept 2017
0.0062609
0.00510444
Oct 2017
0.0055642
0.00534139
Nov 2017
0.0049750
0.01698142
Dec 2017
0.0044768
0.02611092
Table 5: Forecasting smoothed probability value in 2018.
Period
Forecasting Smoothed Probability
Import
Yen Exchange
Rate to Rupiah
Jan 2018
0.07247012
0.00405546
Feb 2018
0.07246699
0.00369915
Mar 2018
0.07246539
0.00339783
Apr 2018
0.07246456
0.00314302
May2018
0.07246413
0.00292754
Jun 2018
0.07246391
0.00274532
Jul 2018
0.07246380
0.00259121
Aug 2018
0.07246374
0.00246090
Sept 2018
0.07246371
0.00235069
Oct 2018
0.07246369
0.00225749
Nov 2018
0.07246369
0.00217868
Dec 2018
0.07246368
0.00211203
Based on Table 4, the forecasting smoothed
probability value and the actual value for yen
exchange rate to rupiah do not experience a
significant difference. The results of forecasting
smoothed probability in 2018 are shown in Table 5.
ICMIs 2018 - International Conference on Mathematics and Islam
208

Table 5 shows that the forecasting smoothed
probability value on the import data and yen
exchange rate to rupiah was below the crisis limit, so
that Indonesia was detected not experiencing a
financial crisis in 2018.
5 CONCLUSIONS
Based on the results, it was obtained to the conclusion
as follows.
1. The appropriate model for import and yen
exchange rate to rupiah indicators is SWARCH
(2,1).
2. Based on import and yen exchange rate to rupiah
indicators, Indonesia was predicted that there is no
financial crisis in 2018.
REFERENCES
Engle, R. F., 1982. Autoregressive Conditional
Heteroscedasticity with Estimates of the Variance of
United Kingdom Inflation. Econometrica, vol. 50, pp.
987-1008.
Hamilton, J. D., 1989. A New Approach to the Economic
Analysis of Nonstationary Time Series and the
Business Cycle. Econometrics, vol. 57, pp. 357-384.
Hamilton, J. D. and Susmel, R., 1994. Autoregressive
Conditional Heteroscedasticity and Changes in
Regime. Journal of Econometrics, vol. 64, pp. 307-
333.
Kaminsky, G. L., Lizondo, S. and Reinhart. C. M., 1998.
Leading Indicators of Currency Crises. IMF Staff
Papers, Vol. 45 (1), pp. 1-48.
Mishkin, F. S., 2008. Globalization, Macroeconomic
Performance, and Monetary Policy. NBER Working
Paper Series, Cambridge.
Rencher, A. C., 2003. Methods of Multivariate Analysis.
John Wiley and Sons, Inc. New York, 2
nd
edition.
Tsay, R. S., 2005. Analysis of Financial Time Series. John
Wiley and Sons.
Detection of Financial Crisis in Indonesia based on Import and Yen Exchange Rate to Rupiah Indicators using Combined of Volatility and
Markov Switching Models
209
