
Prediction Interval in Seasonal Autoregressive Integrated Moving
Average (SARIMA) Model for Rainfall Forecasting and Drought
Vita Mami Nikmatillah, Dian Anggraeni
and Alfian Futuhal Hadi
Mathematics Department, Faculty of Math and Science,University of Jember, Kalimantan 37 Street,
Jember 68121, Indonesia
Keywords: Prediction Interval, Forecasting, Rainfall, SARIMA, SPI.
Abstract: The prediction interval in the forecasting process is the most important part of knowing indication of
uncertainty in forecasts value. The uncertainty also serves to reduce the forecasting errors that occur. This
research uses SARIMA model in rainfall forecasting process in Jember Regency. In addition to calculating
predictive interval values, the predicted values generated by the SARIMA model are transformed in
Standardized Precipitation Index (SPI) values to determine the classification of drought levels. The results
showed that the predictive interval value is presented in the form of upper limit and lower limit of
precipitation value of rainfall. The resulting drought prediction interval indicates that droughts in the four
regions of Jember Regency due to the lower limit value reaching minus. The drought index at the SPI value
shows almost all areas in normal conditions. However, Zone 1 in January and Zone 2 in November
contained a moderately wet month where the rain intensity was greater was greater rather than the other
months in the same zone. The difference in classification results from predictive intervals and the SPI
method is very large. The predicted underestimate prediction value indicates that the prediction interval is
poor in interpreting a region's drought.
1 INTRODUCTION
Forecasting is a time series data analysis that uses
past events to determine future developments in
events (Assauri, 1984). Prediction is a number called
a prediction point, where the resulting value is not
true. The accuracy rate of t + 1 is higher than t + 2, t
+ 3 . Prediction interval is the interval of the
forecasting values. The value of the prediction that
appears quite close to the value to be achieved. The
calculation of the prediction interval in the
forecasting process is the most important part of
knowing the indication of an uncertain predictive
value. This uncertain value is the predictor interval
factor. This matter a purpose to find out the
uncertainty information needed in future.
Badan Meteorologi dan Geofisika (BMKG) is
one of the institutions that apply forecasting in
predicting the amount of rainfall in some area.
Rainfall is the amount of rainwater that falls on an
area within a certain time. The topography of an area
affects the rainfall that will occur. Forecasting model
that is widely used in predicting rainfall is the
ARIMA (Autoregressive Integrated Moving
Average) model. ARIMA or Box-Jenkins model is a
combination of several models such as
Autoregressive (AR) model, Moving Average (MA)
model and Autoregressive Moving Average
(ARMA) model. ARIMA is a combination of model
(AR) and model (MA) that has experienced
differencing. The ARIMA model is widely used in
rainfall forecasting because it has several characters
that are particularly suitable for rainfall cases,
especially seasonal ARIMA or Seasonal
Autoregressive Integrated Moving Average
(SARIMA) (Makridakis, et al., 1999). The SARIMA
model is a modified version of the ARIMA model.
SARIMA is widely used in seasonal data.
Drought is an event of reduced rainfall from
normal conditions over long periods of time. In the
agricultural sector, drought is a very feared by the
farmers because it can affect production which then
resulted in losses. The phenomenon of drought that
occurs regularly need to be conducted drought
analysis to know level of drought happening in an
area. The method used in analyzing drought rates
using rainfall data is the Standardized Precipitation
Nikmatillah, V., Anggraeni, D. and Hadi, A.
Prediction Interval in Seasonal Autoregressive Integrated Moving Average (SARIMA) Model for Rainfall Forecasting and Drought.
DOI: 10.5220/0008517801010107
In Proceedings of the International Conference on Mathematics and Islam (ICMIs 2018), pages 101-107
ISBN: 978-989-758-407-7
Copyright
c
2020 by SCITEPRESS – Science and Technology Publications, Lda. All rights reserved
101

Index (SPI) (Mckee et al.,1993). Therefore, it is
necessary to forecast rainfall as basic information in
determining the index of drought in the future.
Some research on rainfall forecasting has been
done by some researchers such as Lusiani (Abraham
and Ledolter, 1983) modeling rainfall ARIMA in
Bandung, Ukhra (2014) modeling and forecasting
time series data with SARIMA and Retnaningrum
(2015) application of STAR (Space Time
Autoregressive) and ARIMA for forecasting rainfall
data in Jember district. These studies are limited to a
single point of forecasting data without considering
a certain probability interval. Prediction intervals is
important part in forecasting process to knowing
indication of uncertainty in the approximate point.
Research on Prediction intervals has been done
among others Yar and Chatfield (1990) prediction
intervals for Holt-Winters forecasting procedures,
Chatfield (1993) calculating prediction intervals, and
Safitri (1995) prediction intervals for time series
models. In addition to determining future rainfall
predictions required research on the level of drought
that occurred in a region. Mutjahiddin (2014)
concluded that the drought was due to a deviation of
weather conditions from normal conditions
occurring in a region. Such deviations can be
reduced rainfall compared to normal conditions.
Kurniawan (2016) studied the combination of
ARIMA and Standardized Precipitation Index (SPI)
to determine the drought index in Boyolali district.
The location of the diverse topography and
natural conditions that experienced a very dynamic
temperature changes causes Jember district made
several efforts to reduce the impact that occurred.
Based on the above research researchers want to
provide new research. Researchers want to provide
forecasting interval for rainfall with time series
model containing seasonal parameter and
determining dryness level from rainfall prediction
result. This research data use rainfall data 77 rain
stations in Jember Regency spread based on
topography location. Finally, calculate the prediction
interval of forecasting value by using SARIMA
model and analyze the drought rate that will occur
with SPI method.
2 MATERIALS AND METHODS
2.1 Data Set
Rainfall data from 77 rain stations in Jember
Regency from January 2005 to December 2017.
Rainfall data is divided into two kinds, namely in-
sample data and out-sample data. In-sample data is
rainfall data from January 2005 to December 2016.
While the out-sample data is rainfall data from
January 2017 to December 2017. Variables used in
this study based on research that has been done by
Hadi (2017) namely:
X
1
(t) : Average rainfall in Jember region zone 1
X
2
(t) : Average rainfall in Jember region zone 2
X
3
(t) : Average rainfall in Jember region zone 3
X
4
(t) : Average rainfall in Jember region zone 4
2.2 SARIMA Model
Seasonal ARIMA Model is an ARIMA model used
to complete a seasonal time series consisting of two
parts, i.e. non-seasonal (seasonal) and seasonal parts.
The non-seasonal part of this method is the ARIMA
model. The general SARIMA Model is
. (1)
Estimate of parameters is done by using Maximum
Likelihood Estimation (MLE). The assumption
required in the MLE method is the error (time error
value t) is normally distributed (Box and Jenkins,
1976):
(2)
Best selection model is based on the AIC. Best
model derived from smaller AIC. M is a data to be
predicted. then AIC calculation is formulated with
the following equation (Wei, 2016; Bowerman and
O’onner, 1987):
(3)
2.3 Prediction Interval
An observed time series, n observations, is
denoted by
). Suppose we wish to
forecast the value of the series k steps ahead. This
means we want to forecast the observe value at time
(t+k). The point forecast of the value at time (t+k)
data up to time n is denoted by
(4)
When the value later becomes available, we can
know the corresponding forecast error, denoted by
forecast error, like that for the point forecast,
specifies both the horizon and the time period when
the forecast was made.
ICMIs 2018 - International Conference on Mathematics and Islam
102

The formulae that a 100(1-)% P.I. for the value
h steps ahead is given by
, (5)
where appropriate formula for
and
are found to the model which is
appropriate percentage point of a standard normal
distribution.
The interval about
, so that assume that the
point forecast is unbiased. The usual statistic for
asses the uncertainty in forecasts of a single variable
is the expected mean square prediction error (PMSE)
is
. The scale-independent statistics, such
as the mean absolute prediction error (MAPE), will
be for compare the accuracy of forecasts made for
different variables, especially when measured on
different scales.
2.4 Standardized Precipitation Index
(SPI)
The SPI method developed by Mckee (1993) was
used to calculate the drought index. This method
measures the shortage of rainfall at various periods
under normal conditions. The calculation of the SPI
value based on the amount of gamma distribution is
defined as the frequency function or chance of
occurrence as follows:
(6)
The values of α and β in estimates for each rain
station using the following formula:
, (7)
, (8)
or
,
(9)
for x = 0, the value equation G(x) becomes:
(10)
where q is the number of rain events (0 (m) / amount
of data (n)).
The SPI value is a transformation of the gamma
distribution (G (x)) to a normal standard with
mean 0. Calculation for
Z=SPI=
(11)
(12)
where the coefficient value of Mckee as follows:
1.432788,
0.189269,
0.001308.
The criterion of dryness index value of SPI
method is classified in table 1:
Table 1. The criterion of dryness index value of SPI.
Classification
SPI
Extremely Wet
> 2,00
Very Wet
1,50 - 1,99
Moderately Wet
1,00 -1,49
Normal
( - 0,99 ) - 0,99
Moderately Dry
( -1,00 ) - ( -1,49
)
Severely Dry
( -1,50 ) - ( -1,99
)
Extremely Dry
< ( -2,00 )
3 RESULTS AND DISCUSSIONS
3.1 Rainfall Forecasting with SARIMA
Model
In the forecasting process it takes the best model to
get the best prediction value. Best model is chosen
by identification process, parameter estimation,
model feasibility test and best model selection. The
best model is gotten from a smallest AIC value.
Table 2 shows the best model in the four regions in
Jember Regency.
We will forecast the rainfall in four regions in
Jember Regency for the period January to December
Prediction Interval in Seasonal Autoregressive Integrated Moving Average (SARIMA) Model for Rainfall Forecasting and Drought
103
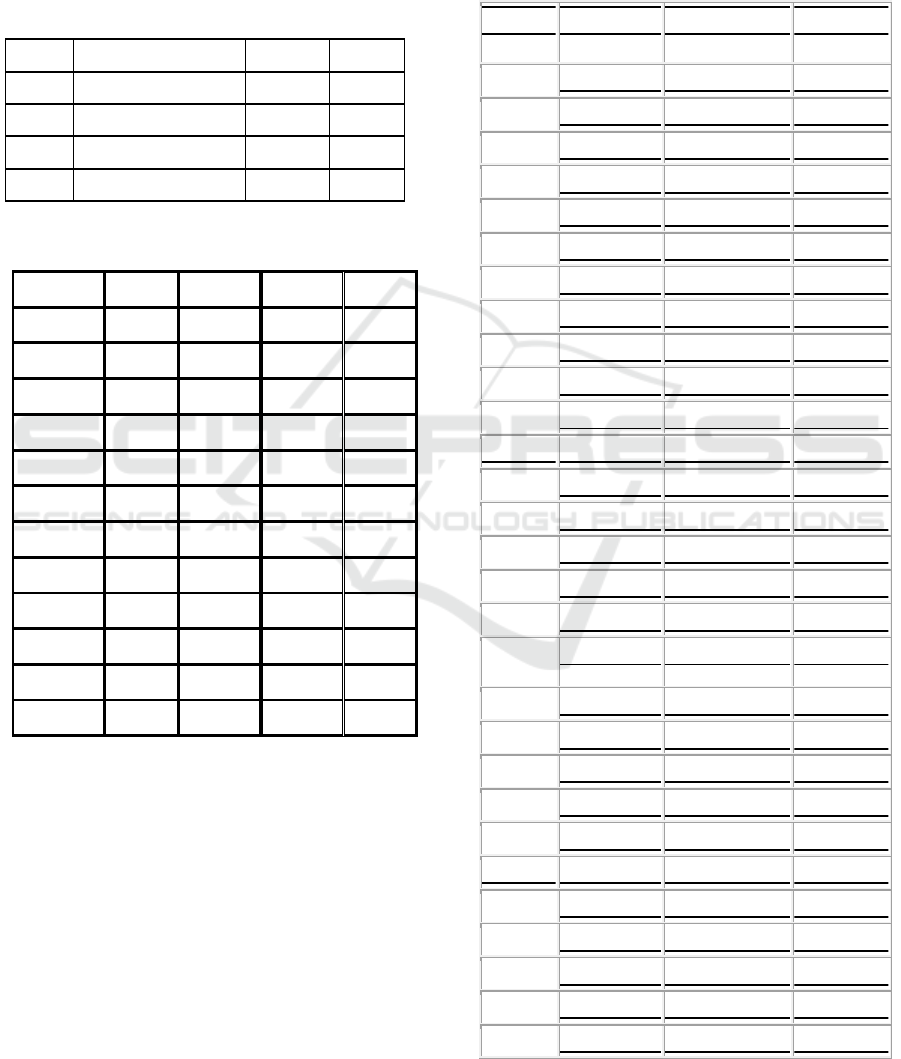
2018 with different models in each region. Rainfall
forecasting in 2018 presented in table 3. Table 3
shows that rainfall intensity in four regions in
Jember Regency is different. High rain intensity or
low rainfall intensity is influenced by rainfall data in
2017.
Table 2: The best model for forecasting in the four regions
of Jember Regency.
Regions
Model
Likelihood
AIC
Zone 1
SARIMA(2,0,2)(1,0,0)
12
-822.76
1659.52
Zone 2
SARIMA(1,0,0)(2,0,0)
12
-877.46
1764.93
Zone 3
SARIMA(1,0,0)(2,0,0)
12
-863.35
1736.69
Zone 4
SARIMA(1,0,0)(2,0,0)
12
-844.53
1699.07
Table 3. Rainfall forecasting in year 2018.
Month
Zone 1
Zone 2
Zone 3
Zone 4
January
261.828
363.182
304.5168
214.205
February
233.234
331.6850
274.969
187.690
March
186.012
292.9529
223.976
184.127
April
143.200
274.2085
208.144
196.369
May
63.735
186.6581
139.833
118.661
June
24.241
187.2412
122.852
93.6307
July
9.178
120.9784
80.2982
74.6286
August
22.694
105.7265
71.8021
72.512
September
57.603
143.7296
105.205
79.5432
October
109.82
245.4738
177.97
112.96
Nopember
218.519
376.8000
312.554
223.857
December
226.18
352.6720
275.51
201.55
3.2 Prediction Interval
Prediction interval in forecasting process is the most
important part to know the indication of uncertain
prediction value. Table 3 shows that the prediction
value has an uncertain value. So, it is necessary to
calculate the prediction interval on the value of
forecasting to know the value of uncertainty. Table 4
presents prediction of rainfall forecasting forecast in
four regions.
Prediction interval is used to know the value of
uncertainty forecast. Thus, if the actual data is in the
interval of the prediction interval then it can be said
that the forecast is successful or can be used as a
predicting reference that will occur in the future and
prediction interval can also be used in the
classification of drought.
Table 4: Prediction interval rainfall forecasting in the Year
of 2018 in four regions in Jember Regency.
Regions
Month
Lower Limit
Upper Limit
January
116.76734
406.8883
February
80.17019
386.2979
March
28.61040
343.4128
April
-15.02591
301.4255
May
-94.64056
222.1098
Zone 1
June
-136.29266
184.7737
July
-155.62451
173.9798
August
-146.39546
191.7834
September
-11..89666
229.1026
October
-62.15720
281.8070
Nopember
46.46676
390.5711
December
52.96794
399.3824
January
153.382874
572.9819
February
97.175001
566.1950
March
52.674883
533.2309
April
32.513180
515.9038
May
-55.389449
428.7056
Zone
2
June
-54.894115
429.3765
July
-121.178756
363.1356
August
-136.436174
347.8891
September
-98.434450
385.8936
October
3.309465
487.6382
Nopember
134.635543
618.9644
December
110.507506
594.8364
January
120.260109
488.7735
February
71.020833
478.9177
March
15.850219
432.1011
April
-0.910875
417.1980
May
-69.429895
349.0962
ICMIs 2018 - International Conference on Mathematics and Islam
104
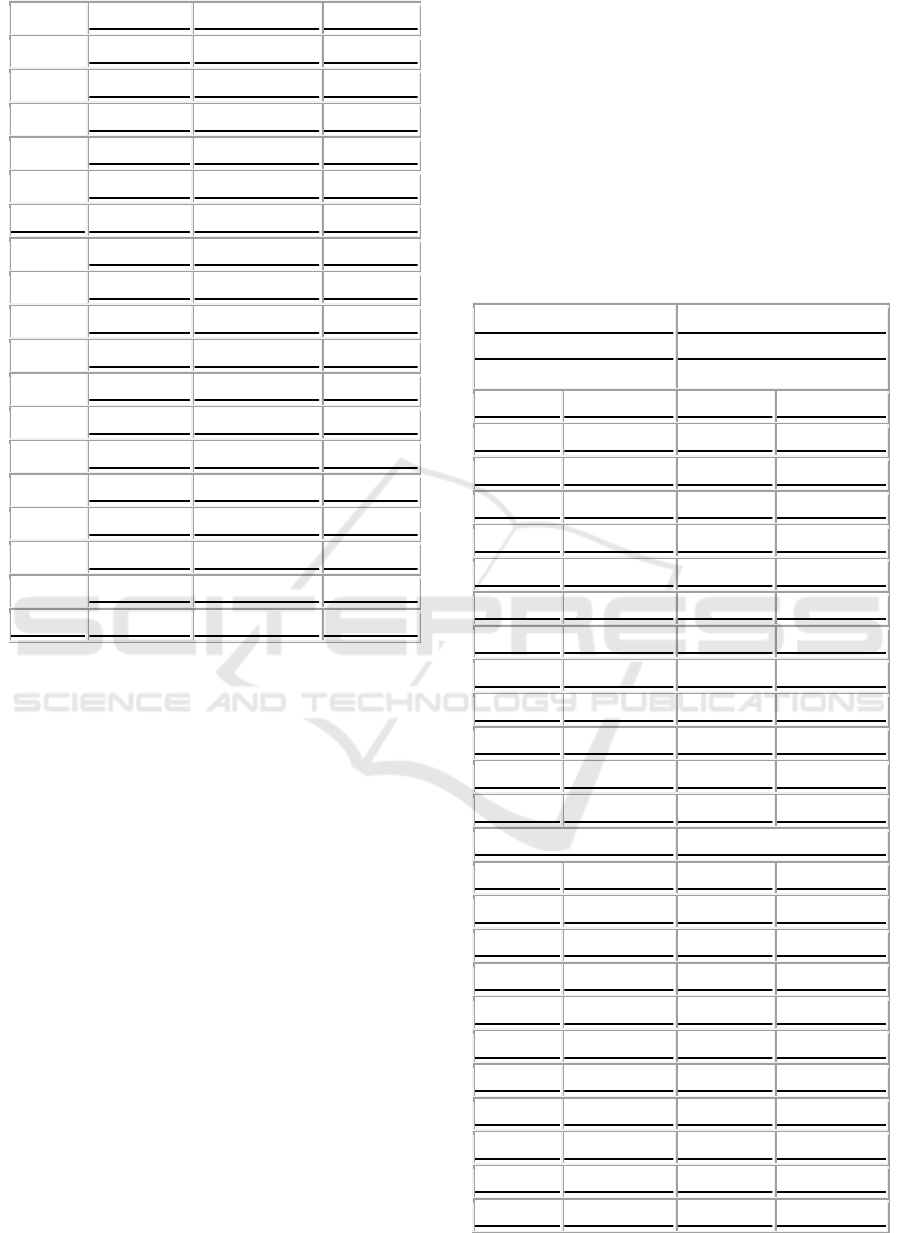
Zone 3
June
-86.458487
332.1615
July
-129.022351
289.6188
August
-137.520794
281.1251
September
-104.118677
314.5283
October
-31.355708
387.2915
Nopember
103.230342
521.8776
December
66.189686
484.8369
January
50.044095
378.3653
February
10.526616
364.8539
March
4.575418
363.6792
April
16.817435
375.9213
May
-62.058618
299.3797
Zone 4
June
-89.967882
277.2294
July
-112.666312
261.9236
August
-118.231471
263.2547
September
-113.769974
272.8564
October
-81.918607
307.8348
Nopember
28.225972
419.4872
December
5.661871
397.4372
3.3 Standardized Precipitation Index
(SPI)
Drought analysis is needed to determine wet or dry
months in a region. The drought analysis discussed
in this study was to determine the average dryness
index of the region and the intensity of drought
occurring every month. The method used in this
drought analysis is the SPI method. From the
calculations using the SPI method, the drought
intensity was calculated every month during 2018.
Table 5 shows the average dryness index
recapitulation in four region deficit 1-month during
2018.
Table 5 presents the SPI values or each rainfall
prediction point in 2018. The index values to be
described are based on the dryness index criteria in
table 2. The index values that have been described
based on the drought index will be used for the next
step.
3.4 Drought Classification
This drought classification was conducted to
determine the 1-month deficit drought index in four
regions of Jember district. The classification can be
obtained from prediction interval result and SPI
method result. Table 6 will present the drought
classification table with the prediction interval and
the SPI method.
Table 5: Drought index in four regions deficit 1-month
2018.
Zone 1
Zone 2
Month
SPI
Month
SPI
January
1.2206
January
0.8616
February
0.7647
February
0.8616
March
0.3554
March
0.5894
April
0.2104
April
0.2822
May
-0.3554
May
-0.0697
June
-0.6744
June
-0.0697
July
-0.8616
July
-0.5085
August
-0.6744
August
-0.5895
September
-0.3554
September
-0.4307
October
-0.1397
October
0.0696
Nopember
0.6744
Nopember
1.0853
December
0.7647
December
0.8616
Zone 3
Zone 4
Month
SPI
Month
SPI
January
0.8616
January
0.5085
February
0.6744
February
0.2104
March
0.3554
March
0.2104
April
0.2822
April
0.2822
May
-0.1397
May
-0.0696
June
-0.2822
June
-0.2822
July
-0.431
July
-0.431
August
-0.508
August
-0.431
September
-0.431
September
-0.355
October
0.1397
October
-0.21
Prediction Interval in Seasonal Autoregressive Integrated Moving Average (SARIMA) Model for Rainfall Forecasting and Drought
105
Nopember
0.9674
Nopember
0.5895
December
0.6745
December
0.4307
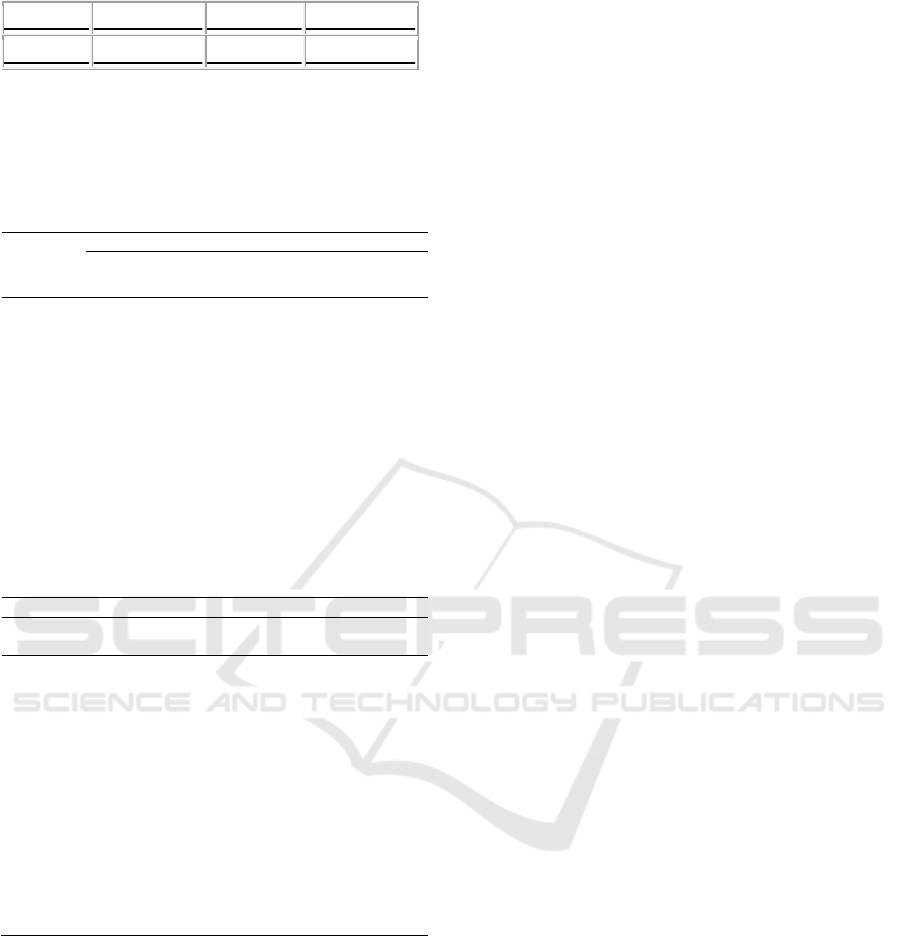
Table 6: Classification of drought with prediction Intervals
and methods of SPI in the four regions of Jember districts
in 2018.
Month
Zone 1
Zone 2
SPI
Prediction
Interval
SPI
Prediction
Interval
January
Moderately
wet
Normal
Normal
Normal
February
Normal
Normal
Normal
Normal
March
Normal
Normal
Normal
Normal
April
Normal
Dry
Normal
Normal
May
Normal
Dry
Normal
Dry
June
Normal
Dry
Normal
Dry
July
Normal
Dry
Normal
Dry
August
Normal
Dry
Normal
Dry
September
Normal
Dry
Normal
Dry
October
Normal
Normal
Normal
Normal
November
Normal
Normal
Moderately
wet
Normal
December
Normal
Normal
Normal
Normal
Zone 3
Zone 4
Month
SPI
Prediction
Interval
SPI
Prediction
Interval
January
Normal
Normal
Normal
Normal
February
Normal
Normal
Normal
Normal
March
Normal
Normal
Normal
Normal
April
Normal
Dry
Normal
Normal
May
Normal
Dry
Normal
Dry
June
Normal
Dry
Normal
Dry
July
Normal
Dry
Normal
Dry
August
Normal
Dry
Normal
Dry
September
Normal
Dry
Normal
Dry
October
Normal
Dry
Normal
Dry
November
Normal
Normal
Normal
Normal
December
Normal
Normal
Normal
Normal
Table 6, in column of the SPI shows that the
prediction results in four regions of Jember District
don’t have dry months during 2018 and average
rainfall will be in normal condition. Zone 1 in
January and Zone 2 in November is a moderately
wet where rain intensity is greater this month. In the
prediction interval column there is a dry month in
Zone 1, Zone 2, Zone 3 and Zone 4 areas due to the
prediction interval value in the lower limit reaches
the minus value. In august the rainfall in low
intensity while the highest rainfall intensity occurred
in January to April and November to December.
4 CONCLUSIONS
From the result, we can know conclude that four
regions of Jember Regency run into drought.
Otherwise, SPI index shows almost all regions go
through a normal condition except in January zone 1
and November zone 2 contained a moderately wet
month where the rain intensity was greater in that
month. The difference in classification results from
the prediction interval and the SPI method is very
large. The predictive value of the underestimate
interval shows that the prediction interval is poor in
interpreting the drought of a region.
ACKNOWLEDGEMENTS
This research was supported by Ministry of
Research, Technology & Higher Education of
Indonesia, Grant No. 1649/UN25.3.1/LT.1/2018.
We thanks to all members of QUEST Research
Group, & Statistical Laboratory, Department of
Mathematics of UNEJ for the preparation of this
paper.
REFERENCES
Abraham, B. and Ledolter, J., 1983. Statistical Methods
for Forecasting. New York: Wiley.
Assauri, S. 1984. Teknik dan Metode Peramalan. Jakarta :
Penerbit Fakultas Ekonomi Universitas Indonesia.
Box, G.E.P. and Jenkins, G.M., 1976. Time Series
Analysis: Forecasting and Control, 1
st
Ed., Holden-
Day, San Fransisco.
Bowerman, B.I. and O’onnel, R.T., 1987. Time Series
Forecasting, 2
nd
Ed. Boston: Duxbury Press.
Chatfield, C. 1993. Calculating Interval Forecasts. Journal
of business and economic statistics, April 1993, Vol.
11, No. 2: 121-144. American Statistical Association.
Hadi, A.F, Yudistira, I., Anggraeni, D. and Hasan, M.,
2017. The Geographical Clustering of The Rainfall
Stations on Seasonal GSTAR Modeling for Rainfall
forecasting. The 2nd International Conference on
Statistics, Mathematics, Teaching, and Research. IOP
Conf. Series: Journal of Physics: Conf. Series 1028
(2018) 012238.
Kurniawan, R., 2016. Kombinasi Autoregressive
Integrated Moving Average (ARIMA) dan
Standardized Precipitation Index (SPI) untuk
Penentuan Indeks Kekeringan dengan Teknologi
Android. Salatiga: Universitas Kristen Satya Wacana.
Makridakis, S., Wheelwright, S. C., and McGee, V. E.,
1999. Metode dan Aplikasi Peramalan Jilid 1
(translated by Ir. Untung Sus Ardiyanto, M.Sc. and Ir.
ICMIs 2018 - International Conference on Mathematics and Islam
106

Abdul Basith, M.Sc.). 2
nd
Ed., Jakarta: Penerbit
Erlangga.
Mckee, T. B., Doesken, N. J. and Kleist, J., 1993. The
Relationshio of Drought Frequency and Duration to
Time Scales. Colorado: Department of Atmospheric
Science.
Meade, N. and Islam, T., 1995. Prediction Interval for
Growth Curve Forecast. Journal of Forecasting, 14,
413-430.
Mujtahiddin, M. I., 2014. Analisis Spasial Indeks
Kekeringan Kabupaten Indramayu. Jurnal
Meteorologi dan Geofisika VOL. 15 No. 2: 99-107.
Bandung.
Retnaningrum. 2015. Penerapan model STAR dan ARIMA
untuk peramalan Curah Hujan di Kabupaten Jember.
Jember: Universitas Jember.
Ukhra, A. 2014. Pemodelan dan peramalan data deret
waktu dengan metode Seasonal ARIMA. Jurnal
Matematika UNAND Vol. 3 No. 3: 59 – 67.
Universitas UNAND.
Wei, W.W.S., 2006. Time Series Analysis, Univariate
and Multivariate Methods 2
nd
edition. Pennsylvania:
Pearson Education Inc.
Yar, M. and Chatfield, C., 1990. Prediction interval of the
Holt-Winters forecasting procedure. International
Journal of Forecasting 6: 127-137. North–Holland.
Prediction Interval in Seasonal Autoregressive Integrated Moving Average (SARIMA) Model for Rainfall Forecasting and Drought
107
