
Modelling and Prediction of Rice Price in East Java using Approach
to the Multiplicative Time Series Analysis
Sediono and Satya Purnama
Department of Mathematics, Airlangga University, Surabaya, Indonesia 60115
Keywords: Rice Price, Bulog, Modelling, Prediction, Multiplicative Time Series, Arima.
Abstract: About 78% of Indonesia's population take a rice to meet daily carbohydrate intake. However, the fluctuating
of the rice price is one of the problems that should be faced by Bulog in East Java. Therefore, this research
aims to model and predict the rice price in East Java. We use the ARIMA Multiplicative Time Series
analysis to model and predict the rice price. The basis of the Multiplicative time series analysis is that the
factors affecting the pattern of the data set in the past and present tend to change little in the future. Thus,
the time series analysis can assist the researchers to make some decisions. The appropriate model for the
rice price data in East Java is ARIMA seasonal model. These are due to the harvest time. Based on the
smallest MSE, the result shows that the appropriate model for the rice price data in East Java from January
2008 to December 2016 is ARIMA(0,1,1)(0,1,1)12 or IMAISMA. There are no significant differences
between prediction price of rice in East Java for the period of January 2017 to August 2017 and sample
data.
1 INTRODUCTION
About 78% of Indonesia's population take a rice to
fulfill the carbohydrate intake (Prawira, 2013). Rice
becomes a very important food requirement for the
people of Indonesia and according to an article
released by International Rice Research Institute
(IRRI) in 2014 Indonesian’s rice consumption
reaches 125 Kilogram (Kg) per capita per year.
Therefore, the government established a logistics
agency called BULOG (Logistic Business Entity)
which plays an important role in regulating the
supply of rice, rice stock, minimum stock, rice price,
and others. East Java is one of the rice barns and
serves as a national food buffer. East Java is able to
supply more than 17 percent of the national rice and
supply rice in 15 other provinces through Bulog's
national distribution. Nationally, referring to Central
Bureau of Statistics (BPS) data, observed the
average price of rice in September 2014, grinding
rate for medium quality has increased price by 6.18
percent. Thus, the average medium price of rice at
the milling rate of 8,125.93 IDR increased by 1.45
percent. Central Bureau of Statistics (BPS) reported
inflation in September 2014 was quite low at 0.27
percent. Nevertheless, rice commodities returned to
be a contributing factor to inflation with a share of
0.02 percent. Previous research that discussed about
rice forecasting has been done is to predict the price
of rice in Perum BULOG East Java Division using
ARIMA method and double exponential smoothing.
Double Exponential Smoothing is used because the
data has a trend pattern but not seasonal. The results
show that interpretation of time series models is the
best method is ARIMA (Hartinungrum, 2012).
Therefore, in this study, we aim to make a model
forecasting rice price of milling in East Java using
time series analysis. The time series data is a set of
data in the form of numbers obtained within a
certain period of time. Time series data is usually in
the form of annual, semiannual, quarterly, monthly,
weekly, daily, and so on (Bisgaard & Kullahci,
2005; Wei, 2006). According to Santoso (2001) the
basis of time series data analysis is that the factors
that affect the pattern of the data set in the past and
now tend not to change much in the future. Thus, it
can be done time series data analysis to help
researchers in making decisions (Hartinungrum,
2012). Generally, the time series can be grouped into
two large chunks i.e. univariate and multivariate
time series, both seasonal and non-seasonal
(Santoso, 2001).
80
Sediono, . and Purnama, S.
Modelling and Prediction of Rice Price in East Java using Approach to the Multiplicative Time Series Analysis.
DOI: 10.5220/0008517500800084
In Proceedings of the International Conference on Mathematics and Islam (ICMIs 2018), pages 80-84
ISBN: 978-989-758-407-7
Copyright
c
2020 by SCITEPRESS – Science and Technology Publications, Lda. All rights reserved
2 METHODOLOGY
Based on the purpose of the research, there are two
steps of analysis are as follows:
I. Modeling the rice price in East Java using
Multiplicative Time series analysis approach can
be done through the following steps:
Step1: Plot the data to see the stationary of mean
and variance. For non-stationary data, the
following process is performed: a) Box-
Cox Transformation: to stability in
variance b) Differencing: to stationary the
data in the mean.
Step 2: Estimation of ARIMA model with the
following steps: a) Plot ACF
(Autocorrelation Function) to identify
Moving Average model b) Plot PACF
(Partial Autocorrelation Function) to
identify the Autoregressive model.
Step 3: Diagnostic checking for phased models
with the following steps: a) Test the
significance of ARIMA model parameters
with t-test b) White noise test with L-Jung
Box test with hypothesis: H
o
: ρ
1
=ρ
2
=…=ρ
k
= 0 vs H
1
: there is at least oneρ
i
≠
0 where i=1,2..,k and c) The residual
normality test with plot is normalized
using Kolmogorov-Smirnov test with
hypothesis: H
o
: the residual is normally
distributed vs H
1
: residual is not normally
distributed. If not obtained the best model
then repeat step 3 to get the best ARIMA
model that has significant parameters,
meet the assumption of white-noise and
normality for residual.
II. Predicting and analyzing rice price in East Java
using Multiplicative time series analysis
approach can be done through the following step:
Step 1: Predict the price of grinding rice in East
Java from January to August 2017 using
the best ARIMA model.
Step 2: Creating plot data forecast and plot data
out sample.
Step 3: Comparing plot of predicted data with
plot of data out sample whether it has the
same trend.
Step 4: Analyzing the results of the prediction.
3 RESULT AND DISCUSSIONS
3.1 Description of Rice Price Data in
East Java from January 2008 to
December 2016
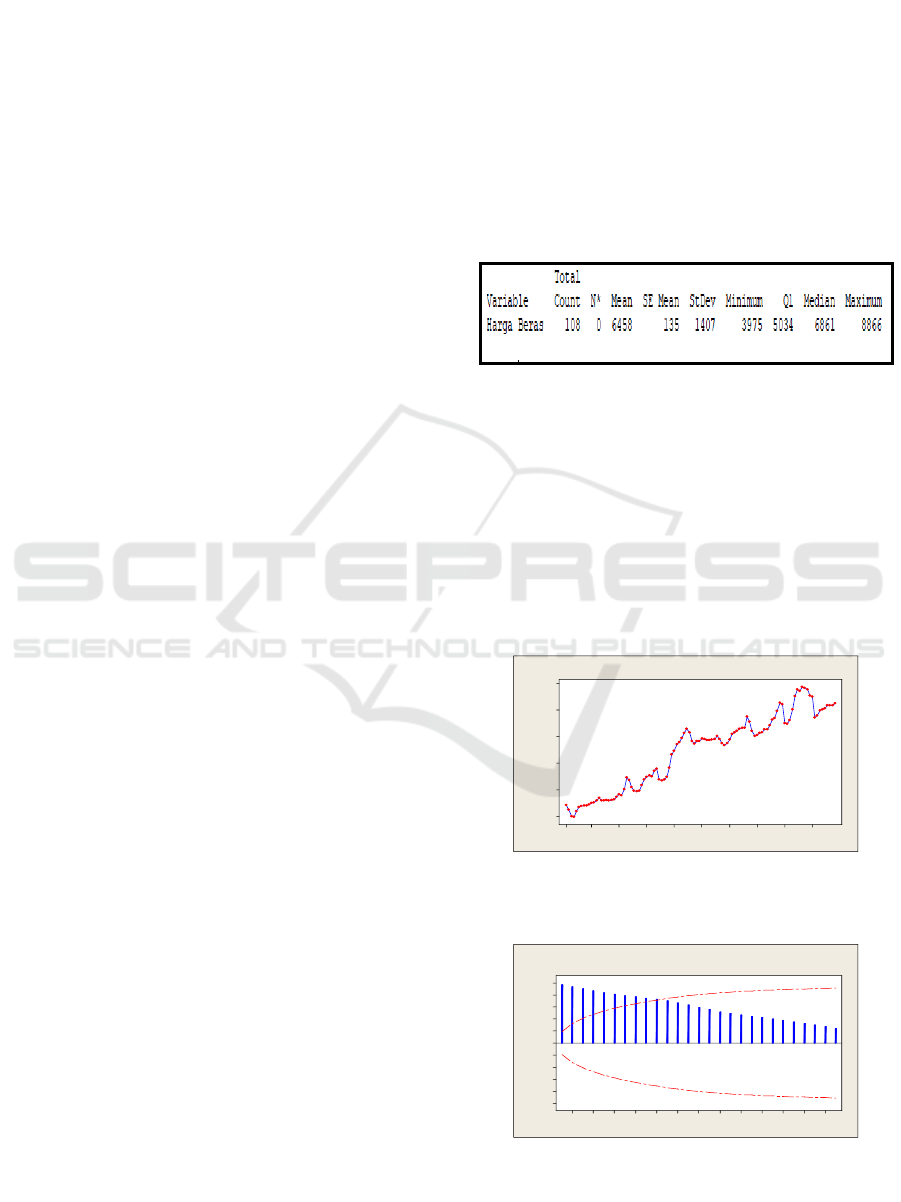
Based on data obtained from Bulog East Java from
January 2008 to December 2016, the average price
of rice in East Java is as follows:
Table 1: Description of Average Rice Price in
East Java from January 2008 – December 2016.
3.2 Modelling Price Rice in East Java
from January 2008 to December
2016 using Multiplicative Time
Series Analysis Approach
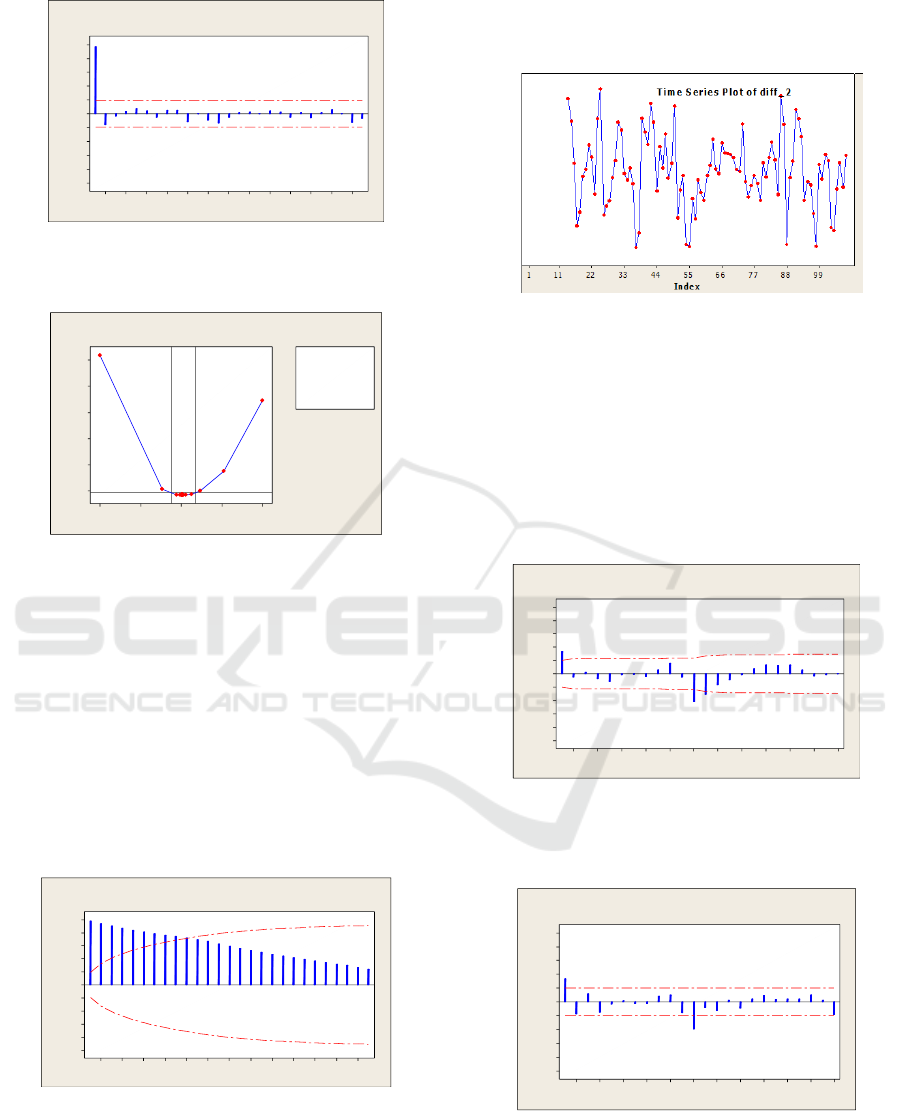
In the ARIMA process the first step that must be
done is checking the data stationarity by looking at
the time series plot, ACF plot, PACF plot, and Box-
Cox Plot of the data used.
9988776655443322111
9000
8000
7000
6000
5000
4000
Index
Rice Price
Time Series Plot of Rice Price
Figure 1: Time Series Plot of Rice Price Data in East
Java,January 2008 – December 2016.
2624222018161412108642
1.0
0.8
0.6
0.4
0.2
0.0
-0.2
-0.4
-0.6
-0.8
-1.0
Lag
Autocorrelation
Autocorrelation Function for Rice Price
(with 5% significance limits for the autocorrelations)
to
Figure 2: ACF Plot of Rice Price Data in East Java,
January 2008 – December 2016.
Modelling and Prediction of Rice Price in East Java using Approach to the Multiplicative Time Series Analysis
81
2624222018161412108642
1.0
0.8
0.6
0.4
0.2
0.0
-0.2
-0.4
-0.6
-0.8
-1.0
Lag
Partial Autocorrelation
Partial Autocorrelation Function for Rice Price
(with 5% significance limits for the partial autocorrelations)
Figure 3:PACF plot of rice price data in East Java,
January 2008 – December 2016.
5.02.50.0-2.5-5.0
220
200
180
160
140
120
Lambda
StDev
Lower CL Upper CL
Limit
Estimate 0.08
Lower CL -0.63
Upp er CL 0.88
Rounded Value 0.00
(using 95.0% confidence)
Lambda
Box-Cox Plot of Rice Price
Figure 4:Transformation Box-Cox of rice price data in
East Java, January 2008 – December 2016.
It can be seen from Figure 1, the data has a rising
trend and in Figure 4 shows that lambda (λ) = 0, so
the data is not stationary in variance, it is necessary
to do Box-Cox transformation so that the data is
stationary in variance.
After that, check whether the data used
statistically in the mean. Stationary in the mean can
be seen by looking at the graph of ACF function.
Here is a picture of an ACF chart pattern from the
Box-Cox transformed rice price data.
2624222018161412108642
1.0
0.8
0.6
0.4
0.2
0.0
-0.2
-0.4
-0.6
-0.8
-1.0
Lag
Autocorrelation
Autocorrelation Function for box-cox
(with 5% significance limits for the autocorrelations)
Figure 5: ACF plot of rice price data in East Java in
January 2008 – December 2016 after Box-Cox
Transformation.
From the Figure 5, it can be seen that the ACF value
drops slowly towards 0 which means that the data is
not stationary in the mean, it will be done
differencing.
Figure 6: Time series plot of rice price data in East Java in
January 2008 – December 2016 after Box-Cox
transformation and differencing.
Based on Figure 6, it can be concluded that the data
has no trend so that the data is stationary in the mean
or variance and continued with ACF plot to see
whether the data used is statistically in the mean.
Here's an ACF plot for rice price data after Box-Cox
transformation and differencing.
24222018161412108642
1.0
0.8
0.6
0.4
0.2
0.0
-0.2
-0.4
-0.6
-0.8
-1.0
Lag
Autocorrelation
Autocorrelation Function for diff_2
(with 5% significance limits for the autocorrelations)
Figure 7: ACF plot of rice price data in East Java in
January 2008 – December 2016 after Box-Cox
transformation and differencing.
24222018161412108642
1.0
0.8
0.6
0.4
0.2
0.0
-0.2
-0.4
-0.6
-0.8
-1.0
Lag
Partial Autocorrelation
Partial Autocorrelation Function for diff_2
(with 5% significance limits for the partial autocorrelations)
Figure 8: PACF plot of rice price data in East Java in
January 2008 – December 2016 after Box-Cox
transformation and differencing
ICMIs 2018 - International Conference on Mathematics and Islam
82
It can be seen from Figure 7; the data is
stationary in the mean and there is an indication of a
seasonal pattern because the lag coming out of the
line is 1 and 12. Next PACF plot is done to see the
possible model for testing. Here's the PACF plot for
the price data of rice after Box-Cox transformation
and differencing.
Based on Figures 7 and 8, the possible models
for testing are AR (1), SAR (1), MA (1), SMA (1)
and SMA (2). The requirements for the best model
of white noise, the parameters are marked by p-value
< α, have the smallest MSE, and the residual is
normally distributed. Table 2 is the summary results
for each possible model.
Table 2: ARIMA parameter estimation of rice data.
Model
Par
Estimates
p-value
MSE
ARIMA
(1,1,1)×
(1,1,1)
12
AR 1
-0.3436
0.212
0.0005282
MA 1
0.007
0.961
SAR 1
-0.6237
0.007
SMA 1
0.8369
0.000
ARIMA
(0,1,1) ×
(1,1,1)
12
MA 1
-0.3489
0.001
0.0005424
SAR 1
0.0478
0.757
SMA 1
0.8310
0.000
ARIMA
(1,1,0) ×
(1,1,1)
12
AR 1
0.2049
0.049
0.0005512
SAR 1
0.0270
0.857
SMA 1
0.8269
0.000
ARIMA
(1,1,1) ×
(0,1,1)
12
AR 1
-0.2826
0.265
0.0005489
MA 1
-0.6063
0.004
SMA 1
0.7453
0.000
ARIMA
(1,1,1) ×
(1,1,0)
12
AR 1
-0.2784
0.216
0.0006867
MA 1
-0.6444
0.000
SAR 1
-0.4587
0.000
ARIMA
(0,1,1) ×
(0,1,1)
12
MA 1
-0.3110
0.002
0.0005589
SMA 1
0.7320
0.000
ARIMA
(0,1,1) ×
(1,1,0)
12
MA 1
-0.4207
0.000
0.0006943
SAR 1
-0.4448
0.000
ARIMA
(1,1,0) ×
(0,1,1)
12
AR 1
0.2552
0.014
0.0005769
SMA 1
0.7229
0.000
ARIMA
(1,1,0) ×
(1,1,0)
12
AR 1
0.2725
0.008
0.0007225
SAR 1
-0.4582
0.000
ARIMA
(1,1,0) ×
(1,1,2)
12
AR 1
0.1989
0.058
0.0005410
SAR 1
-0.5167
0.887
SMA 1
0.3717
0.918
SMA 2
0.4919
0.880
Based on the smallest MSE, i.e. 0.0005589, the
appropriate model for the rice price data at the
milling level in East Java is ARIMA(0,1,1)(0,1,1)
12
or IMAISMA.
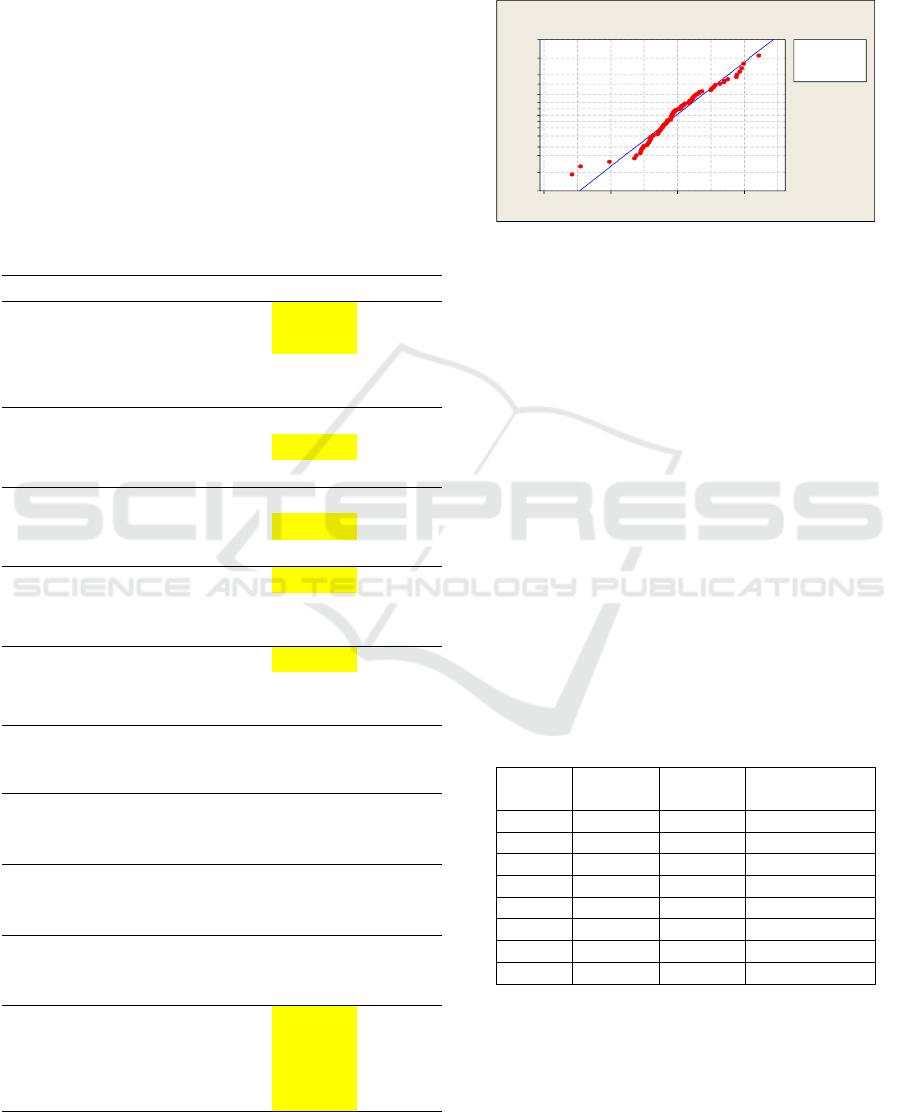
0.050.00-0.05-0.10
99.9
99
95
90
80
70
60
50
40
30
20
10
5
1
0.1
RESI1
Percent
Mean -0.0008984
StDev 0.02350
N 95
KS 0.089
P-Value 0.063
Probability Plot of RESI1
Normal
Figure 9: Normality test of the best model residual.
Based on Figure 9, the p-value for the normality
test is 0.063, this value is greater than α = 0.05,
which means that the model has met the normality
assumption.
3.3 Predicting Rice Price of Milling
Rate in East Java based on
ARIMA(0,1,1)(0,1,1)
12
or
IMAISMA model
Before to predicting the time series data, a
validation test is performed to ensure that the
forecast result of the data used is close to the actual
value, by comparing the actual data of the grinding
rice price in East Java in January to August 2017.
More details can be is described in table 3.
Table 3: Model validation results for January to August
2017.
Period
ln(Z
t
)
Z
t
Data Out
Sample
109
9,04150
8446,44
8360
110
9,02861
8338,26
8157
111
9,00689
8159,11
7812
112
8,95477
7744,75
7850
113
8,96342
7812,03
7965
114
8,98259
7963,23
7960
115
9,00685
8158,78
8078
116
9,02734
8327,68
8150
Based on table 3 and Figure 10 it can be seen that
the validity level of model forecasting trend is quite
appropriate. The forecast of the rice price of milling
in East Java for the period of January 2017 to
August 2017 is close to data sample.
Modelling and Prediction of Rice Price in East Java using Approach to the Multiplicative Time Series Analysis
83
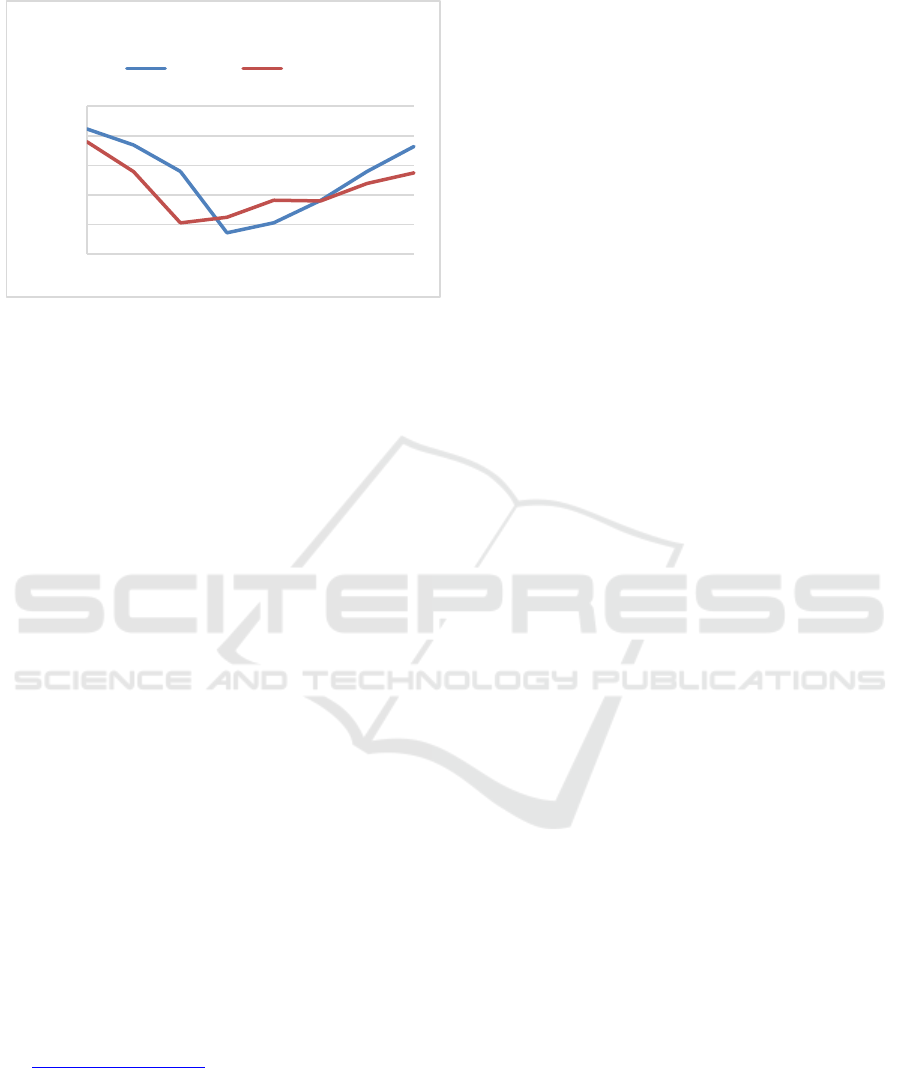
Figure 10: Plot Comparison of Forecasting Data with Data
out sample.
4 CONCLUSIONS
Based on the results of the discussion, it can be
concluded:
1) The average price of grinding rice in East Java
from January 2008 to December 2016 is
6,458.00 IDR. The lowest rice price is 3.975.00
IDR, which occurred in April 2008, while the
highest rice price reached 8,866.00 IDR which
occurred in November 2015.
2) Based on the smallest MSE, the appropriate
model for rice price data of grinding rate in East
Java period January 2008 until December 2016 is
ARIMA(0,1,1)(0,1,1)
12
or IMAISMA.
REFERENCES
Bisgaard, S. and Kullahci, M., 2005. Interpretation
of time series models. Qual.Eng. 17(4):653–658.
Hartiningrum, W. M., 2012. Forecast to rice prices
in BULOG Divre East Java. Final Report. ITS.
Surabaya. Indonesia.
Prawira, A. E., 2013. Indonesians too Overrated if
You Eat Rice.
http://health.coverage6.com/read/521271/.
Indonesia.
Santoso, Singgih, 2001. Forecasting Methods of
Today’s Business with MINITAB and SPSS.
Jakarta: PT. Elex Media Komputindo.
Wei. W. W. S., 2006. Time series analysis univatiate
and mulivariate method 2
nd
Edition. Pearson
Addison Wesley,New York.
7600.00
7800.00
8000.00
8200.00
8400.00
8600.00
1 3 5 7
T I M E S E R I E S P L O T
Forecast Actual
ICMIs 2018 - International Conference on Mathematics and Islam
84
