
Financial Crisis Model in Indonesia Based on Indonesia Composite
Index (ICI) and Dollar (US) Exchange Rates to Rupiah Indicators
Sugiyanto, Isnandar Slamet, Sri Subanti, Etik Zukhronah and Winita Sulandari
Study Program of Statistics, Universitas Sebelas Maret Surakarta, Indonesia
Keywords: Crisis, ICI, Dollar Exchange Rates to Rupiah, SWARCH.
Abstract: An open economy is a new order of the world economic system that has provided space for all countries to
interact and have integrity with one another. The economy facilitates the entry of foreign investors, but it also
impacts the threat of financial crisis that is transmitted through increasingly open trade relations. The
movement of the Indonesia Composite Index (ICI) and the dollar (US) exchange rates to rupiah are used to
compile a model of the financial crisis in Indonesia. Crisis occurs due to high volatility and changing
conditions. Volatility models are used to explain volatility, while changes in conditions can be explained
through Markov switching. Therefore combining the volatility and Markov switching models is the best
solution to explain the crisis. The goal of this research is to find the model of the financial crisis in Indonesia
based on ICI and dollar (US) exchange rates to rupiah. The data that users are monthly data from 1990 to the
2017 year. The result showed that for ICI indicator the combining model is MS(2)-ARCH(1) or
SWARCH(2,1) model with a conditional average of AR (2). While based on the dollar (US) exchange rates
to rupiah indicator, SWARCH (3.3) model with conditional average of AR(1).
1 INTRODUCTION
The open economy system has presented challenges
to developing countries such as Indonesia, with the
integration of the country's financial sector. But on
the other hand, it can facilitate the spread of crises
between countries, as happened in 1997 when the
value of the Thailand currency fell sharply, and the
impact spread to various countries. The crisis is a
disruption of financial system stability in the
economic order. To maintain this stability, it is
necessary to monitor the occurrence of crisis, so that
prevention and crisis recovery efforts can be carried
out as early as possible.
Banking and capital markets in Indonesia become
indicators of financial systems that continue to
increase every year. This has caused the development
of capital market developments and the growth of the
banking sector because transactions in the capital
market are carried out through the banking system.
The higher the investment, the greater the savings and
the opportunity to provide funds which will
ultimately accelerate economic growth. The
Indonesia Composite Index (ICI) and the dollar
exchange rates to rupiah have a vulnerability to
economic stability shocks, this causes these indicators
to fluctuate and condition changes. In anticipation,
Hamilton and Susmel (1994) introduced the
Autoregressive Conditional Heteroscedasticity
Markov Switching (SWARCH) model which is a
combination of volatility and Markov switching
models as an alternative time series data modeling by
observing fluctuations and changes in conditions in
the data. Sugiyanto et al. (2017) through the
SWARCH model has shown that the bank deposits,
real exchange rates and terms of trade indicators can
explain the crisis of 1997, 1998 and 2008. Sugiyanto
et al. (2018) through the SWARCH model has shown
that the output real, domestic credit per GDP, and ICI
indicators can explain the crisis of 1997, 1998 and
2008. In this study a combination of volatility and
Markov switching models was formed which
corresponded to the ICI indicator and the dollar
exchange rates to rupiah to detect the financial crisis
in Indonesia.
46
Sugiyanto, ., Slamet, I., Zukhronah, E., Subanti, S. and Sulandari, W.
Financial Crisis Model in Indonesia Based on Indonesia Composite Index (ICI) and Dollar (US) Exchange Rates to Rupiah Indicators.
DOI: 10.5220/0008517000460051
In Proceedings of the International Conference on Mathematics and Islam (ICMIs 2018), pages 46-51
ISBN: 978-989-758-407-7
Copyright
c
2020 by SCITEPRESS – Science and Technology Publications, Lda. All rights reserved

2 LITERATURE REVIEW
2.1 Autoregressive Moving Average
(ARMA) Model
The ARMA (p, q) model has a general form
(1)
where r
t
is the transformation value in the t-period,
0
is a constant,
p
is the parameter for AR,
is the
parameter for MA and
is the T-period of residual
of ARMA (p, q) model (Tsay, 2002).
2.2 Autoregressive Conditional
Heterocedasticity (ARCH) Model
ARCH (m) model can be written as
for
and
,
(2)
where
is the standardized residual volatility model,
ψ
t-1
is the set of all period information (t-1)
th
, m is the
order of the ARCH model, α
0
is the constant of ARCH
model, α
i
is the parameter of ARCH model, and σ
t
2
is
T-period residual variance (Tsay, 2002).
2.3 Generalized Autoregressive
Conditional Heterocedasticity
(GARCH)Model
If the order of the ARCH model is too high, then the
GARCH (m, s) model is used in the form
for
and
where β
j
is the parameter of GARCH model (Tsay,
2002).
2.4 Exponential Generalized
Autoregressive Conditional
Heterocedasticity (EGARCH)
Model
If there is a leverage effect in the GARCH model,
EGARCH (m, s) model is used in the form
for
and
,
where γ
i
is the EGARCH model parameter (Henry,
2007).
2.5 SWARCH Model
The SWARCH model according to Hamilton and
Susmel (1994), can be written as
,
(3)
where μ
st
is a conditional average in a state and σ
t,st
2
is the residual variance in a t-period state.
2.6 Smoothed Probability
In the Markov chain, the next state only depends on
the current state. The Markov chain process can be
written as
where p
ij
is the transition probability that the process
of being in state i at time t will go to state j at time t+1
or it can be said that the state undergoes a transition
from state i to state j. The one-step transition
probability matrix for infinite states is given as
where p
ij
≥ 0 for i, j = 1,2, ... and
∞
for i
= 1,2, ….
According to Kim and Nelson (1999), the value
of smoothed probability
can be formulated as
where
is a collection of all information in the
observation data until the T-time.
Financial Crisis Model in Indonesia Based on Indonesia Composite Index (ICI) and Dollar (US) Exchange Rates to Rupiah Indicators
47

3 METHODS
This study is a case study using the ICI monthly data
and the dollar exchange rates to rupiah taken from
1990 to 2017. The data used was obtained from Bank
Indonesia and the Central Statistics Agency.
Calculation and estimation of the model is done with
software R. The following steps are taken to achieve
the research objectives on each indicator:
1. Making a data plot then perform Augmented-
Dickey Fuller (ADF) test to determine the
stationary of data. If it is not stationary, then the
data is transformed.
2. Plotting the autocorrelation function (ACF) and
the partial autocorrelation function (PACF) of the
transformation data to form the ARMA(p,q)
model, then testing of independency, normality,
and heteroscedasticity of the residual ARMA
models using the Ljung-Box test, Kolmogorov-
Smirnov test, and the Lagrange Multiplier (LM)
test respectively.
3. Establish and conduct diagnostic tests on the best
model of volatility.
4. Clustering the residual value of the ARMA model.
5. Form a combination of volatility and Markov
switching models based on the number of clusters.
6. Calculating the value of smoothed probability to
detect the occurrence of a crisis in the past.
4 RESULTS AND DISCUSSION
4.1 Plot of Data
Plot of ICI indicator and dollar (US) exchange
rates to rupiah indicators can be seen in Figure 1.
Figure 1 shows that the data fluctuates from time to
time so that it is indicated that the data is not
stationary. Then the ADF test was conducted to see
the stationary data. Based on ADF testing, the
probability values are 0.6934 and 0.2793 for the ICI
and the dollar exchange rates to rupiah indicators is
greater than α = 0.05, which means that the data is not
stationary.
According to Tsay (2002), economic indicators
tend to fluctuate from time to time so transformation
needs to be done. The most suitable transformation
for the ICI indicator and the dollar exchange rates to
rupiah is the log return. Then the ADF was tested on
the transformation data and obtained the probability
values of 0.01 and 0.01 respectively, so it was
concluded that the ICI and the dollar exchange rates
to rupiah indicators of transformed data were
stationary.
Figure 1: (a) ICI Data (b) Dollar exchange rates to rupiah
Data
4.2 Form of ARMA(p,q) Model
The ARMA (p, q) model can be identified using ACF
and PACF plots from the transformation data of each
indicator. Based on the ICI indicator, using equation
(1) it was obtained the best model was ARMA (1, 0)
and written as
.
While the best model for the dollar exchange rates
indicator was ARMA (2, 0), which can be written as
Furthermore, the feasibility test of the ARMA
model includes the independence test, normality test
and heteroscedasticity test on the residues of the
ARMA model for each indicator. Heteroscedasticity
effect test can be done using the Lagrange Multiplier
(LM) test, and it was obtained the probability values
for ICI and dollar exchange rates to rupiah indicators
of 0.0000 and 0.0000 respectively so that it can be
concluded that there was an effect of
heteroscedasticity on the residual of ARMA model of
each indicator.
4.3 Form of Volatility Models
The estimation results for the ICI indicator using
equation (2) are the best volatility model, ARCH(1),
can be written as
ICMIs 2018 - International Conference on Mathematics and Islam
48
For the dollar exchange rates to rupiah indicator, the
best volatility model is ARCH (3), that can be written
as
Furthermore, diagnostic tests were carried out on
standardized residues of ARCH(1) model for ICI and
dollar exchange rates to rupiah indicators. Based on
Ljung-Box statistics, the probability value were 0.892
and 0.9936 which means that there was no residual
autocorrelation. Based on LM test, it was obtained the
probability of 0.07197 and 0.9936 respectively which
means that there was no effect of heteroscedasticity
in the residue. Based on the Kolmogorov-Smirnov
test, probability is 0.6 and 0.2222 which means that
the residue is normally distributed. Based on
diagnostic tests that have been carried out on the two
indicators, it can be concluded that the ARCH (1)
model is good to use.
4.4 Cluster Analysis
Cluster analysis uses the ward hierarchy method to
determine the number of cluster of volatility
clustering that will be used in the Markov switching
model and in determining the value of smoothed
probability. The result of cluster analysis of ICI
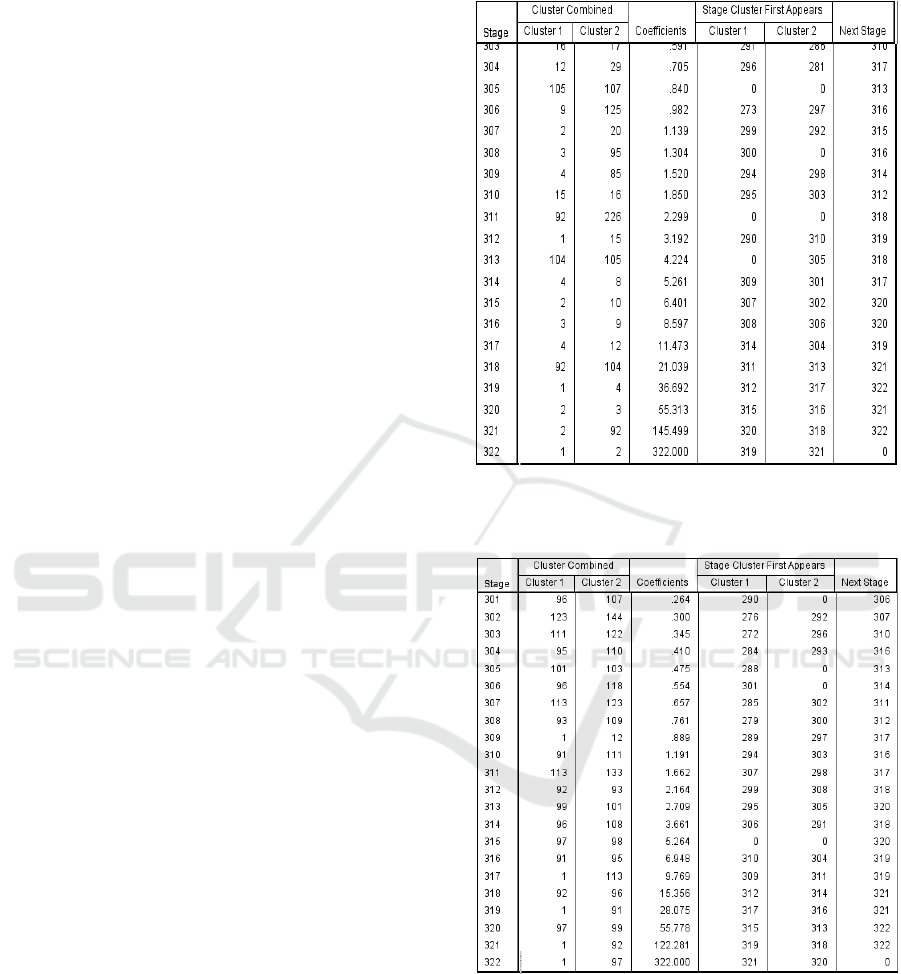
indicator can be seen in Table 1.
In column 1 Table 1, it can be seen that at stage
320
th
has coefficient 55.313 (column 4) and at stage
321
st
has 145.499. The increase of coefficient is not
drastic, but the first drastic surge of 176,501 occur in
the 321
st
and 322
nd
stages, from 145,499 to 322 this
occurred when the agglomeration process produced
two clusters for the ICI. The result of cluster analysis
of dollar exchange rates to rupiah indicator can be
seen in Table 2.
In column 1 Table 2, it can be seen that at stage
320
th
has coefficient 55.778 (column 4) and at stage
321
st
has 122.281 where this is the first drastic surge
of the coefficient that is 66,503. It occurred when the
agglomeration process produces three clusters.
Furthermore, the formation of SWARCH models
with 2 states for ICI indicators and 3 states for dollar
exchange rates indicators.
Table 1: Results of cluster analysis of ICI.
Table 2: Results of cluster analysis of dollar exchange rates
to rupiah.
4.5 Form of Markov Switching and
Volatility Models
In the Markov model, switching condition changes
are considered as an unobservable random variable
called state. To model changes in these conditions can
be formed transition probability matrix. The
Financial Crisis Model in Indonesia Based on Indonesia Composite Index (ICI) and Dollar (US) Exchange Rates to Rupiah Indicators
49
conditions intended in this study are conditions of low
and high volatility. The transition probability matrix
for the ICI indicator is written as follows
Based on the P transition probability matrix, the
probability value to survive in low volatility is
0.98389655 and high volatility is 0.94222905. While
the probability transition matrix for the dollar
exchange rates to rupiah indicator is written as
follows
Based on the Q transition probability matrix
obtained the probability value to withstand low
volatility of 0.95802949, the probability value to
withstand moderate volatility of 0.980435796 and the
probability value to withstand high volatility of
0.976919050.
The best combination of volatility and Markov
switching models for ICI indicators using equation
(3) is SWARCH (2, 1) with conditional averages and
conditional variances for each state are
and
The best model for the dollar exchange rates to
rupiah indicator is SWARCH (3, 3) with conditional
averages and conditional variances for each state
respectively
and
4.6 Determination of Crisis
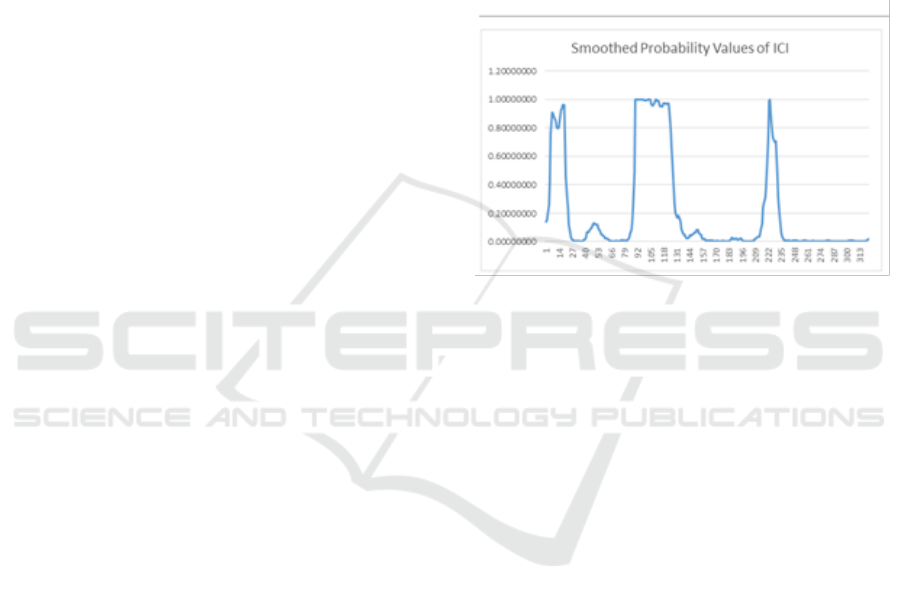
Figure 2 shows the plot of smoothed probability from
the SWARCH (2,1) model for the ICI indicator that
calculated using equation (4).
If the value of smoothed probability is less than
0.4708 so the condition is stable, while the crisis is
when the smoothed probability value is more than
0.4708. From figure 2, it can be seen that in March to
June 1990, August 1990 to October 1991, July 1997
to August 2000, and July 2008 to April 2009 were
detected to be a crisis.
Figure 2: Smoothed probability for ICI.
Figure 2 shows the value of the smoothed probability
of the dollar (US) exchange rates to rupiah. The crisis
occurs when the value of the smoothed probability is
greater than 0.9024 and prone to the crisis if the value
of smoothed probability is between 0.4086 and
0.9024, while the state is stable if the value of
smoothed probability is less than 0.4086. Based on
this limit, the crisis was detected in July 1997 to
October 2000, March 2001 to September 2001, and
October 2008 to April 2009.
5 CONCLUSIONS
Based on the results and discussion, it was obtained
findings as follows:
1. The ICI and dollar exchange rates to rupiah
indicators can be modeled by SWARCH (2,1) and
SWARCH (3, 3), and can capture the crisis that
occurred in 1997, 1998 and 2008.
2. Indicator of the dollar (US) exchange rates to
rupiah is more sensitive than ICI to explain crisis
conditions in accordance with facts.
ICMIs 2018 - International Conference on Mathematics and Islam
50

REFERENCES
Hamilton, J. D. and Susmel, R., 1994. Autoregressive
conditional heteroscedasticity and changes in regime.
Journal of Econometrics, vol. 64, pp. 307 – 333.
Henry, O. T., 2007. Between the rock and a hard place:
regime switching in the relationship between short-term
interest rates and equity returns in the UK. Research
Paper Number 1019, Department of Economics, the
University of Melbourne.
Kim, C. J. and Nelson, C. R., 1999. State space models with
regime switching, classical, and Gibs sampling
approaches with applications. MIT Press.
Sugiyanto, Zukhronah, E. and Aini, N. A., 2017. Models
for financial crisis detection in Indonesia based on bank
deposits, real exchange rates and terms of trade
indicators. Journal of Physics: Conf. Series
943(012024), pp. 1 – 6.
Sugiyanto, Zukhronah, E. and Setianingrum, M., 2018. The
detection of financial crisis using combination of
volatility and Markov switching models based on real
output, domestic credit per GDP, and ICI indicators.
Journal of Physics: Conf. Series 1025(012115), pp.1 –
6.
Tsay, R.S., 2002. Analysis of financial time series. John
Wiley and Sons, Canada.
Financial Crisis Model in Indonesia Based on Indonesia Composite Index (ICI) and Dollar (US) Exchange Rates to Rupiah Indicators
51
