
Measuring Financial Performance of State-Owned Enterprises under
Aviation in Indonesia:
Case Study: PT. Angkasa Pura I and PT. Angkasa Pura II
Wiwiek Mardawiyah Daryanto
LPPM, Sekolah Tinggi Manajemen IPMI, Jl. Rawajati Timur I/1, Kalibata, Jakarta 12750, Indonesia
Keywords: Financial Performance, Financial Ratios, SOEs, VIWI, Aviation.
Abstract: Visit Wonderful Indonesia (VIWI) 2018 is the government program with targets of 17 million tourists and
18 destinations across Indonesia. An excellent performance of State-Owned Enterprises (SOEs) under
aviation is mandatory. This study aims to measure the financial health conditions of the two SOEs under
aviation i.e PT Angkasa Pura I (AP I) and PT Angkasa Pura II (AP II) in 2011-2015. The Decree No.KEP-
100/MBU/2002 of Indonesia Ministry of SOEs on June 2002 provides the mandatory of measuring and
rating the financial health condition of SOEs. The results of eight financial ratios investigating; 1) return on
equity, 2) return on investment, 3) cash ratio, 4) current ratio, 5) collection period, 6) inventory turnover, 7)
total asset turnover, 8) total equity to total asset, then to be validated by the said Ministry of SOEs Decree to
conclude the yearly financial health conditions of each SOEs The result shows that in 2011 - 2015, both
SOEs achieved healthy financial condition levels, although AP II was better in performance than AP I as
shown in the rating as follows; AP I (BBB, BBB, BBB, A, and A); and AP II (AA, AA, A, A, and A).
However, AP I was successfully achieved the highest levels in 2014 and 2015, from B to A levels. This
study has added the knowledge in the financial literature. It also gives a strong insight for managers in
aviation industry about the financial performance. Therefore, the managers could make decisions to increase
both market share and profitability.
1 INTRODUCTION
Arief Yahya as the Indonesia Minister of Tourism,
stated that in 2015, tourism sector contributed 10%
of GDP, which is the highest nominal in ASEAN, or
USD 82.4 B. The number of tourists was
10,406,759, while in Thailand was 29,881,091 with
contribution to GDP was only USD 81.6 B
(Khumaedy, 2017 available at
http://setkab.go.id/penerbangan-menuju-destinasi-
pariwisata). The development of tourism sector will
significantly affect the growth of air lines business
and drive the increase of foreign income of the
country, due to the average spending of a foreign
tourist about USD 1,100 – 1,200 per visit (Central
Bureau of Statistic, 2016). In addition, the area of
Indonesia that lies between the Indian Ocean and the
Pacific Ocean make Indonesia’s position very
strategic
, and also consists of thousand islands from
Sabang to Merauke. In supporting the aviation
industry, right now Indonesia has two companies
under aviation, 1) PT Angkasa Pura I (Persero), or
AP I; and 2) PT Angkasa Pura II (Persero), AP II.
AP I and AP II are the State-Owned Enterprises
(SOEs) in the Ministry of Transportation
environment that are engaged in airport services and
airport related services in Eastern and Western parts
of Indonesia respectively. The functions of both
companies are managing airport businesses and
airport related services by optimizing the utilization
of their potential resources, especially to support the
VIWI 2018. AP I and AP II are the State-Owned
Enterprises (SOEs) in the Ministry of
Transportation environment that are engaged in
airport services and airport related services in Eastern
and Western parts of Indonesia respectively.
The Government of Indonesia decides that it is
mandatory to the company under the Ministry of
SOEs that they should implement financial ratio to
measure the level of financial health condition. The
previous research about financial performance has
been discussed in many sectors such as hospital,
bank, and small business. Edmister (1972) stated
that financial ratio is really useful to measure the
Daryanto, W.
Measuring Financial Performance of State-Owned Enterprises under Aviation in Indonesia: Case Study: PT. Angkasa Pura I and PT. Angkasa Pura II.
DOI: 10.5220/0008488800990104
In Proceedings of the 7th International Conference on Entrepreneurship and Business Management (ICEBM Untar 2018), pages 99-104
ISBN: 978-989-758-363-6
Copyright
c
2019 by SCITEPRESS – Science and Technology Publications, Lda. All rights reserved
99

performance of small business and it can be used to
predict the failure. Washington (2001) stated that
research on the ability of financial models to provide
an early warning of corporate failure is favourable.
The users of business information are often
stakeholders who rely heavily on financial reports.
Lan (2012) stated that ratio analysis is one of the
most widely used fundamental analysis techniques.
Ratio analysis is a tool that was developed to
perform quantitative analysis on numbers found on
financial statements. Ratios help link the three
financial statements together and offer figures that
are comparable between companies and across
industries and sectors.
However, the literature about financial
performance in aviation industry is very limited.
Therefore, this study investigates the association
between financial performances of both aviation
SOEs, AP I and AP II for the periods of 2011-2015,
which then the results to be validated by the decree
of the Ministry of SOEs No. KEP-100/MBU/2002.
This study is beneficial for academician because it
extends the knowledge of financial ratio in the real
practice. Besides that, it could help students and
lecturers to understand financial ratio more
effectively. In addition, this study is also important
for managers because it can help them to analyse the
company’s situation and guide them to make
decisions.
Research Questions
1. How healthy was the financial performance of
the two aviation industries based on the decree of
the Ministry of SOEs No. KEP-100/MBU/2002)?
2. What was the difference of financial
performance between both aviation SOEs, AP I
and AP II?
2 LITERATURE REVIEW
2.1 Previous Research on Financial
Ratio
Financial ratio is a good evaluation method to
measure the company performances (Megaladevi,
2015). Company usually uses this method to
compare their performance with other competitors.
There have been a large number of empirical studies
on financial ratio on different industries around the
world (Yeh, 1996; Webb, 2003; Lacewell, 2003;
Halkos and Salamouris, 2004; Tarawneh, 2006).
However, there are limited resources which evaluate
the financial performance of Estate Palm Oil
Enterprises in Indonesia. According to Tarawneh
(2006), the financial ratio analysis (FRA) has been
applied in Banking industry to examine, evaluate,
and ranked based on their performance. Based on the
study in Oman Commercial Banks, financial
performance has relationship with asset
management, size and operational efficiency. There
are two methods to measure the financial
performances which are accounting and market
measurement. There are many researchers who
prefer to use accounting measurement (Waddock
and Graves, 1997; Cochran and Wood, 1984), rather
than market measurement (Alexander and Buchholz,
1978; Vance, 1975), and some of them adopt both
methods (McGuire et al., 1988). There are few
differences between accounting and market
measurement methods. In accounting, company uses
the historical aspects to measure their financial
performance (McGuire et al., 1986) and it contains
a bias which lead to managerial manipulation. On
the other hand, market measurement method is
straight forward, focuses on performance and
represents the ability of a company to generate
future income (McGuire et al., 1988).
2.2 The Decree of Ministry of SOEs
Based on the Decree of Ministry SOEs No. KEP-
100/MBU/2002 about financial health assessment of
SOEs, the growth of business should be supported
by good infrastructure and evaluation system to
measure the efficiency and level of competition
among SOEs. This financial evaluation applies to all
state-owned enterprises in the financial and non-
financial industry. In non-financial industry, the
companies are divided into infrastructure and non-
infrastructure. This evaluation method consists of
three aspects which are financial, operational, and
administration. In a financial aspect, the total weight
score for infrastructure is 50 and non-infrastructure
is 70. There are eight indicators to measure the
financial health such as return on investment (ROI),
return on equity (ROE), cash ratio, current ratio
(CR), collections period (CP), inventory turnover
(ITO), total asset turnover (TATO), and total equity
to the total asset (TETA).
3 RESEARCH METHODOLOGY
Descriptive financial ratios were used to measure,
describe, analyse, and evaluate the financial health
conditions of two state owned cement enterprises
under the Ministry of Industrial, AP I and AP II,
ICEBM Untar 2018 - International Conference on Entrepreneurship and Business Management (ICEBM) Untar
100

because those companies are state owned enterprises
in non-financial services which qualified in the
decree of the Ministry of State Owned Enterprises
No.KEP-100/MBU/2002 about financial health
assessment of SOEs. All variables used are ratio
measurement scales were taken from the decree. The
data were collected from their Annual Report
(audited) between 2011 and 2015. In addition, this
decree was used to validate the financial health
condition level of those enterprises whether in the
levels of very healthy level (AAA, AA, A), or
healthy level (BBB, BB, B), or unhealthy level
(CCC, CC, C).
The selection of the Financial Ratio Analysis
(FRA) method for this study is motivated the
researchers’ knowledge due to limited literature
review on aviation industry in Indonesia. In addition,
financial ratios can be used to identify a company’s
specific strengths and weaknesses as well as
providing detailed information about company
profitability, liquidity, activity and solvency
(Hempel et al., 1994: Dietrich, 1996). Although
accounting data in financial statements is subject to
manipulation and financial statements are backward
looking, they are the only detailed information
available on the company’s overall activities
(Sinkey, 2002). Furthermore, they are the only
source of information for evaluating management’s
potential to generate satisfactory returns in the future
(Kumbirai and Webb, 2010). Oil business requires
high capital, high technology, high risks, long-term
commitment, but may be high returns (Daryanto,
2018). Dozens of ratios can be computed from a
single set of financial statement (Anthony et al.,
2011). Analyzing financial statements involves
evaluating three characteristics: a company’s
liquidity, profitability, and solvency (Kieso et al.,
2016) The company are encouraged to maintain their
profitability by increasing its activity ratios
(Daryanto, 2018).
4 ANALYSIS AND DISCUSSIONS
4.1 Profitability Analysis of AP I
Table 1 shows information about the percentage of
return on equity (ROE) and return on investment
(ROI) of AP I for 2011 – 2015, which was based on
its Annual Reports. Basically, the percentage of ROI
increased along with the percentage of ROE. The
percentage of ROI was slightly increased around
3.34% from 7.04% in 2011 to 10.38% in 2012. Yet,
between 2014 and 2015 the percentage of ROI was
decreased from 13.66% to 12.77%. Overall, the
percentages of ROE of 2011-2015 of AP I were
6.11%, 6.92%, 6.81%, 8.93%, and 7.63%, as
shown in Table 1.
While the percentages of ROI,
7.04%, 10.38%, 11.11%, 13.66%, and 12.77%
respectively.
4.2 Profitability Analysis of AP II
Table 2 gives information about the percentages of
return on equity (ROE) and return on investment
(ROI) of AP II for 2011-2015, which was based on
its Annual Reports. In 2011, ROI of AP II could
reach 19%. And in 2015, it decreased to 16%.
Overall, it shows the percentages of the ROI of AP
II, 18.77%, 18.86%, 13.81%, 13.23%, and 15.75%
respectively. Although the percentages ROI of AP II
was higher than AP I, both companies were in good
profitability conditions, in which the ability of funds
invested in assets could generate good profits. The
same with the trend of ROE figures, the percentages
of ROE of AP II was also higher than of AP I in
2011-2015, as shown in Table 1 and Table 2. In fact,
the economy of Western Indonesia is more advance
compared with Eastern Indonesia. Overall, the
percentages of ROE 2011-2015 of PT AP II,
12.11%, 12.52%, 7.72%, 8.83%, and 10.39%.
While the percentages of ROI of AP II, 18.77%,
18.86%, 13.81%, 13.23%, and 15.75% respectively
for 2011-2015, as shown in Table 2.
4.3 Liquidity Analysis of AP I
Table 1 shows the percentage of cash ratio and a
current ratio of AP I from 2011 to 2015. Overall,
there was a sharp decrease in the percentage of cash
ratio and current ratio; cash ratios (451.1%;
151.56%; 43.7%; 60.61%; and 72.63%); current
ratios (494.22%; 174.6%; 84.08%; 92.77%, and
114.35%). In the horizontal analysis, the average
current ratio for the past five years was 192.004%
which means that IDR 1,-of current liability were to
be guaranteed by IDR 1.92 of a current asset.
Between 2011 and 2013, the percentage of current
ratio was decline from 494.22% to 84.08% and then
it begun slightly increase to 114.35% in 2015. In
cash ratio, the percentage decreased sharply from
415.10% in 2011 to 43.70% in 2013. But then it
started raise from 60.61% in 2014 to approximately
72.63% in 2015.
4.4 Liquidity Analysis of AP II
Table 2 shows the trend of cash ratio and current
Measuring Financial Performance of State-Owned Enterprises under Aviation in Indonesia: Case Study: PT. Angkasa Pura I and PT.
Angkasa Pura II
101

ratio of AP II 2011- 2015. In the horizontal analysis,
the average current ratio for the past five years
was 323.6% which means that IDR 1, - of current
liability were to be guaranteed by IDR 3.236 of a
current asset. Between 2011 and 2014, the
percentage of current ratio was declined from 543%
to 147% and then it begun slightly increased to
176% in 2015. In cash ratio, the percentage
decreased slightly from 333% in 2012 to 169% in
2013. But then it started to raise from 74% in 2014
to approximately 128% in 2015. Overall, there was a
sharp decrease in the percentage of cash ratio and
current ratio; cash ratios (390%; 333%; 169%; 74%;
and 128%); current ratios (543%; 473%; 279%;
147%, and 176%). As shown in Tables 1 and 2, the
liquidity ratios of AP I and AP II have already
decreased, not too liquid, still above the standard
ratios of minimum 100%. In general, the liquidity
ratios of both companies were very good.
4.5 Activity Analysis of AP I and AP II
Table 1 shows in detail of days’ receivable of AP I
in 2011-2015; 18, 20, 43, 41, and 40 days
respectively. Table 2 shows in detail of days’
receivable of AP II in 2011-2015; 20, 26, 62, 61and
35 days respectively. Both SOEs experienced
increase in the ratios, or inefficient in the collection
of receivables. This was due to lack of discipline in
the payments of the partners of against the
commitments contained in the agreed contract.
However, based on the said Decree, it can be
concluded that the ratios were in good condition and
the management of the receivable ran efficiently.
Figure 6 shows the trend of ITO of AP I and AP II in
2011-2015. Table 1 shows in detail of the ITO of AP
I; (1.2, 1.5, 1, 1.2, and 2.5) days respectively. While
the Table 2 shows in detail of the ITO of AP II;
(0.92, 1.25, 1.18, 1.25, and 0.72) days respectively.
Both SOEs were very efficient in managing their
inventory. In detail, the TATO ratios of AP I were
26.31%, 25.74%, 28.46%, 35.3%, and 37.44%, as
shown in Table 1. The ratios were increase
slightly from 26.31% in 2011 to 37.44% in 2014.
Table 2 shows the TATO ratios of AP II; 60%,
48%, 34%, 35%, and 31% respectively in 2011-
2015. The ratios were decrease significantly, 60% in
2011 to 31% in 2015. It shows that the company less
efficient in managing the asset employed to generate
revenues.
4.6 Solvency Analysis of AP I and AP
II
Overall, there were decrease in the ratios of AP I,
(87.91%, 79.63%, 72.97%, 65.72%, and 65.95%), as
shown by Table 1. While Table 2 presents the
percentage of TETA ratios in 2011-2015 of AP II.
Overalls, the TETA ratios were stable; 91%, 91%,
87%, 83%, and 80%. Both companies were in
solvent conditions, they have no problem in
repayment their long- term obligations, because all
ratios were above the standard of 50%, or in low
risks conditions. It means that, more than 50% of
their assets were financed by equity, not liability.
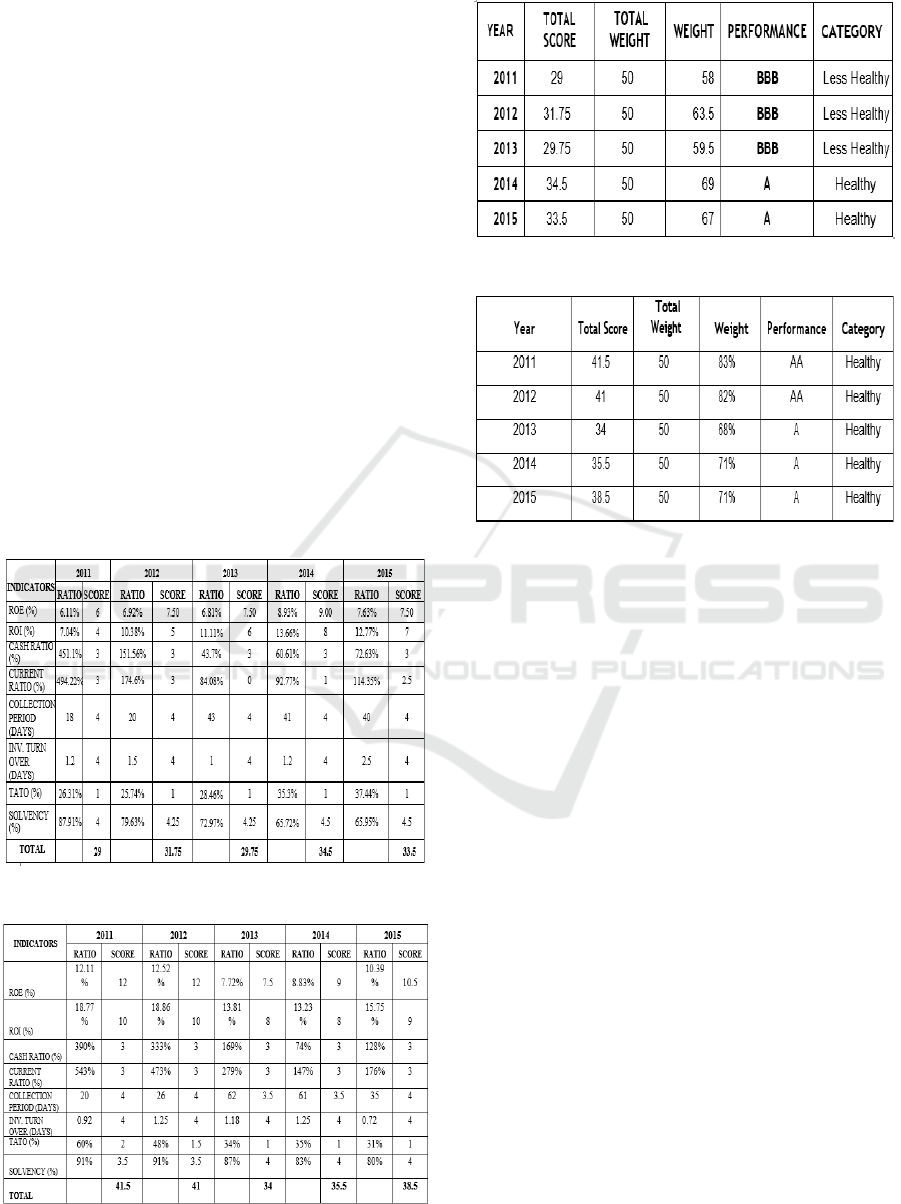
5 VALIDATION TESTING
To examine the level of financial assessment for
both SOEs under aviation enterprises whether in
healthy or less healthy or unhealthy position for
2011-2015, the decree of Ministry of SOEs No.
KEP- 100/MBU/2002 is employed to test the
validation. Overall, based on Table 1, there was a
slight increase in the total score of AP I. It increased
slightly from 29 in 2011 to 31.75 in 2012. Then,
decreased to 29.75 in 2013; and increased again to
34.5 in 2014; and decreased slightly to 33.5 in 2015.
Next, the total score converted to the total weight
with the calculation formula (total score/weight)
multiplied by 100. The highest weight score was 69
in 2014 with level A which considered as healthy
financial condition. The lowest weight score was 58
in 2011 with level BBB that considered as less
healthy financial condition, as shown in Table 3. As
data shown in Table 2, there were decreases in the
total score in 2011- 2015. It decreased slightly from
41.50 in 2011 to 41 in 2012, and 34 in 2013. Then, it
increased to 35.5 in 2014, and 38.5 in 2015. Next,
the total score was converted to the total weight with
the calculation formula (total score/weight)
multiplied by 100. AP II got financial healthy levels
of AA, AA, A, A, and A respectively in 2011-2015,
as shown in Table 4.
6 LIMITATION
This study has expanded the literature about
financial performance in the real working world.
Since the focus is on one industry, it is worth to
explore it on a wider scale and find out if different
company yields the same result. In addition, the
ICEBM Untar 2018 - International Conference on Entrepreneurship and Business Management (ICEBM) Untar
102

study only focuses on financial aspects. It is
suggested to measure the financial performance of
SOEs in other aspects such as operational and
administration.
7 CONCLUSION &
RECOMMENDATION
The study shows the financial performance of
aviation industry in 2011-2015, and was based on
the decree of the Ministry of SOEs No. KEP-
100/MBU/2002 about financial health assessment of
SOEs. The study concerns about four classifications
of ratio measurement that includes liquidity,
solvency, profitability, and activity ratios. The
outcome shows that PT. AP I and PT. AP II
experienced stable financial performance in the
period. This was caused by the effort done by both
SOEs to achieve a target of VIWI 2018, which was
set up by the government. The result shows that
during the five years period, 2011 to 2015, both
SOEs have achieved healthy financial condition
levels and rating as follows; AP I (BBB, BBB, BBB,
A and A); and AP II (AA, AA, A, A, and A). In the
last two years, AP I has achieved an excellent level
of financial health, although in the first three years
were only BBB, or less healthy levels respectively.
On the other hand, AP II has achieved excellent A
level for the period, although it was decreased
slightly during the last two years, from double AA to
single A only. It can be concluded that AP II has
better performance compared to AP I. However,
it was proven that both SOEs supported the
government program of developing excellent
services in the aviation industry. A similar study has
been done by Pratama (2017) for SOE in
Telecommunications industry for 2011-2015, with
results of financial health levels of A, A, A, A, and
BBB. Daryanto (2017) carried out the similar study
as well in three SOEs of Palm Oil Agroindustry
2011-2015. This study has added the knowledge
in the financial literature. It also gives a strong
insight for managers in cement industry about the
financial performance. Therefore, the managers can
make a better decision with the purpose to increase
the market share and the profitability.
REFERENCES
Alexander, G. J., and Rogene A. Buchholz (1978)
“Corporate social responsibility and stock market
performance.” Academy of Management Journal, 21
(3): 479-486.
Annual Reports 2011 – 2015 of PT. Angkasa Pura I
(Persero).
Annual Reports 2011 – 2015 of PT. Angkasa Pura II
(Persero).
Anthony, R.N; Reece, J.S. and Hertenstein, J.H. 2011.
Accounting: Text and Cases, 13th Edition. Irwin,
Chicago.
Daryanto, Wiwiek M (2017). Financial Performance
Analysis and Evaluation of Palm Oil Agroindustry: An
Indonesia Experience. Jurnal Ilmiah Manajemen dan
Bisnis. Vol. 3, Nomor 1, Maret 2017. ISSN 2460
8424, pp 108-126.
Daryanto, Wiwiek M., Primadona A. (2018). Capital
Budgeting Model and Sensitivity Analysis of the
Conventional Oil Production Sharing Contract (PSC)
Fiscal Systems: Empirical Evidence from Indonesia.
International Journal of Engineering & Technology, 7
(3.21): 5-9.
Daryanto, Wiwiek M., Nurfadilah D. (2018). Financial
Performance Analysis Before and After the Decline in
Oil Production: Case Study in Indonesia Oil and Gas
Industry. International Journal of Engineering &
Technology, 7 (3.21): 10-15.
Daryanto, Wiwiek M., Samidi S. (2018). Measuring the
Financial Performance of Enterprises Under Ministry
of Energy and Mineral Resources (EMR) an Indonesia
Experience. International Journal of Engineering &
Technology, 7 (3.21): 16-23.
Edmister, R.O. (1972). An empirical test of financial ratio
analysis for small business failure prediction. Journal
of Financial and Quantitative Analysis, 7(2), 1477-
1493.
Hempel, G., Simonson, D., and Coleman, A. (1994). Bank
Management: Text and Cases. 4th
Edition, John Wiley
& Sons, Inc.
Kementerian Badan Usaha Milik Negara. Salinan
Keputusan Menteri Badan Usaha Milik Negara
Nomor: KEP-100/MBU/2002. Retrivied on 30
November 2016 from http://www.bumn.go.id/
Khumaedy 2017, available at http://setkab.go.id/
penerbangan-menuju-destinasi-pariwisata
Kumbirai, M., Webb, R. (2010). A Financial Ratio
Analysis of Commercial Bank Performance in South
Africa. African Review of Economics and Finance 2
(1), pp 30-53.
Lan, Joe. (2012). 16 Financial Ratios for Analyzing a
Company’s Strengths and Weaknesses. Retrieved
from http://www.aaii.com/journal/article/16-financial-
ratios-for-analyzing-a-companys-strengths-and-
weaknesses.touch
McGuire, J. B., A. Sundgren, and T. Schneeweis (1988)
“Corporate social responsibility and firm financial
performance.” Academy of Management Journal, 31
(4): 854- 872.
Megaladevi, P. (2015). A study on financial performance
analysis of the selected paper company with special
reference to Tamil Nadu Newsprint and papers
limited. International Journal of Recent Research
Measuring Financial Performance of State-Owned Enterprises under Aviation in Indonesia: Case Study: PT. Angkasa Pura I and PT.
Angkasa Pura II
103
Aspects, 2(4), 22-24.
Pratama, Sasotya. (2017). Measuring Financial
Performance of PT. Pos Indonesia during The E-
Commerce Booming. IPMI International Journal of
Business Studies 1 (1), 29-37.
Sinkey, J. (2002). Commercial Bank Financial
Management: In the Financial-Services Industry 6th
Edition Prentice Hall, Upper Saddle River, NJ.
Vance, S. C. (1975) “Are socially responsible corporations
good investment risks?” Management Review, 64: 18-
24.
Waddock, S. A., and Samuel B. Graves (1997) “The
corporate social performance- financial performance
link.” Strategic Management Journal, 18 (4): 303-319.
Washington, H. Lee. (2001). Financial distress reporting:
Bringing a user focus to business reporting.
Weygandt, Jerry J.; Kimmel, Paul D.; and Kieso, Donald
E. (2015). Accounting Principles, 12
th
Edition. John
Wiley & Sons,Pte Ltd.
ProQuest Dissertations. Retrieved from
http://search.proquest.com/docview/304780186/previe
wPDF/A1EC841B&B764CF0PQ/ 1?accountid=31562
APPENDIX
Tabel 1: Test Results for PT. Angkasa Pura I.
Tabel 2: Test Results for PT. Angkasa Pura II.
Tabel 3: Summary of Test Results of PT. Angkasa Pura I.
Tabel 4: Summary of Test Results of PT. Angkasa Pura II.
ICEBM Untar 2018 - International Conference on Entrepreneurship and Business Management (ICEBM) Untar
104
