
Accrual-Based Accounting System Model Implementation in the State
Budget and Treasury System with Technology Acceptance Model 3
Approach at the Regional Office V in the Directorate General of
State Treasury of Jambi Province
Ratih Kusumastuti
1
, Derist Touriano
2
, Iskandar Sam
1
1
Department of Accounting, Business and Economic Faculty, Jambi University, Jambi, Indonesia
2
Faculty of computer science and engineering, Universitas Adiwangsa Jambi (UNAJA), Jambi, Indonesia
Keywords: Accrual-based Accounting, Information Quality, TAM 3, Perceived Usefulness, Behavioral Intention, Use
Behavior
Abstract: The application of accrual-based accounting in government organizations requires an IT-based accounting
system and complex information quality. However, the implementation of a new system or technology tends
to confuse the potential users, or its presence is rejected by them. With these problems, the purposes of the
research are to assess the user behavior on the implementation of Sistem Perbendaharaan dan Anggaran
Negara (SPAN) or the State Budget and Treasury System in the Directorate General of State Treasury,
Ministry of Finance of the Republic of Indonesia, to assess and to build the effectiveness of accrual-based
accounting system model that is run in SPAN using Technology Acceptance Model 3 (TAM 3), as well as
to build and to produce new model on TAM 3. The respondents’ answer data indicated that perceived
usefulness was either perceived of ease or difficult of using accrual information to decision making,
behavioral intention meant the desire of how people were willing hard to try doing that behavior which
became the critical issue of high frequency of behavior in using accrual-based financial report information
to decision making.
1 INTRODUCTION
One of the significant changes of Indonesia
governmental accounting is from cash-based
accounting to cash towards accrual accounting. This
change is a part of the development that wants to be
formed in the state finance sector reform as
mandated in the Law Number 17 Year 2003 and the
Presidential Instruction of the Republic of Indonesia
Number 3 Year 2003 dated June 9, 2003 in order to
realize the formation of e-government as part of the
financial sector reform (Simanjuntak, 2005).
In 2004 the Ministry of Finance implemented an
information system reform carried out under the
Government Financial Management and Revenue
Administration Project (GFMRAP). One of the
primary elements in the GFMRAP is Sistem
Perbendaharaan dan Anggaran Negara (SPAN) or
the State Budget and Treasury System project.
SPAN connects several echelon I in the Ministry of
Finance, five ministries or central institutions, the
House of Representatives, all the State Treasury
Service Offices, and other government institutions
that aim to improve efficiency, effectiveness,
accountability and transparency in the state budget
and treasury management through improving the
management of state finance by completing the state
financial management through the integration of
state financial management system, accrual-based
accounting application, the integration of state
financial management databases, and ease of access
for users (Ministry of Finance, 2011).
The main issue in implementing system
integration is user acceptance. According to Bailey
and Pearson (1983), Davis (1989), and Igbaria et al.
(1994), user acceptance is a determinant factor of the
acceptance or rejection of the use of computer
technology in organizations because an integrated
system brings significant improvements only related
to workloads and decreased employee ratios, but it
does not bring significant improvements
administratively (Poston and Grabski, 2001).
Kusumastuti, R., Touriano, D. and Sam, I.
Accrual-Based Accounting System Model Implementation in the State Budget and Treasury System with Technology Acceptance Model 3 Approach at the Regional Office V in the Directorate
General of State Treasury of Jambi Province.
DOI: 10.5220/0008440904230431
In Proceedings of the 4th Sriwijaya Economics, Accounting, and Business Conference (SEABC 2018), pages 423-431
ISBN: 978-989-758-387-2
Copyright
c
2019 by SCITEPRESS – Science and Technology Publications, Lda. All rights reserved
423

Information administration has an important role in
the sustainability of an organization. In other words,
organizations that have good information
governance means one step ahead of their
competitors (Laudon and Laudon, 2012) and can
accelerate right decision making (Bodnar and
Hopwood, 2004). Liu et al.’s (2007) study showed
there was no significant improvement in
performance during the first year of system
implementation until the third year, only in the
following year was there a slight increase. This
indicates that integrated system implementation is
very time consuming and ineffective. Besides that,
the striking impact of the application of the system is
the existence of social change and the overall
relationship of relational organization (Hasselbring,
2000).
The application of accrual-based accounting in
the government requires a more complex accounting
and IT-based system, but often the implementation
of the new system or technology tends to confuse the
users. This condition corresponds to the statement of
Compeau and Higgins (1995) that the critical stage
in the application of an information technology is a
condition where the presence of the system is
rejected by potential users. The obstruction of this
adaptation process occurs because of the tendency of
different perceptions regarding the benefits and ease
of the new system to operate. This is evident from
the tendency of some employees to be difficult to
adapt to new system. Difference in perceptions of
the benefits and convenience of new system can be
measured using Technology Acceptance Model
approach (Davis, 1989; Venkatesh and Bala, 2008).
The purpose of this research is to assess the
effectiveness of the model of accrual-based
accounting system being run in SPAN using TAM 3
which includes budgeting, budget document
management, management of commitment to
provision of goods and services, payment
management, state revenue management, report and
cash management which are repetitive. These need
to be assessed in terms of user behavior in order to
avoid failure of the overall system (Wirth et al.,
1996; Fatta, 2007; Berk, 2009) using TAM 3 which
is theoretically powerful in explaining the behavior
of the user acceptance of technology that is based on
beliefs, attitudes, intention, and user behavior
relationship (Venkatesh and Bala, 2008). In
addition, it is expected to be able to create a new
extension on the Output Quality variable in TAM 3
as a contribution in covering the shortcomings of
TAM.
This paper will be part of the conference
proceedings therefore we ask that authors follow the
guidelines explained in this example and in the file «
FormatContentsForAuthors .pdf» also on the zip
file, in order to achieve the highest quality possible
(Smith, 1998).
2 LITERATURE REVIEW
2.1 Theory of Planned Behavior (TPB)
In behavioral theories, there used to be well-
established theory to predict human behavior namely
Theory of Reasoned Action (TRA) (Fishbein and
Ajzen, 1975), which was later refined by Ajzen
(1991) to become Theory of Planned Behavior
(TPB). TRA was the first and fundamental theory of
human behavior and has been widely used in the
fields of marketing, information systems, etc
(Jogjyanto 2007). Sheppard et al. (1988) have traced
the use of TRA in various studies published in
scientific journals such as: journal of Consumer
Research, the Journal of Marketing, the Journal of
Marketing Research, Advances in Consumer
Research, the Journal of Personality and Social
Psychology, the Journal of Experimental Social
Psychology, the Journal of Social Psychology, the
Journal of Applied Social Psychology, and the
Journal of Applied Psychology. Sheppard et al.'s
(1988) search results showed that although TRA
originated from behavioral theory as a part of
psychology, the basic model is widely used by
research outside psychology.
TPB declares that behavior can be predicted by
behavioral intention (Ajzen 1991). The behavior
referred to in this research is the use of accrual-
based accounting information for decision making.
Intention in Ajzen (1991) is the desire to conduct
behavior. In this research, the intention in using
accrual accounting information means the intention
to use accrual accounting information for decision
making. Individual user of government financial
reports will have behavior of using accounting
information for decision making if he or she has an
intention or desire to do so.
2.2 Theory Acceptance Model (TAM)
Technology Acceptance Model (TAM) is a
psychological theory to explain behavior of
information users, which is based on beliefs,
attitudes, intention, and user behavior relationship.
TAM was first introduced by Davis (1989). The
SEABC 2018 - 4th Sriwijaya Economics, Accounting, and Business Conference
424
purpose of TAM is to explain the main factors of the
behavior of information technology users
themselves. Davis (1989) also pointed out that this
model would illustrate that the use of an information
system is influenced by variables of usefulness and
ease of use, both of which have high determinants
and validity that are tested empirically. TAM was
actually adopted from TRA which was first
developed by Fishbein and Ajzen in 1975, and the
theory of reasoned action has one premise that a
person's reaction and perception of something will
determine the person's attitude and behavior.
TAM has two sides. The first side or commonly
known as beliefs consists of perceived usefulness
and perceived ease of use and the second consists of
attitudes, behavioral intention to use and usage
behavior (Straub et al., 1995). TAM explains the
relationship between beliefs (usefulness and ease of
use) with attitudes, user goals/intentions, and real
use of the system. Perceived usefulness is defined
by Davis (1989) as a level where a person believes
that the use of the system specifically will improve
his or her performance. Then, perceived ease of use
is defined as a level where a person believes that the
use of the system specifically will lead to a business.
2.3 Theory Acceptance Model 2 (TAM
2)
Venkatesh and Davis (2000) created a new version
of TAM. This TAM 2 includes new factors and adds
them to the first version of TAM. These new factors
are added because technology users are increasingly
developing their scientific side. Venkantesh argued
that three social factors include subjective norms,
voluntariness, and images. In addition, Venkantesh
also mentioned four cognitive instruments that can
be used as factors affecting user acceptance on a
technology, namely job relevance, output quality,
result demonstrability, and perceived ease of use. If
the old version of TAM and the new one are
combined, TAM 2 model will be obtained.
2.4 Theory Acceptance Model 3 (TAM
3)
After the initial TAM and TAM 2, Venkatesh and
Bala (2008) formed TAM 3 by adding other
variables including adjustment and anchor groups
related to perceived ease of use. So far, there has
been less research using the concept of TAM 3 both
at home and abroad. Research conducted by Al-Qani
Tan (2012) examined students' perceptions and
attitudes in using computer laboratory learning
related to environmental factors. The results showed
that there was a significant relationship between
environment and attitude variables. Students who
enjoyed or were comfortable using computers and
participating in computer courses would more easily
accept computer usage, because they perceived that
computers provide benefits and will improve their
knowledge for the betterment.
Mangin et al. (2012) examined the effect of
external variables consisting of control, innovation,
enjoyment on internal TAM, namely perceived ease
of use and perceived usefulness, attitude toward
using and intention to use. The research was carried
out in the North American French Banking. The
results showed that the control variables had
significant influence on perceived ease of use,
attitude toward using, innovation, and intention to
use while enjoyment influenced perceived ease of
use, and attitude toward using influenced intention
to use. These results support the research and theory
proposed by Venkantesh and Bala (2008).
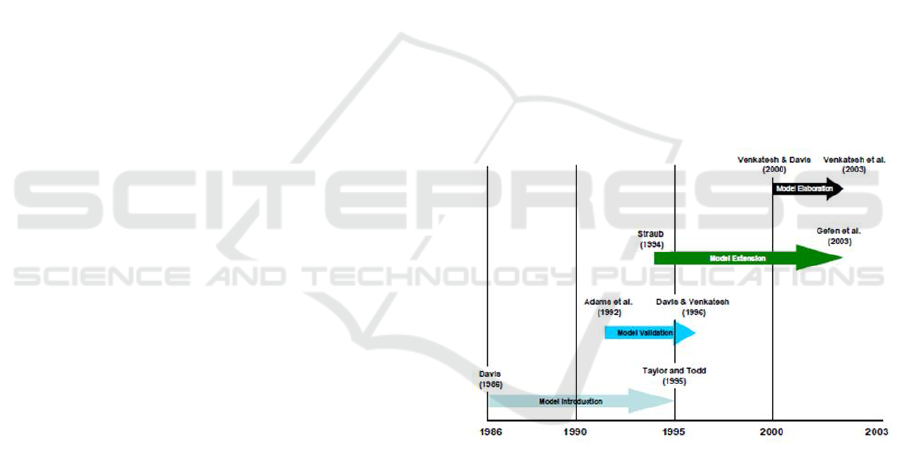
The development of TAMs from time to time
continues to experience development. The
chronology of the research progress on TAMs is
described in Figure 1.
Figure 1: Chronology of TAM Research (Lee, et al., 2003)
3 METHOD
This research used a descriptive quantitative method
by giving facts with the proper interpretation in
solving problem. It attempted to parse the research
problems including relationship among activities,
attitudes, views, and processes that took place as
well as the influences from the implementation of
accrual-based accounting system in SPAN at the
State Treasury Service Regional Office V,
Directorate General of State Treasury of Jambi
Province, under the Indonesia’s Ministry of Finance.
Accrual-Based Accounting System Model Implementation in the State Budget and Treasury System with Technology Acceptance Model 3
Approach at the Regional Office V in the Directorate General of State Treasury of Jambi Province
425
The population of this research were all users
involved in the SPAN accrual-based accounting
system at the Regional Office V in the Directorate
General of State Treasury, Jambi Province, and other
5 State Treasury Service Offices in each district. The
Sampling in this study was carried out through
convenience sampling method. This method was
chosen because the SPAN user population were still
unpredictable. The sample in this study amounted to
156 respondents Besides, the data processing also
included data quality test and statistical description.
Table 1: Research Variables
Variables
Definitions
Measurement
Perceived
Usefulness
Perceived ease of
difficult of doing
behavior, namely
using
accrual accounting
information to
decision making
.
Variable of Perceived
Behavior Control
To Use Accrual
Accounting
Information
Measured with statements
developed by Demir
(2010).
Each item is measured
with Likerts that show 1
as "strongly disagree" until
7 "strongly agree"
Behavioral
Intention
Intention is assumed
as how people are
willing to try hard to
do certain behavior
Variable of Intention
To Use Accrual
Accounting Information
Measured with statements
developed by Demir
(2010).
Each item is measured
with Likerts that show 1
as "strongly disagree" until
7 "strongly agree"
Use
Behavior
Frequency of using
accrual-based
financial accounting
report information
to decision making
Variable of Use Behavior
of accrual accounting
information to
decision making
Measured with statements
developed by Sousa, et al.
(2003).
Each item is measured
with Likerts that show 1
as "strongly disagree" until
7 "strongly agree"
4 RESULTS AND DISCUSSION
4.1 Research Reliability and Validity
Test
In part of this test, we explain how to check the
reliability and validity of the data from the return of
the research questionnaire.
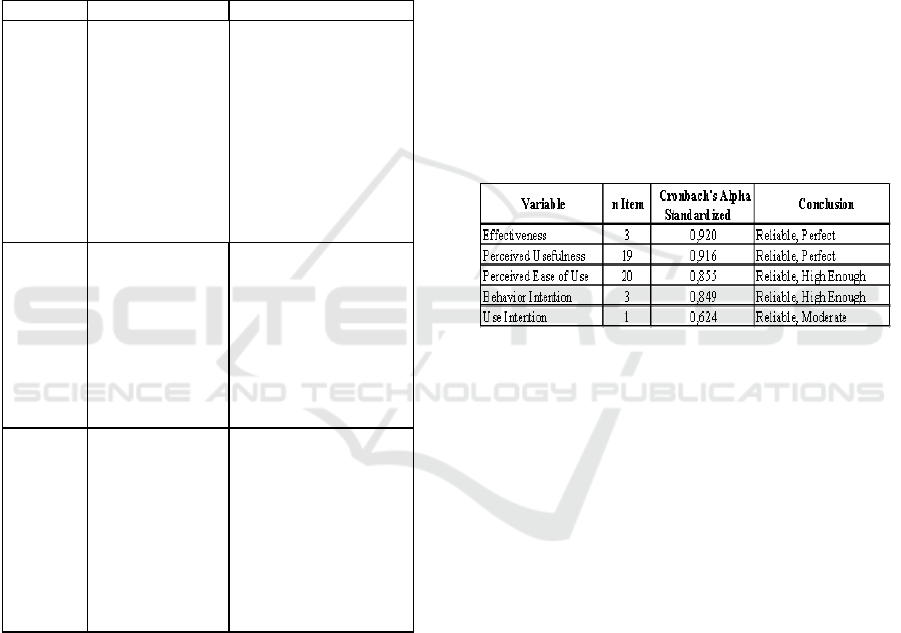
4.1.1 Reliability Test
Reliability test in this study is used to measure the
consistency of answers to a question from time to
time (Ghozali, 2013) or indicate the extent to which
the indicator can be trusted or reliable. The
measurement used in this study is the Cronbach
Alpha statistical test, which according to Ghozali
(2013) a construct is said to be reliable if the
Cronbach Alpha value is greater than 70% (> 0.7),
whereas Raisch (2012) interprets as follows:
If alpha > 0.90 then reliability is perfect
If alpha is between 0.70 - 0.90 then the
reliability is quite high
If alpha is between 0.50 - 0.70 then reliability
is moderate
If alpha < 0.50 then reliability is low.
The reliability test results for each variable can be
seen in the table below.
Table 2: Research Reliability Test
From the table above can be seen that the
average value of standardized Cronbach Alpha of all
the variables in this study were above 80%. This
shows that the respondents in this study answered
the questions in the questionnaire consistently with
quite high reliability.
4.1.2 Validity Test
Validity test is used to measure the ability of a
questionnaire to reveal the validity of the questions
(Ghozali, 2013). The method of measuring validity
in this study is to do a bivariate correlation between
each indicator score with the total score of the
construct. If the correlation between each indicator
to the total construct score shows significant results,
it can be concluded that each question indicator is
valid.
The table below shows that the correlation
between each indicator to the total construct score of
each variable indicates significant results.
SEABC 2018 - 4th Sriwijaya Economics, Accounting, and Business Conference
426
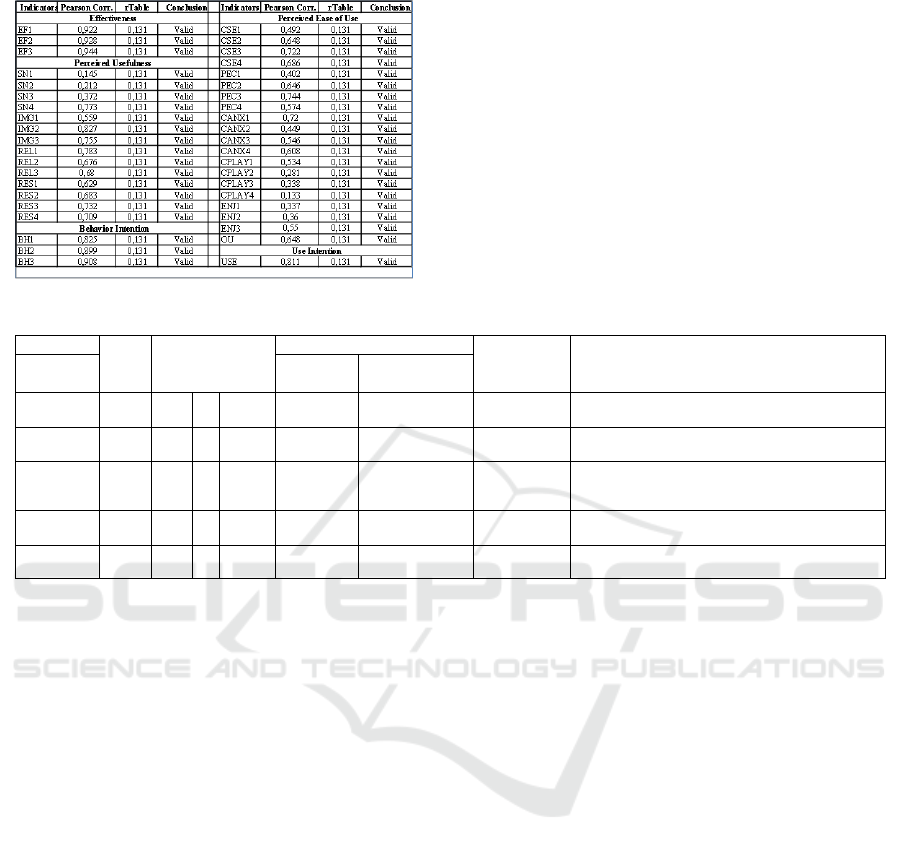
Table 3: Research Validity Test
4.2 Descriptive Statistics
Below is presented data in descriptive statistical
techniques that give a description of each variable's
data which includes Mean (M), Median (Me), Mode
(Mo), standard deviation (SD) and frequency
distribution table, frequency distribution histogram
and tendency of tendency value to centralize data
(central tendency) or the tendency of respondents'
answers to the questions submitted in the
questionnaire based on Gupta, Cazzanti, &
Srivastava (2005).
Table 4: Research Statistics Description
Variable
n
Ite
m
Actual Range
Actual Average
Standard
Deviation
()
Description
Variable
Theoritical
Indicators
Effectiven
ess
3
5
-
21
14.87
4.96
4.24
Approaching the actual average theoretical
indicator
Perceived
Usefulness
19
45
-
133
94.48
18.90
17.20
Approaching the actual average theoretical
indikator
Perceived
Ease of
Use
20
51
-
140
96.40
18.90
15.54
Approaching the actual average theoretical
indikator
Behavior
Intention
3
5
-
21
14.75
4.92
3.76
Approaching the actual average theoretical
indikator
Use
Intention
1
1
-
7
4.69
4.69
1.56
Avoiding the actual average theoretical indicator
The effectiveness variable is measured by 3
question items/indicators that show the acceptance
of employee respondents in the environment of
Regional Office V of the Directorate General of
State Treasury of Jambi Province following 5 State
Treasury Service Offices in each district against the
accrual-based accounting system in SPAN. The
measurement scale using a Likert scale 1-7 points
produces the actual range for the effectiveness
variable between 5-21, while the variable theoretical
average is 4.96 with a standard deviation (σ) of 4.24
so that it can be concluded that σ tends to approach
the actual theoretical indicator average.
Perceived usefulness variables are measured by
19 questions/indicators for accrual-based accounting
systems in SPAN. The scale of measurement using
the Likert scale 1-7 points produces the actual range
for the perceived usefulness variable between 45 -
133, while the theoretical mean variable is 18.90
with a standard deviation (σ) of 17.20 so it can be
concluded that σ tends to approach the actual
theoretical mean of the indicator. While the
variables of perceived ease of use are measured by
20 questions/indicators for accrual-based accounting
systems in SPAN. The scale of measurement using
the Likert scale 1-7 points produces the actual range
for the variable of perceived ease of use between 51
- 140, while the theoretical mean variable is 18.90
with a standard deviation (σ) of 15.40 so it can be
concluded that σ tends to approach the actual mean
theoretical indicator.
The behavior intention variable is measured by 3
items of questions/indicators of the accrual-based
accounting system in SPAN. The scale of
measurement using a Likert scale 1-7 points
produces the actual range for the behavior intention
variable between 1-7, while the theoretical mean
variable is 4.92 with a standard deviation (σ) of 3.76
so that it can be concluded that σ tends to approach
the actual theoretical mean of the indicator. While
the use behavior variable is measured by 1 item
question/indicator towards the accrual-based
accounting system in SPAN. The measurement scale
using a Likert scale 1-7 points produces the actual
range for the use behavior variable between 5-21,
while the variable theoretical mean is 4.69 with a
standard deviation (σ) of 1.56 so that it can be
concluded that σ tends to avoid the actual theoretical
indicators.
Accrual-Based Accounting System Model Implementation in the State Budget and Treasury System with Technology Acceptance Model 3
Approach at the Regional Office V in the Directorate General of State Treasury of Jambi Province
427
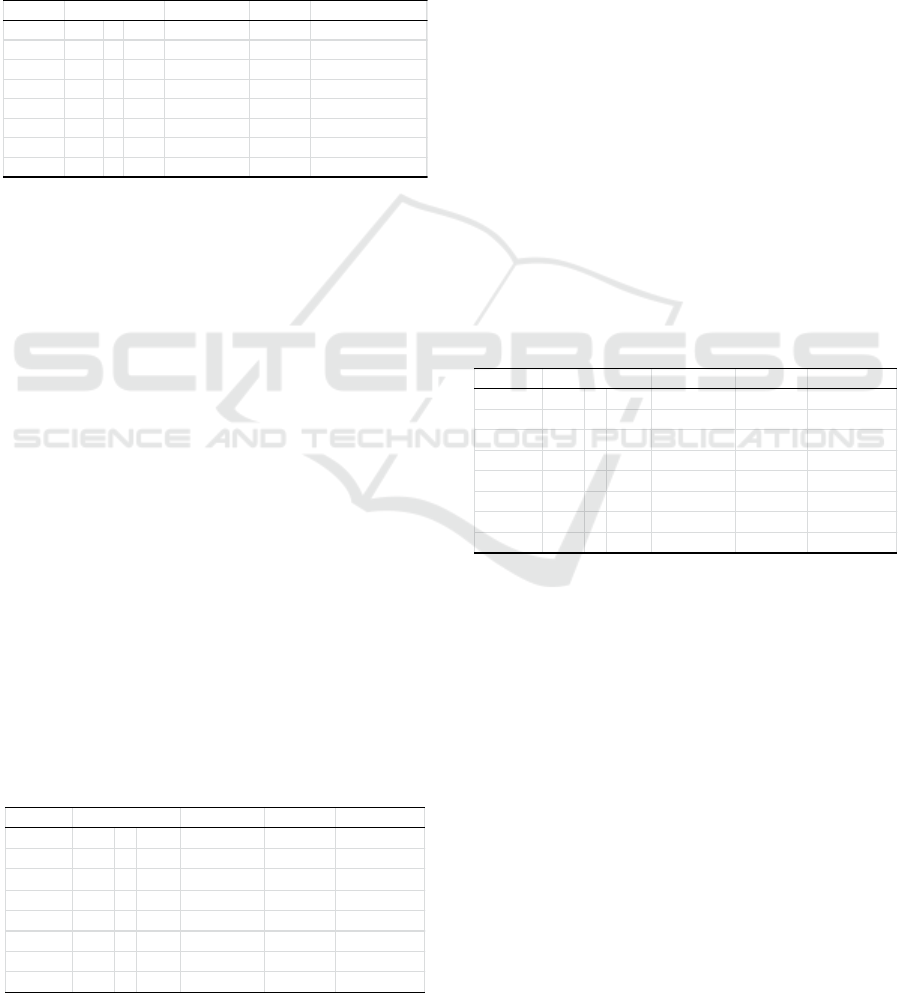
4.3 Distribution Data
Effectiveness Distribution Data
The following is a statistical description of the
effectiveness of the accrual-based accounting system
in SPAN. On the results of collecting questionnaires
obtained 156 questionnaires that were declared valid
and complete. So that the frequency distribution is
presented as follows:
Table 5: Frequency Effectiveness Distribution
Class Median
f Relative %
1 5 - 7 8,5 6 3,8
2 8 - 9 12,5 8 5,1
3 10 - 11 15,5 29 18,6
4 12 - 13 18,5 19 12,2
5 14 - 15 21,5 21 13,5
6 16 - 17 24,5 21 13,5
7 18 - 19 27,5 25 16,0
8 20 - 21 30,5 27 17,3
Interval
Based on the data above, the highest frequency is
in the interval class number 3 which has a range of
10-11 with a total of 29 respondents. The tendency
of high and low values in the statistical distribution
of the effectiveness of accrual-based accounting
systems in SPAN is determined by the ideal criteria
value. Determination of ideal criteria in this study
uses the ideal mean (Mi) and ideal standard
deviation (Sdi).
From the statistical aids it is known that the
mean value of the accrual-based accounting system
in SPAN is 14.87 or included in category of the
interval IV (14.3 ≤ 14.87 < 16.9) so it can be
concluded that the frequency distribution of accrual-
based accounting systems in SPAN in Jambi
Province is in the category of Good.
a. Distribution Data of Perceived Usefulness
The following is a description of the perceived
usefulness of accrual-based accounting systems in
SPAN. On the results of collecting questionnaires
obtained 156 questionnaires that were declared valid
and complete. So that the frequency distribution is
presented as follows:
Table 6: Distribution of Frequency of Perceived
Usefulness
Class Median
f Relative %
1 45 - 56 73 2 1,3
2 57 - 67 90,5 4 3,8
3
68 - 78 107 23 15,0
4 79 - 89 123,5 33 21,0
5 90 - 100 140 33 21,0
6 101 - 111 156,5 35 22,0
7 112 - 122 173 19 12,0
8 123 - 133 189,5 7 4,0
Interval
Based on the data above, the highest frequency is
found in the interval class number 6 which has a
range of 101 - 111 with a total of 35 respondents.
The tendency of high and low values in the
statistical distribution of the perceived usefulness of
the accrual-based accounting system in SPAN is
determined by the ideal criteria value. Determination
of ideal criteria in this study uses the ideal mean
(Mi) and ideal standard deviation (Sdi)
From the statistical aids it is known that the mean
value of perceived usefulness of the accrual-based
accounting system in SPAN is equal to 94.48 or
included in category of the interval III (81.65 ≤
94.48 <96.36) so it can be concluded that the
perceived usefulness frequency distribution of the
accounting system Accrual based in SPAN in Jambi
Province is in the Medium category.
b. Data Distribution for Perceived Ease of Use
The following is a statistical description of the
perceived ease of use of accrual-based accounting
systems in SPAN. On the results of collecting
questionnaires obtained 156 questionnaires that were
declared valid and complete.
So the frequency distribution is presented as follows:
Table 7: Frequency Distribution of Perceived Ease of Use
Class Median
f Relative %
1 51 - 62 82 2 1,0
2 63 - 73 99,5 6 4,0
3 74 - 84 116 22 14,0
4 85 - 95 132,5 49 31,0
5 96 - 106 149 44 28,0
6 107 - 117 165,5 19 12,0
7 118 - 128 182 8 5,0
8 129 - 139 198,5 6 4,0
Interval
Based on the data above, the highest frequency is
in the interval class number 4 which has a range of
85-95 with a total of 49 respondents. The tendency
of high and low values in the statistical distribution
perceived ease of use accrual-based accounting
system in SPAN is determined by the ideal criteria
value. Determination of ideal criteria in this study
uses the ideal mean (Mi) and ideal standard
deviation (Sdi) with the formula:
From the statistical aids it is known that the
mean value of perceived ease of use accrual-based
accounting system in SPAN is equal to 96.40 or
included in category of the interval III (81.65 ≤
96.40 < 102.9) so that it can be concluded that the
frequency distribution perceived ease of use accrual-
based accounting system in SPAN in Jambi Province
has Medium category.
SEABC 2018 - 4th Sriwijaya Economics, Accounting, and Business Conference
428
c. Data Distribution of Behavior Intention
The following is a statistical description of the
behavior of the accrual-based accounting system in
SPAN. On the results of collecting questionnaires
obtained 156 questionnaires that were declared valid
and complete. So the frequency distribution is
presented as follows:
Table 8: Frequency Distribution of Behavior Intention
Class Median
f Relative %
1 5 - 7 8,5 3 1,9
2 8 - 9 12,5 11 7,0
3 10 - 11 15,5 18 11,5
4 12 - 13 18,5 31 19,9
5 14 - 15 21,5 24 15,4
6 16 - 17 24,5 25 16,1
7 18 - 19 27,5 26 16,7
8 20 - 21 30,5 18 11,5
Interval
Based on the data above, the highest frequency is
found in the interval class number 4 which has a
range of 12-13 with a total of 31 respondents. The
tendency of high and low values in the statistical
distribution of the behavior intention of the accrual-
based accounting system in SPAN is determined by
the ideal criteria value. Determination of ideal
criteria in this study uses the ideal mean (Mi) and
ideal standard deviation (Sdi).
From statistical aids it is known that the mean
value of the behavior intention of accrual-based
accounting systems in SPAN is equal to 14.75 or
included in category of the interval IV (14.3 ≤ 14.75
<16.9) so it can be concluded that the frequency
distribution of accounting system intention Accrual-
based in SPAN in Jambi Province is categorized
Good.
d. Data Distribution of Use Behavior
The following is presented the statistics
descriotion for use behavior of the accrual-based
accounting system in SPAN. On the results of
collecting questionnaires obtained 156
questionnaires that were declared valid and
complete. So the frequency distribution is presented
as follows:
Table 9: Frequency Distribution of Use Behavior
Class Median
f Relative %
1 1 - 1,75 1,875 1 0,6
2 1,76 - 2,5 3,01 1 0,6
3 2,51 - 3,25 4,135 11 7,1
4 3,26 - 4 5,26 27 17,3
5 4,01 - 4,75 6,385 30 19,2
6 4,76 - 5,5 7,51 32 20,5
7 5,51 - 6,25 8,635 31 19,9
8 6,26 - 7 9,76 23 14,7
Interval
Based on the data above, the highest frequency is
in the interval number 6 class which has a range of
4.76 - 5.5 with a total of 30 respondents. The
tendency of high and low values in the statistical
distribution of use behavior of accrual-based
accounting systems in SPAN is determined by the
ideal criteria value. Determination of ideal criteria in
this study uses the ideal mean (Mi) and ideal
standard deviation (Sdi).
From statistical aids it is known that the value of
mean use behavior of accrual-based accounting
systems in SPAN is equal to 4.69 or included in the
interval IV category (4.5 ≤ 4.69 <5.5) so that it can
be concluded that the frequency distribution using
accounting system behavior Accrual-based in SPAN
in Jambi Province is categorized Good.
Individual beliefs on an object will influence
their attitudes to an object or behavior. Individual
attitudes are expressed in positive or negative
feelings, fine or bad, fun or no fun and helpful or
unhelpful, and in doing certain behavior based on
beliefs. Individual attitudes will then play a role in
determining intention to do certain behavior. Besides
affected by attitudes, intention to behave something
is also influenced by environment encouragement or
subjective norms and perceived behavior control or
individual perceived ease or difficult of doing
certain behavior.
The higher the individual intention, the more
possibility of actual behavior occurs. As a matter of
fact, there are numerous empirical research proves
the long way of intention to become behavior. This
present research attempts to add variable that can
clarify relationship between intention and behavior.
Actual behavior in using accrual-based accounting
to decision making is also possible to be determined
by resources owned by users of accounting
information for doing the behavior. The information
accounting users that have believed on accrual-based
accounting information usability and have been
encouraged by important people might also fail
using accrual-based accounting information to
Accrual-Based Accounting System Model Implementation in the State Budget and Treasury System with Technology Acceptance Model 3
Approach at the Regional Office V in the Directorate General of State Treasury of Jambi Province
429

decision making if the users have limitation of
resource for doing that behavior.
Resource limitations for doing the behavior can
be explained by Theory of Planned Behavior (Ajzen,
1991). This teory states that perceived behavior
control influences behavior directly and undirectly
through behavioral intention. Perceived behavior
control is a resource and opportunity that individual
has that determine the maximum limit possibility of
behavior he or she can do. Perceived behavior
control refers to perceived ease or difficult of doing
certain behavior.
In the context of using accrual information for
decision making, perceived behavior control is the
extent of resource and opportunity had by the users
of the state financial report information, which
determines the possibility of achievement behavior
in using accrual accounting information for decision
making.
5 CONCLUSIONS
Success of accrual-based accounting implementation
in the government organization is not only when the
government succeeds presenting accrual-based
financial reports, but also when accrual-based
accounting information is used to decision making.
Predicting behavior of the users of accounting
information in using accrual-based accounting
information to decision making can be explained by
Theory of Planned Behavior (Ajzen, 1991).
The theory points out that behavior can be
predicted through individual intention to do certain
behavior. Intention is individual desire for doing
actions (Ajzen, 1991). Intention and behavior have
significant difference. While intention is not yet in
the form of behavior, behavior is real actions or
activities done. In other words, behavioral intention
to use accrual-based accounting information to
decision making is how much strong the desire of
financial report users in using accrual-based
accounting information that serves as a basis of
decision making.
The respondent answer data indicated that
perceived usefulness, perceived ease or difficult of
using accrual-based information to decision making,
behavioral intention that showed how people were
willing hard to try doing that behavior were the
cause of the critical issue of high frequency of
behavior of using accrual-based financial reports to
decision making.
REFERENCES
Ajzen, I. (1991). "The Theory Of Planned Behavior."
Organizational Behavior And Human Decision
Processes 50: 179-211.
Al-Qahtani, M. F. (2012). Students’ perception and
attitude towards computer. Educational Research,
3(4), 402-411.
Bailey, J., & Pearson, S. (1983). Development of a tool for
measurement and analyzing computer user
satisfaction. Management Science, 29(5), 530-575.
Berk, J. (2009). System Failure Analysis. Ohio: ASM
International.
Bodnar, G. H., & Hopwood, W. S. (2004). Accounting
Information Systems. Prentice Hall.
Compeau, D. R., & Higgins, C. A. (1995). Computer Self-
Efficacy: Development of a Measure and Initial Test.
MIS Quarterly, 19(2), 189-211.
Davis, F. D. (1989). Perceived Usefulness, Perceived Ease
of Use, and User Acceptance of Information
Technology. MIS Quarterly, 13(3), 319-340.
Demir, K. (2010). "Predictors Of Internet Use For The
Professional Development Of Teachers: An
Application Of The Theory Of Planned Behaviour."
Teacher Development 14(1): 1-14.
Depkeu. (2011, Februari). Dipetik April 06, 2016, dari
www.span.depkeu.go.id:
http://www.span.depkeu.go.id/tentang-span
Fatta, H. A. (2007). Analisis dan Perancangan Sistem
Informasi untuk Keunggulan Bersaing Perusahaan
dan Organisasi Modern. Yogyakarta: Andi.
Fishbein, M., & Ajzen, I. (1975). Belief, Attitude,
Intention, and Behavior: An Introduction to Theory
and Research. Reading, MA: Addison-Wesley.
Ghozali, I. (2016). Buku Aplikasi Analisis Multivariate
IBM SPSS 23 (8th ed.). Semarang: UNDIP PRESS.
Gupta, M. R. (2006). A Measure Theory Tutorial
(Measure Theory for Dummies). UWEE Technical
Report. Retrieved from http://www.ee.washington.edu
Hasselbring, W. (2000). Information system integration.
Communications of the ACM, 43(6), 32-38.
Igbaria, M., Schiffman, S. J., & Wieckowski, T. J. (1994).
"The respective roles of perceived usefulness and
perceived fun in the acceptance of microcomputer
technology. Behaviour & Information Technology
13.6, 13(6), 349-361.
Laudon, K. C., & Laudon, J. P. (2012). Management
Information System: Managing The Digital Farm (12
ed.). Prentice Hall.
Liu, L., Miao, R., & Li, C. (2007). The Impacts of
Enterprise Resource Planning Systems on Firm
Performance: An Empirical Analysis of Chinese
Chemical Firms. Dalam Research and Practical Issues of
Enterprise Information Systems II: IFIP TC 8 WG 8.9
International Conference on Research and Practical
Issues of Enterprise Information Systems (CONFENIS
2007) (hal. 579-587). Beijing, China: Springer US.
Poston, R., & Grabski, S. (2001). Financial impacts of
enterprise resource planning implementations.
SEABC 2018 - 4th Sriwijaya Economics, Accounting, and Business Conference
430

International Journal of Accounting Information
Systems, 271-294.
Mangin, J.-P. L., Bourgault, N., León, J. A., & Guerrero,
M. M. (2012). Testing Control, Innovation and Enjoy
as External Variables to the Technology Acceptance
Model in a North American French Banking
Environment. International Business Research, 5(2),
13-26.
Sheppard, B., et al. (1988). "The Theory of Reasoned
Action : A Metaanalsis of Past Research with
Recommendation for Modifications and Future
Research." Journal of Consumer Research 15(3): 325-
343.
Simanjuntak, B. (2005). Menyongsong Era Baru
Akuntansi Pemerintahan di Indonesia. Jurnal
Akuntansi Pemerintah, 1(1).
Sousa, R. G. d., et al. (2013). "Accrual Basis Accounting
in the Brazilian Public Sector: Empirical Research on
the Usefulness of Accounting Information." Cont. Fin.
- USP 24(63): 219-230.
Straub, D. W., Limayen, M., & Karahanna-Evaristo, E.
(1995). Measuring System Usage Implication for is
Theory Testing. Management Science, 41(8), 1328-
1342.
Venkatesh, V., & Bala, H. (2008). Technology
Acceptance Model 3 and a Research Agenda on
Interventions. Decision Sciences, 39(2), 273-315.
Venkatesh, V., & Davis, F. D. (2000). A theoretical
extension of the technology acceptance model: Four
longitudinal field studies. Management Science, 46(2),
186-204.
Wirth, R., Berthold, B., Krämer, A., & Peter, G. (1996).
Knowledge-based support of system analysis for the
analysis of Failure modes and effects. Engineering
Applications of Artificial Intelligence, 9(3), 219-229.
Accrual-Based Accounting System Model Implementation in the State Budget and Treasury System with Technology Acceptance Model 3
Approach at the Regional Office V in the Directorate General of State Treasury of Jambi Province
431
