
Manpower Absorption in Fishcake, Crackers and Fish Cracker
Businesses in Palembang City
Septi Dwi Sari and Bambang Bemby Soebyakto
Faculty of Economics, Universitas Sriwijaya, Palembang, Indonesia
Keywords: Labor Demand, wage rate, production value, gender and business location.
Abstract: The purpose of the research entitled “Manpower Absorption in fishcake, crackers and fish cracker
Enterprises in Palembang City” was to find out how the variables of capital, wages, production value, sex
and business location influence labor absorption in the business sector of fishcake, crackers and fish cracker
in the City Palembang. This study uses primary data through direct interviews with respondents with a list
of questions that have been prepared. There were 60 respondents of the small-scale food industry
entrepreneurs in the city of Palembang who became the object of research. To achieve the goal, in this study
using data analysis was done using multiple linear analysis using OLS (Ordinary Least Square) and SPSS
20. software program. The results showed that the variables of capital (X1), wages (X2), production values
(X3), gender (X4) and business location (X5) jointly influence the labor absorption variable (Y). From the
partial estimation results, the variables that have a significant influence are only the variables of capital,
production value and business location. This means that the wage and sex variables have no real effect on
labor absorption in the fishcake, crackers and fish cracker business in Palembang City.
1 INTRODUCTION
During the economic crisis, small and
medium enterprises (SMEs) have become a safety
valve for the national economy. As in other
countries, SMEs not only have a very significant
contribution to the economy of a nation but SMEs
also play a very large role in employment. In terms
of the formation of Gross Domestic Product (GDP),
the contribution of SMEs to GDP reached 63.11
percent. While large businesses constitute 0.01
percent of all business units contributing 36.89
percent of GDP (Setiawan, 2010).
As for the population that has increased from
year to year has resulted in a growing number of
workforce. This means that the increasing number of
people who are looking for work or unemployed. To
be able to compensate for the growth rate of the
working age population, it is necessary to expand
employment. Based on BPS data from Palembang
City, the population based on the 2015 projection is
1,580,517 people, consisting of 791,943 male and
788,574 female residents. Compared to the projected
population in 2014, the population in Palembang
City experienced a growth of 1.41 percent. The
employment situation in Palembang City in 2015
had a total workforce of 733,121 people.
Meanwhile, the unemployment rate of
Palembang City in 2015 was 9.52 percent, greater
than in 2013, which was 9.15%. This unemployment
rate is calculated by defining unemployment as
looking for a job, preparing a business, feeling
impossible to get a job and getting a permanent job
but not working yet. The data shows that the
unemployment rate in Palembang City is still in a
category that is quite alarming. Unemployment can
be overcome by placing unemployed people on
employment. To employ the unemployed, new jobs
must be created. But the more days the number of
unemployed continues to increase faster than the
increase in the number of jobs. Even so, we still
have to remain optimistic that a high labor force
problem can be found a solution. One of the things
that might be used as a solution for reducing
unemployment and expanding employment
opportunities is by developing the SME sector
(Sudrajad, 2000).
Small and Medium Enterprises (SMEs) absorb
more labor than the formal sector. Because the
formal sector requires a special skill that is not
owned by most job seekers. In addition, Small and
Medium Enterprises in increasing employment can
Dwi Sari, S. and Soebyakto, B.
Manpower Absorption in Fishcake, Crackers and Fish Cracker Businesses in Palembang City.
DOI: 10.5220/0008438802250241
In Proceedings of the 4th Sriwijaya Economics, Accounting, and Business Conference (SEABC 2018), pages 225-241
ISBN: 978-989-758-387-2
Copyright
c
2019 by SCITEPRESS – Science and Technology Publications, Lda. All rights reserved
225

be calculated from how much the business unit
owned by the entrepreneur / industry, the value of
production or the total number of goods produced,
the level of wages offered and capital in the sector in
the UKM. At present the food industry in Palembang
City is growing rapidly. Compared to other
industries, the food industry, especially Palembang
specialties such as pempek, kerupuk and kempelang,
has a huge opportunity to continue to grow.
When viewed from the internal factors of
Pempek businessmen, crackers, and kempelang in
Palembang City such as capital and wages
associated with employment, these variables will
influence each other. The greater the capital owned
will increase with the amount of production
capacity. From the amount of production capacity, a
lot of labor is absorbed to meet a large production
capacity. While wages are one of the production
costs that must be issued by the company. The
absorption of labor will be influenced by the
proportion of wages for workers against the overall
cost of production. So if the proportion of
production costs for small wages, then the response
to labor demand will be large.
The value of production can also affect
employment in pempek entrepreneurs, crackers and
kempelang in Palembang City. The value of
production is the level of production or the total
amount of goods produced in the food industry. The
rise and fall of demand for the production of these
industrial SMEs, will affect if the demand for the
production of the company's goods increases, so that
producers tend to increase their production capacity.
For this purpose producers will increase the use of
their workforce (Sumarsono, 2012). Based on the
phenomena, and the thoughts of the results of
previous studies, this study analyzed the
employment of the small-medium business sector of
the food industry in the city of Palembang.
2 LITERATURE REVIEW
Labor Demand Theory
Demand for labor or other production factors
used to produce an item / service is determined or
controlled by the demand for finished goods /
services (derived demand). The demand for labor
depends on the productivity of the workforce itself
and the market value of the products produced (Mc
Connell, Brue, and Macpherson, 1999). As is well
known, that the labor market is different from most
other markets. Because labor demand is a derivative
request. Most labor services, when compared to
finished goods that are ready to be enjoyed by
consumers, are inputs for producing other goods.
The derived demand theory in this study is
closely related to the amount of labor absorption
needed. While the employer hires someone because
the person helps produce goods and services to sell
to the consumer community. In other words,
increasing company demand for labor depends on
increasing public demand for goods and services
produced. Such labor demand is called derived
demand (Payaman J. Simanjuntak, 1985).
Employers employ someone because they help
produce goods / services for sale to consumers.
Therefore, an increase in the demand of employers
for labor depends on the increase in public demand
for goods produced. Penyerapan tenaga
kerja merupakan jumlah tertentu dari tenaga kerja
yang digunakan dalam suatu unit usaha tertentu atau
dengan kata lain penyerapan tenaga kerja adalah
jumlah tenaga kerja yang bekerja dalam suatu unit
usaha.
Manpower absorption can be attributed to the
balance of interaction between labor demand and job
suppy, where the market demand for labor and the
market for labor supply together will determina the
balance of wage levels and the balance of labor use.
The market for labor demand is a combination of
individual market demand for labor. Demand for
labor depends on the elasticity of demand for the
number of workers. The sensitivity of the amount of
labor demand is calculated in the following ways
(Mc Connell, Brue, and Macpherson, 1999):
SEABC 2018 - 4th Sriwijaya Economics, Accounting, and Business Conference
226

Determinants of determinants of market
elasticity in general labor demand are determined
by:
a. Product demand capacity. The more elastic the
demand for the product of a company, the more
elastic the company will make the demand for labor.
b. Comparison between labor costs and total
costs. The greater the composition of labor costs in
the total cost, the change in the wage rate will be
more elastic to the demand for labor. Conversely, if
the composition of the workforce is very small in the
total cost, the change in wage rate is less elastic.
c. The easier it is to substitute labor into other
input factors, the more demand for labor will change
to the wage rate.
Other elasticity of supply of production factors. If
the demand for other production factors is more
elastic, the demand for labor is also more elastic.
Capital
Working capital is all funds spent in the
production process to obtain sales receipts (Ahmad,
2004). Usually working capital is used for labor
costs, workers' rights, to produce goods and costs in
other needs (Pratama, 2005). Working capital has
two functions, namely supporting production
activities and closing funds or fixed expenses that
are not directly related to production and sales
(Raheman and Nars, 2007). The greater the capital
used will affect the amount of production produced,
the greater the level of use of the process needed for
production.
Wage Theory
The labor market, like other markets in the
economy, is controlled by the forces of supply and
demand, but the labor market differs from most
other markets because labor demand is a derived
demand where the demand for labor depends on the
demand for output. produced it (Borjas, 2010). The
imbalance between demand and supply of labor will
determine the level of wages (Mankiw, 2003).
According to Ricardo (Deliarnov, 2009) the
exchange rate of an item is determined by the costs
incurred to produce the goods, namely the cost of
raw materials and wages of workers whose amount
is only for subsistence for the workers concerned.
Nominal Wage
W
B
W
A
MVP
L
= D
L
O
L
B
L
A
the number of worker
Selection of the level of output that maximizes
profit also reflects the selection of inputs that
produce the level of output in question. This means
that the demand for input cannot be separated from
the choice of output level (Binger and Hoffman,
1988: 301). Demand for labor is derived demand.
Demand for labor depends on demand for output. A
decrease in demand for output will reduce demand
for labor, and vice versa. Factors that determine
labor demand are marginal products of labor and
output prices (McConnell et al., 2003: 127).
The addition of a worker will increase output as
much as the marginal product of labor (Marginal
Product of Labor = MPL). In the perfect competition
market, with the product price level as high as PQ,
then the value of the marginal product of labor
(Marginal Value Product of Labor = MVPL) is the
output price multiplied by the marginal product
(MVPL = PQ x MPL). On the other hand, the
addition of a worker burdens the company costs by
the workers' nominal wage level. If the marginal
product value of labor (MVPL) is higher than the
nominal wage rate, then the company will increase
the number of workers, and vice versa. Companies
that maximize profits, will employ a number of
workers until a situation is attained which is marked
by the similarity between the nominal wage level
Manpower Absorption in Fishcake, Crackers and Fish Cracker Businesses in Palembang City
227

and the marginal product value of labor (Branson,
1989: 110).
The value curve of the marginal product of the
MVPL workforce illustrates labor demand
(Bosworth et al., 1996: 98). The increase in the
number of workers is followed by a decrease in the
marginal product value of workers so that nominal
wages also decline. Thus the labor demand curve
also has a negative slope. A nominal wage increase
will reduce the amount of labor requested, and vice
versa. At nominal wage levels as high as OWA, the
amount of labor requested is as large as OLA. If the
nominal wage rises to as high as OWB, the number
of workers is asked to go down to OLB.
Production Theory
According to Mankiw (2005) the factor of
production is the input used to produce goods and
services. The two most important factors of
production are capital and labor.
In a production process to produce goods and
services, labor is one of the factors of production
used in the production process. By examining the
relationship between the production of goods and the
demand for labor, there will be known factors that
determine the balance of wages. The following
production functions are stated in the equation:
Y = F (K, L)
This equation states that output is a function of a
number of capital and labor. The production
function reflects the technology used to convert
capital and labor into output. The discovery of better
ways to produce goods, produces more output, with
the amount of capital and labor is fixed.
Gender
Gender is closely related to small businesses that
relate to people's economic activities with equitable
development for women and men, in terms of social
justice, economic efficiency and efforts to encourage
regional development. This goal can be achieved
through a strategy that is tailored to the conditions,
needs and potential.
As quoted in the book Wade and Tavris (2007)
different cultures and religions differ in the roles of
men and women. For example, equal education for
men and women is not seen as important, although
there are laws that require minimal education for all
people. in a world that is growing rapidly, the
message of society towards men and women
continues to shift. As a result, gender development
becomes a lifelong process, where gender schemes,
attitudes and behaviors change with new experiences
and changes in society. Their behavior is formed by
a combination of hormonal factors, genes, cognitive
schemes, education from parents and social
environment, religious and cultural traditions, and
experience.
Business Location
According to Heizer and Render (2005) the
location is a driver of costs and income, the location
often has the power to create a business strategy for
the company. Strategic locations aim to maximize
profits for the company. According to (Kotler, 2008)
one of the keys to success is location, the location
begins with choosing a community. This decision is
very dependent on the potential for economic growth
and stability, competition, political climate and so
on.
Before a company sets up a factory, it is usually
planned as best as possible because the location
affects the operating / production costs, selling
prices, and the company's ability to compete in the
market (Subagyo, 2000). From the views of the
theories that have been stated previously and from
previous studies, the systematic framework of
thought in this study can be described as follows:
Picture 1: The relationship between the variables of capital, wages, production value, sex and location of
business to employment in the business of Pempek, Kerupuk and Kempelang in Palembang City.
Capital (X
1
)
Wage (X
2
)
Manpower Absorption in Pempek,
Kerupuk and Kempelang businesses in
Palembang City
value of production
(X
3
)
Gender (X
4
)
Business Location
(X
5
)
SEABC 2018 - 4th Sriwijaya Economics, Accounting, and Business Conference
228

3 RESEARCH METHODS
In this study the scope of the research which is
the object of research is the SME sector of the food
industry such as pempek, crackers and kempelang
found in Palembang City. The reason for choosing
the object of the study, because for the SME sector
the food industry such as pempek, crackers and
kempelang is quite a lot in the city of Palembang so
it is very interesting to do research on the influence
of capital, wages, production value, gender and
business location on employment in the SME sector
food industry in Palembang City.
The type of research conducted using a
quantitative descriptive approach using statistical
analysis used multiple regression. The research
variables used in this study consisted of dependent
variables (bound), namely the variable number of
workers and independent variables (free) consisting
of variables of capital, wages, production value, sex
and business location.
The data needed in this study consists of primary
data. Primary data relating to the data collected to
meet the needs of research conducted was obtained
by direct interviews and filling out questionnaires by
entrepreneurs of Pempek, crackers and kempelang in
Palembang City.
4 RESULTS AND DISCUSSION
Questionnaires were distributed to 60 SMEs in
the food industry such as Pempek, Kerupuk and
Kempelang producing data on the characteristics of
Pempek, Kerupuk and Kempelang entrepreneurs.
Next presented the characteristics of respondents
regarding the amount of labor, capital, wages,
production value, gender and business location
Characteristics of Respondents
Table 4: Total Absorption of Manpower for Pempek, Kerupuk and Kempelang Enterprises Palembang city
No
Labor (people)
Owner
(respondent)
Percentage
(%)
1.
3-4
5
8,3
2.
5-6
6
26, 7
3.
7-8
18
30
4.
9-10
11
18,4
5.
> 10
10
16,6
Total
60
100%
Table 5 : Monthly Capital Tables issued by Pempek, Kerupuk and Kempelang Enterprises Palembang city
No
Capital/month
(Milion Rp)
Owner (respondent)
Percentage
(%)
1.
12,5 - 15,0
13
21,6
2.
15,5 - 18,0
8
13,3
3.
18,5 - 21,0
4
6,7
4.
21,5 - 24,0
1
1,7
5.
> 24,5
34
56,7
Total
60
100%
Manpower Absorption in Fishcake, Crackers and Fish Cracker Businesses in Palembang City
229

Table 6: Monthly Wages Per Work Force of Pempek, Kerupuk and Kempelang Palembang city
No
Wage/month
(Thousand Rp)
Owner
(respondent)
Percentage
(%)
1.
750 - 755
2
3,3
2.
756 - 855
8
13,3
3.
856 - 955
19
31,7
4.
956 - 1.055
15
25
5.
> 1.056
16
26,7
Total
60
100%
Table 7: Production Value of Pempek, Kerupuk and Kempelang Enterprises Palembang city
No
value of production / month
(Thousand unit)
Owner (respondent)
Percentage
(%)
1.
40 - 45
16
26,7
2.
66 - 85
18
30
3.
86 - 105
11
18,3
4.
106 - 135
2
3,3
5.
136 - 255
13
21,7
Total
60
100%
Table 8: Gender Respondents of Pempek, Kerupuk and Kempelang Businesses Palembang city
No
Gender
Owner
(respondent)
Percentage (%)
1.
Man
47
78,8
2.
Female
13
21,67
Total
60
100%
Table 9: Business Location in Pempek, Kerupuk and Kempelang Enterprises Palembang city
No
Business Location
Owner
(respondent)
Percentage (%)
1.
Industrial Centers
41
68,33
2.
Not Industrial Centers
19
31,67
Total
60
100%
Variable Research Distribution
Labor Distribution (Y)
In this study, data on the number of labor
absorption in the Pempek, Crackers and
Kempelang business in Palembang City in 2017
are as follows:
SEABC 2018 - 4th Sriwijaya Economics, Accounting, and Business Conference
230

Table 10: Number of Manpower Absorption
No
Labor (people)
Owner
(respondent)
Percentage
(%)
1.
<8
38
63,3
2.
>8
22
36,7
Total
60
100%
Based on table 10 it can be seen that the average
respondent who has a workforce of <8 people is 38
respondents, amounting to 63.3%. For respondents>
8 only 22 respondents, amounting to 36.7%. From
the table above it can be seen that in the business of
Pempek, crackers and kempelang in Palembang City
in 2017 for the number of workers influential in
employment. On average, the entrepreneurs of
Pempek, Kerupuk and Kempelang have <10 workers
who come from neighbors around the area and there
is also a relationship between the workforce and the
business owner is a family.
Capital Distribution (X1)
The capital in the pempek, crackers and crushing
business in Palembang City uses the majority of
capital derived from their own capital. The
following is the distribution of capital in the
Pempek, Crackers and Kempelang business in
Palembang City in 2017.
Table 11 : Capital Table per month in Pempek, Kerupuk and Kempelang Enterprises in the City Palembang, 2017
No
Capital/month
(Million Rp)
Owner
(respondent)
Percentage
(%)
1.
>24jt
27
45,0
2.
<24jt
33
55,0
Total
60
100%
Based on the table above shows that business
capital issued> 24 million per month amounted to 27
respondents, amounting to 45.0%. For capital
issued> 24 million per month, there were 33
respondents, amounting to 55.0%. It is seen here that
in this business capital becomes an influence for
employers to recruit workers.
In this study the meaning of capital is the amount
of capital used for the production process in food
businesses (pempek, kerupuk / kempelang) per
month. This capital does not include the value of
land and buildings. In the Pempek business, crackers
and kempelang in Palembang City use equipment
and equipment that are not sophisticated tools such
as large industries, but the equipment and equipment
used are still simple.
So that the equipment here is not substitute. The
capital in this study is working capital. Meanwhile,
working capital is a financing for business or
business. In this study the working capital calculated
is capital from food production raw materials in the
form of (pempek, kerupuk / kempelang) for each
production within a month. Other raw materials and
equipment used in the food industry are as follows.
First, raw materials, such as sago / flour, milled fish,
flavorings, eggs, and water. Both equipment, namely
fish grinder, basin container, and stirrer.
Wage Distribution (X2)
In this study on the pempek, crackers and
kempelang business in the city of Palembang, the
wages of workers were paid with monthly wages.
The wage table is as follows:
Table 12: Monthly Wages Per Labor in Pempek, Kerupuk and Kempelang Enterprises in Palembang City, 2017.
N
o
Wage/month
(Million Rp)
Owner
(respondent)
Percentage
(%)
1.
<978
32
53,3
2.
>978
28
46,7
Total
60
100%
Manpower Absorption in Fishcake, Crackers and Fish Cracker Businesses in Palembang City
231

Based on the above table shows that the average
respondent has a workforce wage <978 totaling 32
respondents, amounting to 53.3% and for
respondents with labor wages of> 978 as many as 28
respondents. it means that the big wage does not
affect the amount of labor absorption in the business
of Pempek, crackers and kempelang in Palembang
City in 2017.
This is because the community does not respond
too much to the size of the wages offered by
employers to become workers in the pempek,
kerupuk and kempelang businesses. Entrepreneurs in
this industry are also rather difficult to find skilled or
skilled employees. So that when entrepreneurs raise
wages aim to absorb labor.
Production Value Distribution (X3)
The production value referred to in this study is
the amount of production (pempek / kerupuk /
kempelang) in one month. The following is the
production value data for the Pempek, Crackers and
Kempelang business in Palembang City in 2017:
Table 13 : Production Value of the Business of Pempek, Kerupuk and Kemplang per Month
No
Produstion Value / month
(Thousand unit)
Owner (respondent)
Percentage
(%)
1.
<1290
47
78,3
2.
>1290
13
21,7
Total
60
100%
Based on the table above shows that the
production value of <1290 in this business is 47
respondents, with a percentage of 78.3%. For the
production value of <1290, there were 13
respondents, 21.7%. The average production value
produced per month <1290 which affects labor
absorption by keeping the variable value of wages
constant, hence the increasing production capacity,
the value of production increases, increasing the
amount of labor absorption.
Gender Distribution of Respondents (X4)
In this study, gender was the sex of the business
owner of Pempek, crackers, and Kempelang in
Palembang City, which was taken from interviews
with 60 respondents.
Table 14: Gender of Respondents
No
Gender
Owner (respondent)
Percentage (%)
1.
Man
47
78,3
2.
Woman
13
21,7
Total
60
100%
Based on the table above it can be seen that the
sex of male respondents dominates the respondents,
namely 47 respondents, amounting to 78.3% while
the number of female respondents is as many as 13
respondents with a percentage of 21.7% only. This is
because in our society, men are intended as
breadwinners or become the backbone of their
families.
Distribution of Business Locations (X5)
In this study the business location is a place of
business or business activity carried out on the
business of pempek, crackers and kempelang in
Palembang City. Divided into 2 locations, namely
strategic locations that are in the food industry area
and non-strategic locations that are not in the food
industry area.
Table 15: Business Locations in Pempek, Kerupuk and Kempelang Enterprises in Palembang City
No
Business Location
Owner
(respondent)
Percentage (%)
1.
Strategy
41
68,3
2.
No Strategy
19
31,7
Total
60
100%
SEABC 2018 - 4th Sriwijaya Economics, Accounting, and Business Conference
232

In the table above shows that the number of
pempek, crackers and crisps businesses in
Palembang City in 2017 which are in strategic areas
are 41 respondents, amounting to 68.3%. While
those who are not in the strategic 19 respondents
with a percentage of 31.7%. Most of the average
entrepreneurs in industrial centers are 41
entrepreneurs.
This is because researchers have determined the
location of the study. In accordance with the
Government's decree that the food industry center is
in the Seberang Ulu 1 area to Seberang Ulu 10.
However, the data in the field shows that the most
pempek, cracker and kempelang businesses are
located in the Palembang specialty food industry
located across the ilir ( 24 ilir to 28 ilir).
Crosstab
Crosstab descriptive statistics (cross
tabulation) are included in the description analysis.
However, there are differences compared to
descriptive frequency statistics and exploration.
Descriptive crosstab presents data in tabulation
form, which includes rows and columns. Crosstab
features are generally two or more variables that
have a descriptive relationship. Data presentation in
general is qualitative data.
Relationship Between Variables in Pempek,
Kerupuk and Kempelang Enterprises
Characteristics of respondents (Pempek
entrepreneurs, crackers and kempelang in
Palembang City in 2017) according to capital
variables with labor variables can be seen in the
table below:
Table 16: Relationship between capital variables and labor variables:
Labor Group
Total
<8
>8
Capital Group
> 24jt
21
6
27
< 24jt
17
16
33
Total
51
25
60
From the table above shows that there are 21
respondents who have capital> 24 million and
absorb labor <8 people, there are 17 respondents
have capital <24 million and absorb labor <8 people,
6 respondents who have capital >24 million absorb
labor >8 people and lastly there were 16 respondents
having capital <24 million absorbing labor> 8
people. This means that for the variable capital
affects the amount of labor absorption in the
business of pempek, crackers and kempelang in
Palembang City.
The Relationship Between Wage Variables and
Labor Variables
The relationship of respondents according to
wages and labor absorption in the business of
Pempek, crackers and kempelang in Palembang City
in 2017 can be seen from the table below.
Table 17: Relationship between wage variables and labor variables:
Labor Group
Total
<8
>8
Wage Group
<978
23
9
32
>978
15
13
28
Total
38
22
60
From the table above shows 23 respondents who
gave wages <978 thousand per month were able to
absorb labor <8 people, there were 15 respondents
who gave wages> 978 thousand per month able to
absorb labor <8 people. There were 9 respondents
who gave a wage of <978 thousand per month able
to absorb labor> 8 people and also there were 13
respondents who gave a salary> 978 thousand per
month able to absorb labor> 8 people.
From these data it can be said that the wages
offered by pempek businessmen, crackers and
kempelang in Palembang City were not responded to
by the workforce. Entrepreneurs in this business are
rather difficult to find workers who have skilled
employees.
Manpower Absorption in Fishcake, Crackers and Fish Cracker Businesses in Palembang City
233

The Relationship Between Production Value
Variables and Labor Variables
The relationship between the variable value of
production and labor absorption in the business of
pempek, crackers and kempelang in Palembang City
in 2017 can be seen from table 4.10 below
Table 18: Relationship between variables of production values and labor variables:
Labor Group
Total
<8
>8
Production Group
<1290(unit)
34
13
47
>1290(unit)
4
9
13
Total
38
22
60
Judging from the data above it can be said that
there are 34 respondents with production value per
month <1290 units absorb <8 people. And there are
4 respondents with production value produced per
month> 1290 units absorbing <8 people. there are 13
respondents with production value per month <1290
units absorbing> 8 people, and there are also 9
respondents with monthly production value> 1290
units absorbing> 8 people. In this case it can be said
that the production value of <1290 units produced
by less than 8 people was 34 respondents compared
to the production value> 1290 units produced by
more than 8 people.
Relationship Between Gender Variables and
Labor Variables
Characteristics of respondents according to
gender and labor absorption in the Pempek, crackers
and crisps business in Palembang City in 2017 can
be seen from table 19.
Table 19: Relationship between Respondents by sex and labor
Labor Group
Total
< 8
> 8
Gender Group
Man
29
18
47
Woman
9
4
13
Total
38
22
60
From the table above it can be seen that there are
29 respondents who are male who absorb <8 people,
there are 9 respondents who are female who absorb
<8 people. Then there were 18 respondents who
were male who absorbed labor <8 people, and there
were 4 respondents who were female by absorbing
labor> 8 people. In the table above shows that male
entrepreneurs absorb more labor than female
entrepreneurs, but for researchers this can also be
indirectly caused by gender factors to influence
decisions and actions to take labor in the business of
Pempek , crackers and kempelang.
The Relationship Between Business Location
Variables and Labor Variables
Characteristics of respondents according to the
location of the business and labor absorption in the
business of Pempek, crackers and kempelang in
Palembang City in 2017 can be seen from table.
Table 20: Relations of Respondents Based on location of business and labor
Labor Group
Total
< 8
> 8
Location of Business
Strategic
31
10
41
Not Strategic
7
12
19
Total
38
22
60
SEABC 2018 - 4th Sriwijaya Economics, Accounting, and Business Conference
234
From the table above it can be seen that there are
31 respondents who are strategically located that
absorb <8 people, there are 7 respondents who are
not strategically located that absorb <8 people. Then
there were 10 respondents who were strategically
located which absorbed employment> 8 people, and
there were 12 respondents located not strategically
by absorbing labor> 8 people. This shows that
strategic business locations are able to absorb more
labor than business locations that are not in a
strategic location (Palembang's food industry
center).
Data Analysis with Statistics
Overall description and the results of this study
will be described after the data analysis and
interpretation has been carried out. The analysis was
carried out using Statistical Package For Social
Communication (SPSS) For Windows ver. 20. The
results of statistical calculations are presented in a
descriptive form to describe the description of the
data by using inferential analysis to determine the
relationship of influence between research variables.
Classic assumption test
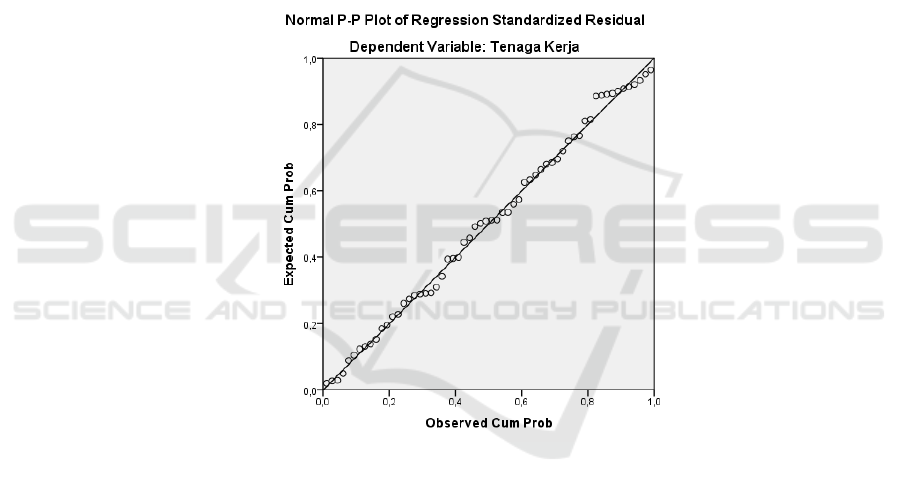
Normality test
If the data spread around the diagonal line and
follow the direction of the diagonal line, the
regression model meets the assumption of normality.
If not, or the data spreads far from the diagonal line,
the regression model does not meet the assumption
of normality. The results of the normality test can be
seen from the Normal P-P plot below.
Figure 1: The Results of Normality Test
From the picture above, you can see the points
spreading around the diagonal line and the
distribution follows the direction of the diagonal
line. Then the regression model is feasible to be used
for predicting employment variables based on input
from variables of capital, wages, production value,
sex and business location.
Multicollinearity Test
Multicollinearity testing aims to test
whether the regression model found correlation
between independent variables. A good regression
model should not have a correlation between
independent variables.
To detect the presence of multicolinerity, it can
be seen with the amount of VIF (Variance Inflation
Factor) and Tolerance values. Looking at the
tolerance value, if the value is> 0.10, it means that
there is no multicollinearity against the data being
tested, whereas if the value is <0.10, it means that
there is multicollinearity. The multico free
regression equation is: has a VIF value around the
number 1 and has a tolerance number close to 1. For
the results of multicollinearity testing, it can be seen
from the following table:
Manpower Absorption in Fishcake, Crackers and Fish Cracker Businesses in Palembang City
235

Tabel 21: Multicollinearity Test Results
Model
Collinearity Statistic
Tolerance
VIF
Constant
Capital
Wage
Production
Gender
Business Location
,599
,842
,709
,837
,797
1,669
1,188
1,410
1,194
1,255
In table 4.8 shows the tolerance value for the five
variables close to 1 and VIF for the five independent
variables around 1, there is no problem of
multicolinerity.
Autocorrelation Test
Autocorrelation test in a model aims to find out
how big the content is or to find out whether or not
there is a correlation between disturbing variables
(et) in a certain period with the magnitude of the
disturbing variables in the previous period (et-1).
One way to detect autocorrelation symptoms is by
using the Durbin-Watson method. The results of the
autocorrelation test in this study can be seen in the
following table
Table 22 Autocorrelation Testing Results
Model
R
R Square
Adjusted R
Square
Std. Error of
The Estimate
Durbin-
Watson
1
,750
a
,562
,521
2,597
1,506
a. Predictors: (Constant), X1, X2, X3, X4, X5
b. Dependent Variable: Y (tenaga kerja)
Test criteria: compare the value of 1.506 with the value of d from the Durbin-Watson table:
a. If it's 1.506 <dL, or 1.506> 4 - dL, the conclusion is that there is autocorrelation.
b. If dU is <1.506 <4 - dU, the conclusion is that there is no autocorrelation.
c. There is no conclusion if: dL ≤ 1,506 U dU or 4- dU ≤ 1,506 ≤ 4- dL
Heteroscedasticity Test
To see whether there is a problem
heteroscedasticity can be detected by the presence or
absence of a particular pattern on the scater plot
graph, if there are certain patterns, such as dots that
form a regular pattern (wavy, widened and then
narrowed) then heteroscedasticity has occurred.
Whereas if there is no clear pattern, and the points
spread above and below 0 and Y, there is no
heteroscedasticity. The results of heteroscedasticity
testing can be seen in Figure 2.
Figure 2: Heteroskedastisitas
SEABC 2018 - 4th Sriwijaya Economics, Accounting, and Business Conference
236

In the picture above, there is a regular pattern, in
this study the pattern forms and spreads from -1 to 1.
This means that heteroscedasticity does not occur.
Multiple Linear Regression Analysis
Multiple linear regression analysis is a linear
relationship between independent variables (capital,
wages, production value, gender and business
location) and dependent (labor absorption variable).
This analysis is to determine the direction of the
relationship between the variables of capital, wages,
production value, gender and business location with
labor absorption variables whether each of them has
a positive or negative fan to predict the value of the
labor absorption variable if the variable capital,
wages, production value , sex and business location
have increased or decreased.Koefisien Determinasi (
R
)
From the results of the calculation of
multiple linear regression analysis that has been
done the correlation value between the variables of
labor absorption with the coefficient of
determination (R) can be seen in table 23 presented
below:
Table 23: Model Summary
Model
R
R
Square
Adj R
Square
Std.
Error of
the
Estimate
Change Statistics
Durbin
-Watson
R
Square
Change
F
Change
df1
df2
Sig.
F Change
1
,750
a
,562
,521
2,597
,562
13,850
5
54
,000
1,506
a. Predictors: (Constant), X1, X2, X3, X4, X5
b. Dependent Variable: Y (labor)
From the table above shows that the R Square
value of 0.562 means that the variable capital,
wages, production value, gender, and business
location can explain the employment absorption
variable of 56.2%, the remaining 43.8% is explained
by other factors.
Uji Signifikan Simultan (uji F)
The F statistical test shows all the
independent variables included in the jointly owned
model of the dependent variable or not. Tests are
carried out on the F test with a 100% confidence
level. The results of the research hypothesis testing
using test F can be presented in the table below
Table 24: Annova / Simultan Test / F-test
Model
Sum of
Square
df
Mean Square
F
Sig
1 Regression
Residual Total
467,096
364,238
831,333
5
54
59
93, 419
6, 745
13, 850
,000
b
a. Predictors: (Constant), X1, X2, X3, X4, X5
b. Dependent Variable: Y (tenaga kerja)
From table 24 anova (F test) by using df = 5
obtained F in the table of 2.25. While the calculated
F is obtained at 13.850, the significant value of F is
below 0.05, so from the above calculation, it can be
seen that Ho is rejected and Ha is accepted, meaning
that the overall variables of capital, wages,
production value, sex and business location have a
significant influence on absorption variables. labor.
In other words the proposed hypothesis is accepted.
Partial Test (t test)
The t test is carried out to examine how much
influence the factor of wage level and production
value partially on the demand for labor in the
Beverage Food Industry UKM in Palembang City.
This is done by comparing the tcount and ttable
values. Hypothesis statement that will be tested is if
t count abel t table then Ha is accepted and Ho is
rejected. As for how to find table = number of
samples - number of independent variables - 1
(number 1 is a constant) = 60 - 5 - 1 = 54, using the
formula with the program excel = tinv (0.05, 54)
obtained is 1.672 so that table = 1.672. The results of
hypothesis testing using the t test:
Manpower Absorption in Fishcake, Crackers and Fish Cracker Businesses in Palembang City
237

Table 25: t-test Results
Model
t
Sig
Constant
1,267
,211
Capital
3,660
,001
Wage
,805
,424
Production
2,060
,044
Gender
-1,511
,137
Business Location
-3,575
,001
From the table above, the regression equation
that is formed is as follows:
Y = 3,711 + 0,1779X1 + 0,2522 X2 + 0,6516X3 -
1,344X4 -2,887X5
Where :
Y: Manpower Absorption (the number of workers
who work)
X1: Capital (Rp. A month)
X2: Wages (Rp. A month)
X3: Production Value (total units of goods produced
in a month)
X4: Gender (female, male)
X5: Business location (business center, not business
center)
From the results in the coefficient table seen in
the sig column, shows that:
1. Capital coefficient value is 0.001 which means
it is smaller than 0.05 (0.001> 0.05) and has a
coefficient of 0.1779 and positive, the
hypothesis criteria shows tcount 3.660 <1.672
so that Ha is accepted & Ho is rejected which
means variable capital has a significant and
positive effect on employment in the Pempek,
Kerupuk and Kempelang businesses in
Palembang City.
2. The wage coefficient value is 0.424 which
means it is greater than 0.05 (0.424> 0.05), and
has a coefficient of 0.2522 and is positive, the
hypothesis criteria shows t count 0.805 <t table
1.672 so Ha is rejected which means the wage
variable does not significantly influence labor
absorption in Pempek, Kerupuk and
Kempelang Enterprises in Palembang City.
3. Production coefficient value of 0.044 which
means it is smaller than 0.05 (0.044> 0.05), and
has a coefficient of 0.6516 and positive sign,
the criterion of hypothesis t counts 2.060> t
table 1.672, which means that the variable
value of production is influential significantly
and positively towards employment in the
Pempek, Kerupuk and Kempelang Enterprises
in Palembang City.
4. The value of the sex coefficient is 0.137 which
means it is greater than 0.05 (0.137> 0.05), and
has a coefficient value of (-1,344) and negative
sign, the hypothesis criteria shows t count (-
1,511) <t table 1,672 so Ha rejected which
means that the gender variable has no
significant and negative effect on employment
in the Pempek, Kerupuk and Kempelang
Enterprises in Palembang City.
5. The business location coefficient value is 0.001
<0.05, the hypothesis hypothesis is -3.575> t
table 1.672, which means that the business
location variable has a significant and negative
effect on employment in the Pempek, Kerupuk
and Kempelang businesses in Palembang City.
Discussion
From the results of the above study it can be
seen that the independent variables namely capital,
wages, production value, sex and business location
can explain the dependent variable (employment in
the Pempek, Kerupuk and Kempelang Enterprises in
Palembang City) by 56.2% while the rest is
explained by another factor of 43.8%.
Judging from the results of the F test (together)
shows the effect of capital, wages, production value,
sex and business location significantly influence
labor absorption with a significant value of F below
0.05, and the calculated F is obtained at 5.351 using
df = 5 obtained F table of 2.25. While the calculated
F is obtained at 5.351 so that the f count is 5.351>
ftabel 2.25. So Ho is rejected and Ha is accepted, so
that it can be said that there is an influence of
independent variables (capital, wages, production
value, sex and business location) on the dependent
SEABC 2018 - 4th Sriwijaya Economics, Accounting, and Business Conference
238

variable (employment in Pempek, Kerupuk and
Kempelang Enterprises in Palembang City).
When viewed from the results of the t test
(partial) it is known that the capital variable
significantly affects labor absorption, the variable
value of production significantly affects labor
absorption, while the wage variable shows no real
influence on labor absorption, and gender variables
and business location variables also did not show
any influence on employment in the Pempek,
Kerupuk and Kempelang businesses in Palembang
City.
Influence of Capital on Manpower Absorption
From the estimation results of the regression
model it can be seen that the probability of variable
capital is 0.001 which means it is smaller than 0.05
(0.001> 0.05) and has a coefficient value of 0.1779
and is positive. Which means that the variable
capital has a significant positive effect on
employment in the Pempek, Kerupuk and
Kempelang businesses in Palembang City. So if
capital increases by 1%, the absorption of labor will
increase. In assuming wages and production values
remain constant. When the wage variable, the
production value remains constant, the greater the
capital for each production. This capital is used to
buy raw materials, equipment and equipment. So the
capital in this study is not substitutionary, so that
with the addition of equipment does not replace the
role of labor.
In this study, capital has a significant effect on
employment. This is if the entrepreneur's capital is to
increase production, the food entrepreneur (Pempek,
Kerupuk / Kempelang) will increase the number of
his workforce, but they tend to utilize the available
workforce for maximum output.
Effect of Wages on Labor Demand
Work demand theory, one of which was put
forward by Sumarsono (2003), states that labor
demand is a function of the level of wages, where
the higher the level of wages, the demand for
employers for labor will be smaller. Likewise, if the
wage rate is low, it will be followed by an increase
in employment opportunities.
The wage variable is 0.424 which means it is
greater than 0.05 (0.424> 0.05), and has a coefficient
of 0.2522 and a positive sign, the hypothesis criteria
shows tcount 0.805 <t table 1.672 so that Ha is not
accepted which means that the wage variable has no
effect significantly to employment. Wages are not
important in absorbing workers in the Pempek,
Kerupuk and Kempelang businesses in the city of
Palembang.
This can be seen from the field data where the
wages for some Pempek, Kerupuk and Kempelang
Enterprises in Palembang City are quite high but are
not followed by high labor demand. In addition, this
is because the public does not respond too much to
the size of the wages offered by employers to
become employees in this industry. Entrepreneurs in
this industry are also rather difficult to find skilled or
skilled employees. So that when entrepreneurs raise
wages aim to absorb labor.
Effect of Production Value on Labor Absorption
In the regression model, it is known that the
significant value of the production value variable is
0.044 which means it is smaller than 0.05 (0.044>
0.05), and has a coefficient value of 0.6516 and is
positive. So if the production value increases 1%,
the demand for labor will increase in the assumption
that wages are considered constant.
By keeping the variable value of wages constant,
the increasing production capacity also increases the
value of production so that it will increase the
amount of labor absorption. This is similar to Putra's
(2012) study entitled "The Influence of Investment
Value, Wage Value and Production Value on
Manpower Absorption in the Furniture Industry in
Pedurungan District, Semarang City". The results of
Putra's research stated that the variable value of
production factors had a positive and significant
effect on employment in the furniture industry. So
the increase in production value will cause
additional or absorbed labor in the furniture
industry.
Gender Differences on Labor Absorption
In the regression model, it is known that the
value of the sex variable is 0.137, which means that
it is greater than 0.05 (0.137> 0.05), and has a
coefficient value of -1.343 and is negative. In this
study, gender was the identity of the business owner
in Pempek, Kerupuk and Kempelang Enterprises in
Palembang City, which was taken from interviews
with 60 respondents. Based on interviews, there
were 47 food business owners (pempek, kerupuk /
kempelang) male sex. While female business owners
are only 13 people. And from the research results it
is known that the sex of the business owner has an
indirect influence on employment in the Pempek,
Kerupuk and Kempelang businesses in Palembang
City.
Manpower Absorption in Fishcake, Crackers and Fish Cracker Businesses in Palembang City
239

Differences in Business Locations against
Manpower Absorption
In the regression model, it is known that the
value of the business location variable is 0.001
<0.05, the hypothesis hypothesis is -3.575) <t table
1.672, which means that the business location
variable is significantly different but negative for
employment. In this study the business location
which is a place of business or business activity is
divided into 2 locations. That is, the location is
strategically located in the area of Palembang's
typical food industry and the location that is not
strategic, namely the location that is not in the
industrial area of Palembang's typical food. From the
results of the study showed that in the business of
Pempek, crackers, and kempelang in the city of
Palembang, which is strategically located in the
industrial area of Palembang's typical food, there
were 41 entrepreneurs, while the non-strategic ones
were only 19 entrepreneurs. And this also shows that
the business location does not have an influence on
employment.
5 CONCLUSION AND
SUGGESTION
Conclusion
Based on the results of the research that has been
done, it can be concluded that jointly or
simultaneously the variables of capital, wages,
production value, sex and business location have a
significant effect on employment in the Pempek,
Kerupuk and Kempelang businesses in Palembang
City.
In this study, the capital variable has a significant
effect on employment. This is if the entrepreneur's
capital is to increase production, the food
entrepreneur (Pempek, Kerupuk / Kempelang) will
increase the number of his workforce, but they tend
to utilize the available workforce for maximum
output.
Wage variables have no significant effect on
employment in the Pempek, Kerupuk and
Kempelang businesses in Palembang City. This is
because the public does not respond too much to the
size of the wages offered by employers to become
employees of this industry. Entrepreneurs in this
industry are also rather difficult to find skilled or
skilled employees. So that when entrepreneurs raise
wages aim to absorb labor.
Variable production values have a positive and
significant effect on employment in the Pempek,
Kerupuk and Kempelang businesses in Palembang
City. By keeping the variable value of wages
constant, the increasing production capacity also
increases the value of production so that it will
increase the amount of labor absorption.
Gender variables do not directly affect
significantly and are negative for employment.
Based on interviews with 60 respondents, there were
47 food business owners (pempek, kerupuk /
kempelang) male sex. While female business owners
are only 13 people. And from the results of the study
it is known that the sex of the business owner does
not have any influence on employment in the food
industry.
The business location variables have a significant
and negative effect on employment, the results of the
study indicate that the Pempek, Kerupuk and
Kempelang businesses in Palembang are
strategically located in the industrial area of 41
entrepreneurs, while the non-strategic location is not
in the center Palembang's typical food industry is
only 19 entrepreneurs. And this also shows that the
business location does not have an influence on
employment.
Suggestion
From the results of the discussions and research
that has been carried out, a number of suggestions
are proposed:
1. To increase employment can be done by
increasing business capital and production or also
can develop existing businesses, this is very helpful
in the demand for labor in this case employment.
2. The government or related parties should increase
socialization or market the Palembang food
industry as the economy is quite big and promising.
So that many people are interested in developing or
contributing to the Pempek, Kerupuk and
Kempelang businesses in the city of Palembang.
With the development of the times and the existence
of major events in the city of Palembang this typical
food industry, especially cracker, pempek and
kempelang entrepreneurs are able to increase family
economic income, it is expected that there will be an
increase in production demand which will directly
affect the amount of labor absorption needed.
3. For the next researcher, it is hoped that this
research can be used as reference material and
similar research comparisons in the future,
especially regarding the Food Industry SME sector
(pempek, kerupuk / kempelang).
SEABC 2018 - 4th Sriwijaya Economics, Accounting, and Business Conference
240

REFERENCE
Central Bureau of Statistics. 2014. Definition of Small
Industries. Palembang: BPS. http://www.bps.go.id/
Accessed on February 15, 2014.
Central Bureau of Statistics. 2014. Definition of Capital.
Palembang: BPS. http://www.bps.go.id/ Accessed on
February 15, 2014.
Central Bureau of Statistics. 2014. Definition of Wages.
Palembang: BPS. http://www.bps.go.id/ Accessed on
February 15, 2014.
Central Bureau of Statistics. 2017. Production Value
Definition. Palembang: BPS. http://www.bps.go.id/
Accessed on October 9, 2017.
Borjas, George J. 2000. Labor Economics, second edition,
Mc Graw Hill Companies, Inc., Taiwan.
Fahlevi, Ade Achmad Syaifuddin, et al. 2016. Effect of
Total Business Units and Production Value on
Absorption in Small and Medium Industries in
Sidoarjo Regency. Journal.
http://www.ejournal.unesa.ac.id. Retrieved 15
February 2014.
Gujarati, Damodar. 1991. Basic Econometry. Sumarno
Zain Translation, Erlangga
Lilyawati. 2016. Analysis of Factors Affecting Labor
Absorption and Efficiency of Denpasar City Furniture
Industry. Journal. http://www.portalgaruda.org.
Retrieved 30 April 2017.
Mankiw, N. Gregory. 2008. Macroeconomics. Sixth
edition. Jakarta: Erlangga.
Rachman, Siswati. 2016. Analysis of the Influence of the
Development of Small and Medium Enterprises in the
Manufacturing Sector on Economic Growth in
Makassar City. http://www.portalgaruda.org.
Retrieved 30 March 2017.
Saputra, Rio Dhuwi. 2014. Analysis of the Influence of the
Number of Business Units, Investment and Minimum
Wages on Absorption of Small-Scale Industry
Workers in Malang Regency. Scientific journals.
http://www.portalgaruda.org. Retrieved 15 February
2014.
Setiawan, Achma Hendra. 2010. Analysis of Absorption
of Workers in Small and Medium Enterprises (UKM)
in Semarang City. Journal.
http://www.portalgaruda.org. Retrieved 30 April 2017.
Simanjuntak, Payaman. 1998. Introduction to Economics
Human resources, the publisher of the faculty of
economics at the University of Indonesia, Jakarta.
Sumarsono, Sonny. 2003. Economic Management of
Human Resources and Employment. Yogyakarta:
Graha Ilmu.
Tarmizi, Nurlina. 2012. Employment Economy.
Palembang.
Widanta, Putu Bagus. 2016. Determinants of Labor
Productivity and Absorption in the Silver Industry in
Klunkung Regency. Journal.
http://www.portalgaruda.org. Retrieved 30 March
2017.
Widiastuti, Ni Made Santi. 2014. Analysis of Manpower
Absorption in the Small and Medium Business Sector
(Case Study of Craft SMEs in Gianyar Regency.
Journal. Http://www.portalgaruda.org. Retrieved
March 30, 2017.
Yuditya, Arief Rachman. 2014. Analysis of the Effects of
Wages, Capital and Production Value on Absorption
of Workers in the Furniture Industry UMKM. Journal.
http://www.portalgaruda.org. Retrieved 15 February
2014.
Zamrowi, M. Taufik. 2007. Analysis of Manpower
Absorption in Small Industries (Study in Semarang
Small Furniture Industry). Thesis published.
Semarang: Postgraduate Program of Diponegoro
University.
Manpower Absorption in Fishcake, Crackers and Fish Cracker Businesses in Palembang City
241
