
Economic Performance of Cities in Indonesia: Impact Analysis of
Smart City Concept Implementation
Ayu Dwi Putri
1
and Khoirunurrofik
2
1
Department of Economics, Universitas Indonesia, Depok, West Java, Indonesia
2
Institute for Economic and Social Research, and Department of Economics, Universitas Indonesia, Depok, West Java,
Indonesia
Keywords: smart city, economic performance of cities, city smartness indicator, 2SLS, instrument variables
Abstract: Since 2012, many local governments in Indonesia have independently initiated city development by
implementing the concept of ‘the smart city’. This concept uses technology to improve city performance by
solving problems more effectively and efficiently. The smart city concept includes not only the use of
technology but also human capital, social and environmental issues as indicators of smart city attributes. As
the central government of Indonesia launched its programme ‘The Movement Towards 100 Smart Cities’ in
2017, it is important to measure the success of city development in terms of the smart city concept. This study
aims to estimate the effect of smart city concept implementation on the economic performance of cities in
Indonesia using the two stages least squares (2SLS) method. This study also uses instrument variables (IV)
by applying city smartness indicators to control some factors which will affect smart city concept
implementation. The smartness indicators used are smart economy, smart people, smart governance, smart
environment, smart mobility and smart living. The results prove that the implementation of the smart city
concept in districts or cities in Indonesia has a significant positive effect on the economic performance of
cities in Indonesia.
1 INTRODUCTION
The ‘Movement Towards 100 Smart Cities’
programme was officially launched in Indonesia in
2017. It was initiated by the Ministry of
Communication and Information together with the
Ministry of Home Affairs, Ministry of Public Works
and Public Housing, the National Development
Planning Agency and the Presidential Staff Office
(Kominfo, 2017). In the same year, the Indonesia
Smart City Rating (RKCI) was awarded to the 15 best
smart cities by the Bandung Institute of Technology.
The RKCI rewards, evaluates and maps cities that are
considered to have potential and are characterized as
smart cities, so that each can innovate based on the
particular conditions and characteristics of
Indonesian cities (RKCI, 2017).
As well as the cities selected in the Movement
towards 100 Smart Cities programme and the RKCI,
there are other cities that have also implemented the
smart city concept since 2012. With support from the
central government through the programme it is
expected that the number of cities that will implement
the smart city concept will continue to grow in the
next years. It is therefore important to know whether
cities that implement the smart city concept will be
successful or not in improving their economic
performance.
The concept of the ‘smart’ city aims to solve
various problems of cities efficiently and effectively
to improve the quality of life of urban communities,
through the use of information and communication
technology. According to Lombardi et al. (2012), the
main focus of smart city development is not only
limited to information and communication
technology and its infrastructure; it also encompasses
the role of human capital and education, social issues
and environmental problems.
Several studies of the application of the smart city
concept in the context of regional and urban
economics have been carried out, looking at various
aspects with different objectives. For example, a
study conducted by Boscacci et al. (2014) looked at
the effect of applying the smart city concept to the
122
Dwi Putri, A. and Khoirunurrofik, .
Economic Performance of Cities in Indonesia: Impact Analysis of Smart City Concept Implementation.
DOI: 10.5220/0008437501220132
In Proceedings of the 4th Sriwijaya Economics, Accounting, and Business Conference (SEABC 2018), pages 122-132
ISBN: 978-989-758-387-2
Copyright
c
2019 by SCITEPRESS – Science and Technology Publications, Lda. All rights reserved

attractiveness of the city and housing market prices.
Mundula and Auci (2013) verified the robustness of
the city smartness indicators proposed by Giffinger et
al. (2007) in explaining the efficiency of cities in
Europe. Meanwhile, Caragliu et al. (2011) conducted
a study with the same purpose as this present study,
by analysing the effect of the application of the smart
city concept on the economic performance of the city.
Although having similar objectives to the study
conducted by Caragliu et al. (2011), the use of
different methods and variables in this study are novel
in this area of research. A study in Indonesia carried
out by Ramadhan (2017) aimed to rank the results of
smart city implementation in metropolitan cities in
Indonesia using the analytical hierarchy process
method. This differs from the present study which
aims to discover the success of smart city concept
implementation by looking at the relationship
between the application of the concept and the
economic performance of cities and districts in
Indonesia, both those that have and have not
implemented the smart city concept, and not solely
metropolitan cities. The study period of 2012 to 2016
is also longer than previous studies, and in each year
cities that have not and have applied the concept of
‘smartness’ are researched, while the research
conducted by Ramadhan (2017) only looked at the
year 2015.
In this study, the city smartness indicators used to
analyse the concepts and definitions of the smart city
are the concepts proposed by Giffinger (2007),
namely smart economy, smart people, smart
governance, smart environment, smart mobility and
smart living. This set of urban qualities based on the
characteristics of ‘smartness’ proposed by Giffinger
et al. (2007) can explain the differences in economic
performance of each city. Furthermore, the
application of smartness concepts is adjusted to the
conditions of cities in Indonesia.
Each city has different characteristics and smart
city programme implementations, but their goals are,
of course, the same: to improve the performance of
the city in solving urban problems effectively and
efficiently to create improved welfare and quality of
life in urban areas. Economic performance can be
described through the per capita gross domestic
regional product (GDRP) of each city. Based on data
from the Central Bureau of Statistics (2018),
Indonesia's economy in 2017, measured by per capita
GDP, reached Rp 51.89 million or US$3,876.8,
which means that Indonesia’s economy in 2017 grew
5.07 per cent, a higher rate than the 2016 achievement
of 5.03 per cent. In terms of production, the highest
growth, of 9.81 per cent, was achieved in the
information and communication business sector. This
coincides with the increase in the number of cities
implementing the smart city concept since the
movement towards 100 Smart Cities programme was
launched in 2017. It is therefore necessary to examine
the influence of the application of the smart city
concept on the economic performance of cities in
Indonesia. The results prove that the implementation
of the smart city concept in districts or cities in
Indonesia has a significant positive effect on their
economic performance.
This paper is organized as follows: the first
section provides an overview of the importance of the
research and its novel aspects. The second offers
theoretical background and empirical studies from the
subject literature. The third section describes the data
and variables construction along with empirical
modelling and related estimation issues. The fourth
section provides results and analysis and the final
section provides our conclusions.
2 LITERATURE REVIEW
The concept of the smart city typically
emphasizes the use of technology and the internet.
Several definitions of the smart city have been put
forward, one of which is that, according to Giffinger
et al. (2007) a smart city is one with good
performance and a forward-looking attitude, and
which displays six characteristics (or dimensions)
built from a combination of ‘smartness’,
independence and public awareness. The ‘smart’
dimensions proposed by Giffinger et al. (2007) are
smart economy, smart people, smart governance,
smart mobility, smart environment and smart living.
In addition to these six dimensions, Nam and Pardo
(2011) developed a further three dimensions of the
smart city, including technology (hardware and
software infrastructure), population (creativity,
diversity and education), and institutions
(government and policy). From these various
dimensions it can be seen that technology and the
internet are not only the goals of smart cities; rather,
they are also tools that support the application of the
smart city concept. According to Caragliu et al.
(2011), a city becomes smart when it invests in
human capital, social aspects, transportation and
information and communication technology so as to
encourage sustainable economic growth and a high
quality of life, combined with wise natural resource
management and government participation.
Therefore, the label ‘smart city’ should indicate the
delivery of smart solutions which allow cities to
Economic Performance of Cities in Indonesia: Impact Analysis of Smart City Concept Implementation
123

develop through increasing productivity, both in
qualitative and quantitative terms.
According to the European Commission (2017), a
smart city is a place with networks and services that
are made more efficient for the benefit of society and
business through the use of technology. Endogenous
growth theory is used to support this research, in
which city development through the concept of the
smart city uses technology and is also supported by
human capital in order to solve urban problems
efficiently and effectively. The importance of
technology in the economy began to be supported
following the neo-classical Solow growth theory,
with a basic model based on Mankiw et al. (1992) and
Mankiw (2010) as follows:
Y = AF(K,L) (1)
The basic model of Solow’s growth theory
explains the influence of technology on production.
First, it assumes that the production function consists
of exogenous variables of production input, namely
capital (K) and labour (L); then technology (A) plays
a role in influencing output (Y). Increase in output in
this model is not only caused by an increase in capital
and labour, but also an increase in the productivity of
production factors due to the use of technology. If
inputs do not change, but productivity of the
production factor increases, output will increase.
From this, it can be concluded that technology plays
an important role in economic growth.
By adding to the influence of technology,
productivity will be increased, thus encouraging the
increased economic performance of cities, with per
capita GDRP standing as its proxy. In endogenous
growth theory, technology is also influenced by other
factors. In this study, the concept of the smart city
represents a technological factor, because in its
application it is always characterized as the use of
technology through which the economic performance
of the city can increase. In accordance with theory,
technology is endogenous, which is influenced by
other factors. In this study, the application of the
smart city concept is influenced by factors derived
from the indicators of city smartness initiated by
Giffinger et al. (2007): smart mobility, smart
economy, smart people, smart governance, smart
environment and smart living. Then, all investments
originating from within and outside the country in all
sectors become part of capital. Meanwhile, labour
here is seen as a highly educated workforce, because
endogenous growth theory focuses on the importance
of education and increasing human capital.
In neo-classical theory, however, technology is
exogenous, as part of the production process, and has
a constant growth of g. This cannot describe the
current condition of technological development.
Therefore, in endogenous growth theory, technology
is seen as endogenous, meaning that it is also
influenced by other factors. However, in the theory of
endogenous growth, increasing human resources is
the main driver of increasing economic productivity,
through learning by doing and through new
discoveries (Prijambodo, 1995). According to Howitt
(2010), endogenous growth is long-term economic
growth that is determined by economic factors and
forces that regulate opportunities and incentives to
create technological knowledge resulting in long-
term economic growth. The output growth rate per
person is determined by the level of technological
progress. In long-term economic growth,
technological progress is influenced by economic
factors which occur through innovation, in the form
of new products, processes, markets and the results of
economic activities.
3 RESEARCH METHODOLOGY
This research applies two-stage least squares
(2SLS) regression analysis using instrument variables
(IV). The analysis examines the application of the
smart city concept in each city by looking at the
influence of the application of the smart city concept
– with various instruments of urban smartness – on
their economic performance. The 2SLS method is
used because using the ordinary least squares (OLS)
method can cause estimation results to be biased and
inconsistent (Wooldridge, 2013). The 2SLS method
assumes that there are factors that can affect whether
a city will apply the smart city concept or not. This
means that there are endogenous variables which are
correlated with errors. In addition, the research model
is thought to have a two-way correlation between the
main independent variables and the dependent
variable: not only does the application of the smart
city concept affect the economic performance of
cities, but also per capita GRDP affects the cities in
their application of the smart city concept. To
understand this problem in this study, the basic model
for the 2SLS equation was formed based on the model
referring to Nagler (1999). The following is the model
in stage one and stage two of the estimation of this
study.
smartcity
it
= b
0
+ b
1
Z
it
+ b
2
lninvestment
it
+
b
3
lnhighedu
it
+ b
4
popdensity
it
(1)
SEABC 2018 - 4th Sriwijaya Economics, Accounting, and Business Conference
124

lngdrpcap
it
= b
0
+ b
1
(smartcity
it
) + b
2
lninvestment
it
+
b
3
lnhighedu
it
+ b
4
popdensity
it
+ (u
it
+ b
1
v
1
) (2)
In Equations 1 and 2, i is a city or district and t is
the year. The dependent variable used in this study is
the log of per capita GDP. The data is obtained from
the Central Bureau of Statistics and CEIC. The
independent variable which is the focus of this
research is the smart city variable, which is a dummy
variable worth 1 if the city or district has implemented
smart city concepts in a given year and is 0 if it has
not applied them. In this study, a city is assumed to
have applied the concept of the smart city when it has
implemented one of the indicators or dimensions of
urban smartness as proposed by Giffinger et al.
(2007).
Other independent variables which constitute the
control in this study are investment variables that
represents capital (K) in endogenous growth theory.
The variable investment is the value of investment
originating in the country (PMDA) and foreign
investment (PMA). This data was obtained from the
Investment Coordinating Board (BKPM). The
lnhighedu variable is a highly educated workforce
that represents the labour (L) factor in endogenous
growth theory. Data for this variable was obtained
from the Indonesia Labour Force Survey (Sakernas).
The popdensity variable, which represents regional
density, is the control variable in this study and data
for it was obtained from the Ministry of Home Affairs
and CEIC.
In the 2SLS method, instrument variables (IV) are
needed, being Z which can determine X1 but does not
affect Y. In this research, instrument variables are
needed that can affect a city in applying the concept
of smart city or not, but these variables may not affect
the log of per capita GDRP directly. Instrument
variables (Z) in this study refer to the indicators
proposed by Giffinger et al. (2007) and Cohen (2014)
and developing indicators from Ramadhan (2017).
The first instrument is the internet variable, which
is the percentage of internet penetration, used as an
instrument as well as representing indicators of urban
smartness in the aspect of smart mobility. Data for
this variable was obtained from the National Socio-
Economic Survey (Susenas). The second instrument
is the schoolenrollment variable, which is the
percentage of school participation at ages 16–18 years
or high school level, as a proxy indicator of city
smartness for the smart people aspect. Data for this
was obtained from the World Bank. The next
instrument variable is the proxy for the smart
economy which is the entrepreneur variable, or a
work force that is self-employed. Data sources were
drawn from the National Labour Force Survey
(Sakernas). For the smart environment aspect, the
lnflood variable is used, which is the flood frequency
in an area. Data was obtained from The National
Agency for Disaster Countermeasures (BNPB).
Another instrument variable is accountability, which
is a categorical assessment of local government
accountability based on the opinions given in the
financial statements of the Audit Board of the
Republic of Indonesia (BPK). Value 4 is given for an
‘unqualified’ opinion (WTP), value 3 is an
‘unqualified’ opinion with an explanatory paragraph
(WTP DPP), value 2 for a ‘qualified’ opinion with
exception (WDP), value 1 for an ‘adverse’ opinion
(TW) and 0 is a refusal to give an opinion ‘disclaimer’
or not expressing an opinion (TMP). Finally, the
crime variable used in this study is the percentage of
crime occurrences as a proxy of smart living.
The sample of this study is all districts or cities in
Indonesia divided into treatment groups: cities that
have implemented the smart city concept in a given
year, and control groups: cities that have not
implemented smart city concepts. It is known that
there are 65 districts or cities that implemented smart
city concepts from 2012 to 2016. The process of data
collection is performed by searching for information
on the internet. In this study, the city or district is said
to have implemented a smart city concept if they
already have a programme that has begun to apply at
least one of Giffinger et al.’s (2007) city smartness
indicators.
4 EMPIRICAL RESULTS
This section provides descriptive analysis of the
research data. Statistics based on the data can reveal
facts about differences in the characteristics of cities
that apply and do not apply smart city concepts in a
given year. From Figure 1 it can be seen that cities
which implemented smart city concepts have an
average per capita GDRP which is higher than those
that did not apply such concepts between 2012 and
2016. In addition, there is a fluctuation in per capita
GDRP in a city that applies the smart city concept.
This happens because in every year there are
additional cities that have just applied smart city
concepts and have a lower per capita GDRP value
than cities that had implemented them in the previous
year. This causes a decrease in the average per capita
GDRP in the city group that had implemented smart
city concepts in the following year. For example, in
2012 it was found that only Surabaya had
Economic Performance of Cities in Indonesia: Impact Analysis of Smart City Concept Implementation
125
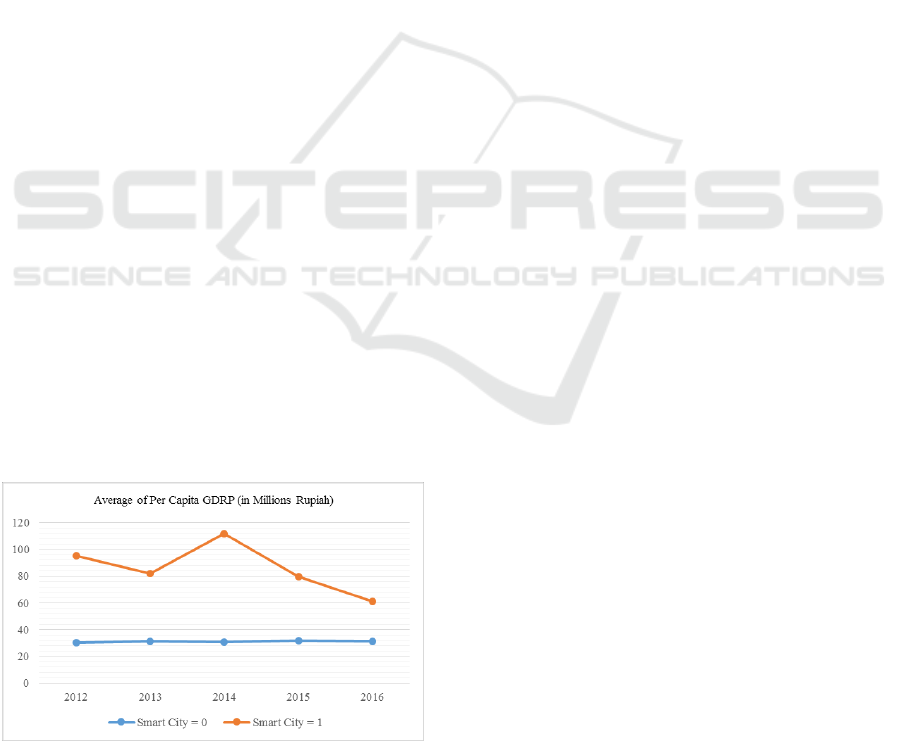
implemented smart city concepts, with its per capita
GDRP for that year being Rp 95.2 million. Then in
2013, Semarang began implementing smart city
concepts, with its per capita GRDP being Rp 61.9
million in 2013, causing a decrease in the average
GDRP per capita in the city group that had adopted
smart city concepts in 2013.
Based on data from the Central Bureau of
Statistics and CEIC, it is known that there are cities
that had good performance before applying the smart
city concept, such as Semarang. The per capita GDRP
of Semarang in 2012, when it did not apply the smart
city concept, was Rp 58.4 million. This means that
there was an increase in the per capita GDRP of
Semarang in 2013 after applying the smart city
concept to 61.9 million. However, it is known
Use 15-point based on data that the city of
Semarang had had high GDRP per capita since 2012,
that is, from before applying the smart city concept.
There are other cities that had not implemented the
smart city concept in 2012 but had a much lower per
capita GDP value than Semarang City. Therefore,
further exploration is needed into the effect of
applying the smart city concept on per capita GDRP.
Figure 4.1 indicates statistical summary results
show that the lowest per capita GDRP per year is
found in cities that have not implemented the smart
city concept, so that the average per capita GDRP of
the city group that has not applied the smart city
concept has reduced. It implied that the average per
capita GDRP of the cities that have implemented
smart city concepts in every year is always higher
than the cities that have not implemented them. Per
capita GDRP in this study is used to represent the
economic performance of cities. Therefore, based on
statistics, the data shows that cities that implement the
smart city concept have better urban economic
performance than cities that do not implement the
smart city concept.
Figure 1: Average per capita GDRP in cities that have and
have not applied the smart city concept
Source: Central Bureau of Statistics and CEIC, processed
by the author
4.1 Relationship between the
application of smart city concepts
and the economic performance of
cities in Indonesia
This study uses two regression methods: OLS and
2SLS estimations. The first step is to find out the
relationship between the application of the smart city
concept to the economic performance of cities in
Indonesia, and estimation using OLS regression is
performed regardless of the influence of endogeneity
on the model. The fixed effect method is used because
the data comprises a panel consisting of several
districts or cities and years. Another reason is because
there are differences in characteristics for each district
or city in Indonesia, so we could not conduct sample
selection for this research. In addition, after testing
the model selection using the Hausman test, it was
established that the panel model in this study is a fixed
effect model.
However, by using OLS regression, the smart city
variable in dummy form is considered potentially
inaccurate as a variable that shows the application of
the smart city concept, because it is potentially an
under- or over-estimate. Therefore, the results of OLS
regression may be biased because there is a problem
of endogeneity, which means there is a strong
correlation between errors with other factors that can
affect the application of the smart city concept in a
district or city. Based on this, the 2SLS method is
needed, using instrument variables that influence the
application of the smart city concept to overcome the
problem of endogeneity. Regression results using
both methods can be seen in Table 1.
The 2SLS estimation presented in Table 1 uses six
instrument variables, each of which is a proxy for one
of the six city smartness indicators initiated by
Giffinger et al. (2007). From Table 4.1 it can be seen
that R-squared OLS is greater than IV-2SLS because
OLS minimizes the residual sum of squares
(Wooldridge, 2013). The results show that the
application of the smart city concept has a significant
positive effect on the percentage change in per capita
GDP. Furthermore, it is known that there are quite
high differences in the coefficient values from the
regression results using both methods. By using the
OLS method, it is found that if the district or city
applies the smart city concept, then per capita GDP
will increase by 9% more than the city that does not
apply the smart city concept. Using the 2SLS method
using IV, it is found that if a district or city applies the
SEABC 2018 - 4th Sriwijaya Economics, Accounting, and Business Conference
126

smart city concept, the per capita GDRP will increase
by 83.9% more than the city that does not implement
the smart city concept. These results occur because of
bias and inconsistency due to the use of the OLS
method (Wooldridge, 2013). While other control
variables have little difference for the regression
coefficient.
The results show that the lninvestment and
lnhighedu variables have a positive relationship with
lngdrpcap, that is, the higher the percentage of
investment and the percentage of the workforce with
higher education in a city, the higher the per capita
GDP. Meanwhile, the popdensity variable has a
negative relationship with lngdrpcap. That is, the
higher the regional density, the lower the per capita
GDP.
Following these steps, it is necessary to perform a
Davidson-MacKinnon test to discover whether the
model has endogeneity problems, so we can ascertain
whether this study requires an instrument variable.
The results show that the model has an endogenous
problem, and so requires the 2SLS method with a
variable instrument (VI) to be used. The mean
Variance Inflation Factor (VIF) is 2.55, meaning
there is no multicollinearity problem in the model.
None of the variables used have a correlation value of
more than 0.8; thus, instrument variables can be used
because they do not have a direct correlation with the
dependent variable and other control independent
variables.
Table 1: Regression results of the relationship between the
application of the smart city concept and the economic
performance of cities, using fixed effect models in OLS and
2SLS
FE OLS
FE IV
VARIABLES
lngdrpcap
lngdrpcap
Smartcity
0.0912***
0.839***
(0.0172)
(0.140)
lninvestment
0.00140**
0.00107*
(0.000557)
(0.000598)
Lnhighedu
0.0993***
0.0302**
(0.00920)
(0.0151)
popdensity
-
-
0.000186***
0.000268***
(3.85e-05)
(3.67e-05)
Constant
16.24***
16.99***
(0.0966)
(0.159)
Observations
2,466
2,366
Number of cities
509
504
R-squared
0.244
0.133
Robust standard errors in parentheses*** p<0.01, **
p<0.05, * p<0.1
A strong instrument is needed to get the best
estimation results using the 2SLS-IV method. The
results of the weak-identification test indicate that the
value of the Cragg-Donald Wald F statistic is 17.01
which, as it is greater than 10 means that the six
instruments used are strong instruments. However,
the results of the Sargan-Hansen test carried out to
ascertain the validity of over-identifying restrictions
(Table 2) indicate that the validity of the instruments
are doubtful.
From Table 2 it can be seen that the instruments
that significantly affect the application of the smart
city concept are internet, flood and accountability.
That is, these variables are ‘good’ instruments. The
internet and lnflood variables have a positive
relationship with the probability of a city applying the
smart city concept. This suggests that a higher
percentage of internet penetration and more flood
events in an area will increase the probability of
districts or cities implementing the smart city
concept. Based on this finding, it can be said that the
internet supports the implementation of the smart city
concept and that the application of smart city
concepts is necessary for cities that experience
flooding problems. Furthermore, the accountability
variable has a negative relationship with the
application of the smart city concept. The implication
is that the application of the smart city concept is
needed in regions that have poor local government
accountability. In addition, the schoolenrollment,
entrepreneurship and crime variables do not
significantly affect the application of the smart city
concept. If we look at the regression coefficient, it can
be seen that the relationship between the internet
variable and the application of the smart city concept
has a higher elasticity (coefficient of more than 1),
which means changes in internet penetration will be
very sensitive to the probability of a city
implementing or not implementing the smart city
concept.
In the first stage regression model in Table 2,
other exogenous variables such as lninvestment,
Economic Performance of Cities in Indonesia: Impact Analysis of Smart City Concept Implementation
127

lnhighedu, and popdensity need to be included to
determine the relationship with the smartcity variable.
Other exogenous variables may not affect the
endogenous variables, which in this study is the
smartcity variable. If it is influential, this means that
exogenous variables have an influence on instrument
variables; this is not allowed in the 2SLS-IV method.
The results in Table 2 show that other exogenous
variables do not significantly affect the smartcity
variable.
Table 2: Results of the estimation of the relationship of the
six instrument variables and the application of the smart city
concept
VARIABLES
smartcity
internet
1.0875***
(0.201)
Schoolenrollment
-0.0028
(0.053)
lnentrepreneur
-0.0329
lnflood
(0.049)
0.0184**
(0.0088)
accountability
-0.0128**
(0.006)
crime
lninvestment
lnhighedu
popdensity
_cons
-1.287
(0.807)
0.00004
(0.934)
0.026
(0.0135)
0.00009
(0.00006)
-0.0913
(0.539)
Sargan-Hansen stat.
Cragg-Donald Wald F stat.
0.000
17.01
Based on the results presented in Table 2,
instrument variables that significantly affect the
probability of cities implementing the smart city
concept are internet, lnflood and accountability,
which are proxies of indicators of urban smartness for
smart mobility, smart environment and smart
governance factors. When regressed using the three
instruments, the results show that by focusing on
these three aspects, the application of the smart city
concept has a significant positive effect on per capita
GDP.
All three instruments can be seen to be strong.
This is shown by the Cragg-Donald Wald F statistic
value of 32.87. Even so, the over-identified model has
a validity problem, which is shown by the results of
the Sargan-Hansen test having a p-value of 0.0005.
That is, the instrument is not issued correctly from the
estimation of the equation and possibly correlates
with the error.
Table 3: Results of the estimation of the relationship
between implementation of the smart city concept and the
economic performance of cities using three significant
instrument variables
VARIABLES
lngdrpcap
Smartcity
0.871***
(0.145)
lninvestment
0.00103*
(0.000621)
lnhighedu
0.0304**
(0.0146)
popdensity
-0.000273***
(3.85e-05)
Constant
16.98***
(0.155)
Observations
2,465
Number of cities
509
Robust standard errors in parentheses*** p<0.01, **
p<0.05, * p<0.1
This study has produced the new discovery that
the internet, as an aspect of smart mobility, is the most
powerful instrument in influencing the probability of
cities to implement smart city concepts which will in
turn have a significant effect on urban economic
performance. Regression results are coherent with
endogenous growth theory, in which the technology
in this study is a smartcity variable that does not
appear but is influenced by other factors. The
instrument variable is therefore used to influence the
application of smart city concepts. In connection with
the research framework, by using city smartness
indicators the smart city concept can be said to be an
element of technology that influences per capita
GDRP, and this is supported by the application of the
internet as a strong instrument variable. In addition,
based on the results of the regression, the smartcity
variable, which is a proxy of technology (A), the
lninvestment variable, which is a proxy of capital (K),
and the lnhighedu variable, which is a proxy of labour
(L), give results in the direction of the relationship in
accordance with theory regarding the relationship on
several models, suggesting that these factors will
positively affect economic performance.
There are similarities in this research to the
previous study by Caragliu et al. (2011), which has
similar objectives but uses different variables.
Caragliu et al. (2011) only use the OLS method to see
SEABC 2018 - 4th Sriwijaya Economics, Accounting, and Business Conference
128

the influence of each city smartness indicator. This
approach is considered less sharp and can cause over-
or under-estimates in describing the concept of the
smart city in the research, because regression can be
performed on each variable without mentioning that
the variable is an indicator of city smartness. In
contrast, in this study, by creating a dummy for cities
that have and have not implemented smart city
concepts, and by incorporating indicators of city
smartness as instrument variables that affect smart
city application, we can improve the sharpness of the
smart city concept in this study. This research can
identify cities that have and have not implemented the
smart city concept.
4.2 Analysis of each city’s smartness
indicators in smart city concept
implementation and economic
performance
If the regression is carried out using each
instrument individually, these being each of the
proxies from the city smartness indicators, we can
know which of the city’s aspects of smartness most
strongly applied in the development of the smart city.
The results in Table 4 show that only the use of the
internet instrument and schoolenrollment variables
can lead the application of the smart city concept to
have a significant positive effect on per capita GDP,
as shown in columns 1 and 2. The internet variable is
a proxy of the smart mobility indicator and the
schoolenrollment variable is a proxy of the smart
people indicator. In addition to the level of internet
penetration, a higher school participation rate can also
support the city in implementing the smart city
concept.
Table 4: Results of estimated relationship in implementing the smart city concept and per capita GDRP using each smart city
indicator as a single instrument
(1)
(2)
(3)
(4)
(5)
(6)
VARIABLE
lngdrpcap
lngdrpcap
lngdrpcap
lngdrpcap
lngdrpcap
lngdrpcap
Smartcity
1.063***
1.875***
4.461
-0.255
11.94
0.192
(0.186)
(0.553)
(13.77)
(0.440)
(30.02)
(0.335)
lninvestment
0.00094
0.000495
-0.00066
0.00157**
-0.00419
0.00135**
(0.00066)
(0.0009)
(0.00708)
(0.00062)
(0.014)
(0.00055)
Lnhighedu
0.0135
-0.0584
-0.287
0.130***
-0.948
0.0913***
(0.0170)
(0.0501)
(1.213)
(0.0411)
(2.653)
(0.0312)
Popdensity
-0.0003***
-0.0004***
-0.00068
-0.00015**
-0.0015
-0.0002***
(4.79e-05)
(0.00011)
(0.00157)
(7.03e-05)
(0.00348)
(5.52e-05)
Constant
17.17***
17.94***
20.41
15.91***
27.56
16.33***
(0.182)
(0.552)
(13.14)
(0.438)
(28.74)
(0.346)
Observations
2,466
2,414
2,466
2,465
2,466
2,416
Number of cities
509
504
509
509
509
509
Robust standard errors in parentheses*** p<0.01, ** p<0.05, * p<0.1
The results in Table 5 show that internet and
schoolenrollment are strong instrument variables,
based on the Cragg-Donald Wald F statistic value.
This indicates the instrument variables have a strong
relationship with endogenous variables, namely the
smartcity variable. The results show that the internet
and schoolenrollment variables have a significant
positive effect on smart city implementation at a 99%
confidence level. Thus, smart city development
influenced by the level of internet penetration and
school participation rate will improve the economic
performance of the city.
Inflood and crime, which are proxies of the smart
environment and smart living indicators,
respectively, significantly influence the application of
the smart city concept at a 90% confidence level. The
percentage increase in flooding events has a
significant positive effect on the probability of a city
implementing the smart city concept. That is, the
application of the smart city concept is needed in
Economic Performance of Cities in Indonesia: Impact Analysis of Smart City Concept Implementation
129

cities that have a high frequency of flood events.
Meanwhile, the crime rate in a district or a city has a
significant negative effect on the probability of the
city implementing the smart city concept. Crime can
be an obstacle to the implementation of urban
development through application of the smart city
concept. However, because these two instruments are
weak, the use of the inflood and crime instruments
does not lead to the application of smart city concepts
significantly affecting per capita GRDP. The
implication is that smart city development that
focuses on aspects of smart environment and smart
living or on the conditions of flooding and city crime
does not significantly improve the city’s economic
performance.
Similar results apply for the entrepreneurship and
accountability variables which are proxies of the
smart economy and smart governance indicators.
Because both are very weak instruments, the
application of the smart city concept as influenced by
these factors does not significantly affect per capita
GDRP. In addition, this matter was influenced by the
problem of under-identification in the Canon
Anderson test results. If the entrepreneur and
accountability variables are used as a single
instrument, the instrument experiences under-
identification problems, which means that they are
not relevant or do not have a relationship with the
application of the smart city concept.
The lnentrepreneur variable has a negative
relationship with the smartcity variable. The
application of the smart city concept is needed to
encourage regions that have a small number of
businesses. If the percentage of the workforce who
are self-employed is still fairly low, this will increase
the probability of the city implementing the smart city
concept. In Table 5 it is shown that the accountability
variable has a positive relationship with the
application of the smart city concept. The implication
is that the better the accountability of local
governments in a region, the easier it will be to
implement the concept of the smart city. However,
the results of this study indicate that applications of
the smart city concept that focus on smart economy
and smart governance in terms of entrepreneurial
conditions and accountability of government do not
significantly improve urban economic performance.
Overall, it can be seen that the internet as a proxy of
the smart mobility indicator is the most powerful
positive instrument to be applied to the smart city
concept in Model 1 in Table 5. The application of the
smart city concept by internet penetration can
improve the economic performance of cities. In
addition, the schoolenrollment variable is also a
strong instrument.
Table 5: Estimation results of first stage of relationship between each proxy of city smartness indicators and smart city
implementation
(1)
(2)
(3)
(4)
(5)
(6)
VARIABLE
smartcity
smartcity
smartcity
smartcity
smartcity
smartcity
internet
0.927***
(0.163)
schoolenrollment
0.142***
(0.049)
lnentrepreneur
-0.014
(0.049)
lnflood
0.014*
(0.0085)
accountability
0.0019
(0.005)
crime
-1.452*
(0.845)
lninvestment
-0.000037
0.00033
0.00048
0.00047
0.00046
0.00045
(0.0004)
(0.0004)
(0.0004)
(0.0004)
(0.0004)
(0.0005)
lnhighedu
0.022*
0.075***
0.088***
0.088***
0.087***
0.095***
(0.013)
(0.014)
(0.015)
(0.015)
(0.015)
(0.015)
popdensity
0.00009
0.0001
0.0001
0.0001
0.0001
0.0001
(0.00006)
(0.00007)
(0.00007)
(0.00007)
(0.00007)
(0.00007)
_cons
-0.427***
-0.9***
-0.807
-0.96***
-0.944***
-1.005***
(0.136)
(0.155)
(0.534)
(0.157)
(0.16)
(0.163)
Cragg-Donald Wald F stat.
85.27
12.31
0.13
3.34
0.18
3.53
Anderson Canon.
0.0000
0.0004
0.7175
0.0672
0.6745
0.0599
SEABC 2018 - 4th Sriwijaya Economics, Accounting, and Business Conference
130

(p-val)
p>|t|, *p<0.1, **p<0.05, ***p<0.01
5 CONCLUSIONS
By using the 2SLS method, this study aimed to
discover the influence of urban development by
application of the concept of the smart city on the
economic performance of cities. The results of the
study prove that from 2012 to 2016 the application of
the smart city concept in Indonesia had a positive
effect on improving the economic performance of
cities. This is influenced by the level of internet
penetration in an area as an instrument variable that
influences the probability of the city applying or not
applying the smart city concept. Therefore, it can be
concluded that the level of internet penetration as an
aspect of smart mobility, plays the most important
role in urban development resulting from the
application of the smart city concept.
Just by combining three instruments that
significantly affect the application of the smart city
concept: internet, flood and accountability, it has been
possible to make the application of the smart city
concept significantly influence the economic
performance of cities. That is, the application of the
smart city concept that is influenced by or focuses on
the level of internet penetration in an area, on flood
events or on the accountability of local government
can improve the economic performance of cities. In
other words, to improve its economic performance a
city should focus on three aspects of urban
‘smartness’: smart mobility, smart environment and
smart governance.
ACKNOWLEDGEMENTS
Authors thank to Hibah PITTA 2018, Universitas
Indonesia for partly and financially support to rewrite
and publish the first author’s undergraduate thesis
that is submitted to Department of Economics,
Faculty of Economics and Business, Universitas
Indonesia. All remaining errors are our own.
REFERENCES
Angrist, J.D. and Krueger, A.B. (2001) ‘Instrumental
variables and the search for identification: From supply
and demand to natural experiments, Journal of
Economic Perspectives, 15(4), pp. 65–82.
Boscacci, F., Maltese, I., and Mariotti, I. (2014) ‘Smartness
and Italian cities’ Journal of Land Use, Mobility and
Environment. doi 10.6092/1970-9870/2512
Caragliu, A., Bo, C. D. and Nijkamp, P. (2011) ‘Smart cities
in Europe’, Journal of Urban Technology, 18(2), pp.
65–82.
Caragliu, A. and Bo, C.D. (2012) ‘Smartness and European
urban performance: Assessing the local impacts of
smart urban attributes’, Innovation: The European
Journal of Social Science Research, 25(2), pp. 97–113.
Cohen, B. (2014) The smartest cities in the world 2015:
Methodology. Available at:
https://www.fastcompany.com/3038818/the-smartest-
cities-in-the-world-2015-methodology (Accessed: 10
February 2018).
Combes, P.-P., Duranton, G., Gobillon, L. and Roux, S.
(2010) Estimating agglomeration economies with
history, geology, and worker effects, Agglomeration
Economics, pp. 15–66, Available at:
https://repository.upenn.edu/real-estate_papers/21
Cracolici, M.F., Cuffaro, M. and Nijkamp, P. (2009) ‘The
Measurement of economic, social, and environmental
performance of countries: A novel approach’, Social
Indicators Research, 95(2), pp. 339–356.
European Commission (2017) Smart cities. Available at:
https://ec.europa.eu/digital-single-market/en/smart-
cities. (Accessed: 10 February 2018).
Giffinger, R., Fertner, C., Khamar, H., Kalasek, R., Pichler-
Milanovic, N. and Meijers, E. (2007) Smart cities-
ranking of European medium-sized cities. Available at:
http://www.smart-
cities.eu/download/smart_cities_final_report.pdf
(Accessed: 10 February 2018).
Howitt, P. (2010) Endogenous growth theory. Available at:
https://link.springer.com/chapter/10.1057/9780230280
823_10.(Accessed: 1 June 2018).
Investopedia (2018) Per capita GDP. Available at:
https://www.investopedia.com/terms/p/per-capita-
gdp.asp. (Accessed: 27 February 2018)
Kanter, R.M. and Litow, S.S. (2009) ‘Informed and
interconnected: A manifesto for smarter cities, Harvard
Business School Working Paper, No. 09-141.
Kominfo (2017) Langkah Menuju “100 Smart City”.
Available at:
https://kominfo.go.id/content/detail/11656/langkah-
menuju-100-smart-city/0/sorotan_media (Accessed: 3
February 2018).
Lombardi, P., Giordano, S., Farouh, H. and Yousef, W.
(2012) ‘Modelling the smart city performance’,
Innovation: The European Journal of Social Science
Research, 25:2, pp. 137–149.
Mankiw, N.G. (2010) Macroeconomics. 7th edn. New
York: Worth Publishers.
Economic Performance of Cities in Indonesia: Impact Analysis of Smart City Concept Implementation
131

Mankiw, N.G., Romer, D. and Well, D.N. (1992) ‘A
contribution to the empirics of economic growth’, The
Quarterly Journal of Economics, 57, pp. 407–437.
Mundula, L. and Auci, S. (2013) ‘Smart cities and a
stochastic frontier analysis: A comparison among
European cities’, Munich Personal RePEc Archive
Paper, No. 51586
Nagler, J. (1999) Notes on Simultaneous Equation and Two
Stage Least Squares Estimates. Available at:
www.nyu.edu/classes/nagler/quant2/notes/2slsnotes_o
h.pdf. (Accessed: 17 February 2018).
Nam, T. and Pardo, T.A. (2011) Conceptualizing smart city
with dimensions of technology, people, and institutions.
https://www.researchgate.net/publication/221585167_
Conceptualizing_smart_city_with_dimensions_of_tec
hnology_people_and_institutions (Accessed on: 12
February 2018)
Prijambodo, B. (1995) Endogenous Growth Theory: A brief
theoretical review and its implications. Available at:
http://perpustakaan.bappenas.go.id/lontar/file?file=digi
tal/19377-%5B_Konten_%5D-Konten_%5D-
Konten%20445.pdf (Accessed: 25 May 2018).
Ramadhan, E. (2017) Peringkat Smart City dan
Komponennya pada Kota-Kota Metropolitan di
Indonesia. Yogyakarta: Universitas Gadjah Mada.
RKCI (2017) Maksud dan Tujuan RKCI. Available at:
http://ratingkotacerdas.id/. (Accessed: 2 March 2018).
Wooldridge, J.M. (2013) Introductory econometrics: A
modern approach. 5th edn. Andover, UK: Cengage
Learning.
SEABC 2018 - 4th Sriwijaya Economics, Accounting, and Business Conference
132
