
Potential Implementation of Goods and Services Tax as a Substitute
for Value Added Tax in Indonesia
Naufalia Dinar Primacita
1
and Khoirunurrofik
2
1
Ministry of Finance, DG Custom, Indonesia
2
Institute for Economic and Social Research (LPEM), Faculty of Economics and Business, Universitas Indonesia,
Keywords: Goods and services tax, gross regional domestic product, surcharge, value added tax.
Abstract: This research aims to analyze the feasibility of implementing a goods and services tax as a substitute for
value added tax in Indonesia during the period 2005 to 2015. It also estimates the potential revenues made at
both central and local government levels. This study uses a panel data method prepared through descriptive
and econometric analysis. The unit of analysis is between provinces in Indonesia, with the findings
correlated to Stiglitz’s theory. The findings show that goods and services tax (GST) has the potential to be
feasibly applied in Indonesia as an alternative to value added tax (VAT), and that it would provide a greater
potential tax revenue than VAT. Consequently, if GST were to be implemented at a regional level,
interprovincial equity could be achieved by empowering fiscal equity through a local surcharge tax system.
1 INTRODUCTION
Fiscal strains are occurring in Indonesia and the
efficiency and effectiveness of revenues from
various taxes implemented are not optimal. The Data
from Central Bureau of Statistics (Badan Pusat
Statistik or BPS) in 201) confirms that the country’s
tax ratio to gross domestic product (GDP) is still
relatively low in comparison with countries of both
the ASEAN bloc and worldwide, at around 11% to
13% (Worldbank). Figure 1 shows the fluctuation in
the tax ratio in Indonesia over the period 2010 to
2016, and this is a condition that affects the
government’s funding sources for carrying out
development and achieving welfare objectives for
the population. In relation to expansion of the tax
base, fiscal policy has an important role to play in
the government’s plans for sustainability of the
economy, and high tax revenues will provide more
sources of funding for the country’s development.
During the five years to 2016, value added tax
(VAT) was the second-highest contributor to tax
revenue after income tax, with an increasing trend
every year. However, while its contribution was
constantly increasing it did not have a significant
impact on improving the ratio of tax to GDP. Thus,
as an indirect tax, VAT is not seen to be impacting
state tax revenues effectively. In addition, the VAT
elasticity value of 0.82 (Nurhidayati, 2013) indicates
that VAT is not very elastic with reference to the tax
base. Accordingly, the government should review its
existing policies both in terms of intensification and
intensification.
Taxation of the service sector (“taxable
services”) as well as taxable goods should be
explored as a potential tax revenue source. As a
developing country, Indonesia faces structural
transformation that causes a transition of production
activity from the primary sector to the secondary
sector. Agrarian countries such as Indonesia focus
on agricultural production in terms of products such
as raw materials or processed ingredients consumed
in the community. However, with the impact of
global competition the agricultural sector has
declined in recent years while the manufacturing and
services sectors have grown. This may lead to
technological improvements and shifting consumer
preferences which will bring about structural
transformation in Indonesia and transfer attention to
the service sector.
102
Dinar Primacita, N. and Khoirunurrofik, .
Potential Implementation of Goods and Services Tax as a Substitute of Value Added Tax in Indonesia.
DOI: 10.5220/0008437301020111
In Proceedings of the 4th Sriwijaya Economics, Accounting, and Business Conference (SEABC 2018), pages 102-111
ISBN: 978-989-758-387-2
Copyright
c
2019 by SCITEPRESS – Science and Technology Publications, Lda. All rights reserved

Figure 1. Realization of domestic tax revenue in Indonesia 2010–2016
Source: BPS, 2017
To tackle this issue, the Indonesian government
has begun to review the possibility of changing VAT
into a goods and services tax (GST). This tax reform
is being analyzed by the Ministry of Finance as a
revision aspect of VAT Act No.42 of 2009. This
policy aims to expand the tax base and increase the
ratio of tax revenue to GDP (the “tax ratio”). Even
though GST is more widely implemented in
developed countries, Indonesia as a developing
country could also apply this type of tax. In previous
studies, discussions have related to tax revenues at a
national level; the question therefore arises of
whether tax revenue at the regional level, such as
provinces and cities, can also be similarly analyzed
and changed. However, since GST is focused at the
central level, it will not have a significant impact on
the equitable distribution of income between
provinces.
When looked at from the administration aspect,
the collection system for GST is more convenient
than VAT because the administration of VAT
revenues and VAT expenditures creates high
accounting costs. In addition, the potential
occurrence of “overpayments” and “underpayment”
create inefficiency in VAT administration. One of
the steps toward developing efficiency in fiscal
policy by optimizing tax revenue at both central and
provincial level is the use of an surcharge tax
(opsen) approach. This can provide potential
taxation opportunities that can be used by both
central and local governments to increase gross
regional domestic product (GRDP). Indeed, it could
lead to improvement in the income distribution
between each local government on an aggregate
basis. Therefore, the objective of this study is to
analyze the feasibility of implementing GST as a
substitute for VAT in Indonesia, and to estimate the
potential revenues of GST application for central
government, and for local governments if a
surcharge system is applied.
2 LITERATURE REVIEW
GST has been widely implemented in developed
countries with a range of objectives. There are at
least five countries––Australia, Canada, India,
Malaysia and Singapore––presently changing their
taxation systems toward GST, and these are the main
reference countries for this study.
2.1 Goods and services tax (GST)
By definition, GST is one of the indirect tax types
which is levied on individuals who engage in
consumption activities at each business level.
Consequently, there is no need to wait for goods or
services to acquire added value before they can be
taxed. Based on World Bank information, the tax
percentage levied as GST is lower than for VAT,
with the standard GST level charged being 6%.
Moreover, taxable goods which are taken directly
from their sources are also able to be taxed, such as
in the mining and extraction sectors. There are,
however, tax exemptions for primary goods, such as
11.30
12.3
11.90
11.9
11.40
10.7
12.20
10
10
11
11
12
12
13
0
200
400
600
800
1 000
2010 2011 2012 2013 2014 2015 2016
persen
Trillion Rupiah
PPh PBB+PBHTB
PPN+PPnBM Cukai
Pajak Perdagangan Internasional Pajak Lainnya
Rasio Pajak
Potential Implementation of Goods and Services Tax as a Substitute of Value Added Tax in Indonesia
103

for micro, small, and medium (UMKM) units, and
for agricultural products, health goods, education
sectors, and housing for those with low income. This
aims to provide incentives where needed and to
protect primary sectors to avoid shocks to the
economy.
2.2 Stiglitz’s theory
Stiglitz’s theory (2000) states that a good tax policy
achieves at least five principles of taxation:
efficiency, administrative simplicity, flexibility,
political responsibility, and fairness. In this study,
these five principles will be used as evaluation
indicators in analyzing the feasibility of potential
GST revenues compared to potential VAT revenues.
Efficiency is defined as a tax system that has the
potential to improve economic efficiency. Efficiency
in the tax system refers to the allocation of economic
resources to achieve optimal tax revenue, the
minimization of deadweight loss that occurs in tax
revenue, and a ratio between tax revenue and the
cost of tax officers’ salaries of greater than 1.
The second principle is administrative simplicity.
Along with the delivery of simple administrative
costs and cheap compliance costs, this is also one of
the principles which makes it easier for the taxpayer
to perform their obligations.
The tax system must also be flexible, enabling it
to respond to changes in the state of the economy by
being easily adapted to meet changes in economic
conditions.
Another principle is the responsibility of
stakeholders, in this case the government (political
responsibility). A high level of political
responsibility will demonstrate transparency
between the government and the taxpayer. The
applied tax base and the amount of tax rate to be
paid should also be clearly known, so that taxpayers
can be sure of the exact amount of tax to be levied
and can evaluate how accurately the system has been
applied.
The last principle is fairness. The tax system
should embrace principles that treat individuals
fairly. Equity is divided into aspects: horizontal
equity and vertical equity. Horizontal equity occurs
in a tax imposed on individuals with the same
economic circumstances, so that people are treated
the same and are subject to the same percentage of
tax burden. In contrast, vertical equity is the
imposition of taxes with different percentages of tax
burden in accordance with the ability to pay of
individuals; thus, it can create equality among
taxpayers.
Another important element to take into account
in analyzing tax effectiveness is the nature of the
changes that occur in tax revenue. Rosen and Gayer
(2010) state that the tax burden of a taxing unit is
affected by the elasticity of demand and supply of
the taxed goods and services. This can be used to
estimate the productivity of tax revenues. In
considering these elements, the principles of Stiglitz
will be used as benchmarks of the potential
feasibility of the implementation of GST as the
transition taxation for VAT. The results will be
explained through a descriptive analysis method.
Study of GST has been carried out by previous
researchers, some of whom have analyzed the
causation and descriptive nature of tax reform
through the implementation of GST tax policies. A
study by Jenkins and Khadka (1998) investigated
how Singapore modified its taxation system to meet
changes in the country’s economy. The findings of
this study are that by using GST Singapore managed
to grow its export competitiveness and minimize the
transitional and compliance costs that arose from the
shift from the previous tax regime to the new one.
GST was implemented in Singapore as a transition
from a tax policy that previously embraced sales tax
to one based on GST. In spite of having the same
objectives, the implementation of these two tax
types is different. Taking advantage of its strategic
business location as the largest cargo-handling port
in Asia, Singapore decided to transition its taxation
policy from sales taxes to GST, and has been able to
maintain its collection of tax during this transition.
Likewise to Singapore, India is the first developing
country to introduce GST which can be said to be
successful in its application. In his study, Ramesh
(2015) examines the challenges and opportunities of
the implementation of dual GST, namely central
GST and state GST. By applying a GST tax rate of
2% gradually increasing to 12% as a first step of
implementing GST, India has been able to
implement this consumption tax policy. The findings
of Ramesh’s (2015) study reveal the minimization of
cascading effect, the renewal of tax revenues, and
increasing economic growth by creating integration
between regions through a uniform tax rate.
A study by Valadkhani (2005) examined the
impact of GST in Australia on the prices of goods
and services including on the consumer price index
(CPI) basket. It found that there were no significant
changes in the CPI basket. The reason Australia
began to implement a GST policy was to increase
the competitiveness of its country’s exports, given
that, as a country producing enough raw materials,
the Australian government wanted to optimize its
SEABC 2018 - 4th Sriwijaya Economics, Accounting, and Business Conference
104

sectors. The result of the transition proves that
Australia was able to keep its inflation level steady
as seen from CPI from before to after GST was
applied. There was also a study by Grady (1990)
into the effects of GST implementation on the
distribution of income in Canada. Equal distribution
of income can help those with low to middle
income. Meanwhile, Palil and Ibrahim (2011)
investigated the impact on those with lower middle
income in Malaysia of the implementation of GST,
using the analysis of variance (ANOVA) method.
The results of these findings indicate that exemption
taxes were used. A rise in tax credit is used as an
incentive for the implementation of the introduction
of GST. Furthermore, Mansor and Ilias (2013)
provided an argument for the benefit of GST
application for Malaysian’s people in strengthening
the economy and improving the public’s quality of
life.
The practical base for applying GST in these
countries is to impose tax burdens on taxpayers at
every level of economic activity with a lower tax
rate than the rate for VAT. The strategies undertaken
by the five countries in the literature referenced
above are relatively similar, such as controlling CPI
to avoid inflation, especially during the introduction
of GST. In addition, to avoid double taxation, the tax
base should be clearly established so as not to cause
cascading effects across output tax and income tax,
which would lead to high accounting costs. As a
result, inefficiency would occur in terms of
admissibility. Furthermore, increasing the GST rate
gradually and decreasing corporate income tax can
be used as an incentive for business actors in the
introductory period. Finally, tax exemptions in
certain sectors, such as education, health,
agricultural products, and non-profit local
transportation, can be included. The studies
referenced above can strengthen the authors’
arguments regarding the implementation of GST as
seen from the acceptance and accuracy of the
applied taxation principles.
3 RESEARCH METHODOLOGY
This paper applies two approaches to the research
questions. First, we carry out descriptive analysis to
examine the feasibility of GST application. For the
comparison of GST and VAT described, this
research conducts a calculation model that describes
the tax base of the tax-type model-building process.
Descriptive analysis is conducted to answer the first
research question, that is, an examination of the
feasibility of applying GST in Indonesia. In this
case, GST acceptance at the central level is the same
as for the existing VAT. Second, we will perform
econometric estimation of the potential tax revenue
from GST in Indonesia as determined by several tax
basis variables, as follows:
3.1 Equity ratio
The level of the equity ratio can be seen by
calculating the ratio of tax receipts to acceptance
nationally. In this case, the authors compare the
potential ratios of VAT and the estimated potential
of GST acceptance for domestic revenue and GDP:
A =
𝑽𝑨𝑻
𝐃𝐨𝐦𝐞𝐬𝐭𝐢𝐜 𝐑𝐞𝐯𝐞𝐧𝐮𝐞
; B =
𝑽𝑨𝑻
𝐆𝐃𝐏
(1)
and
𝐂 =
𝑮𝑺𝑻
𝑫𝒐𝒎𝒆𝒔𝒕𝒊𝒄 𝑹𝒆𝒗𝒆𝒏𝒖𝒆
; 𝐃 =
𝑮𝑺𝑻
𝑮𝑫𝑷
𝐚𝐥𝐬𝐨
𝐄 =
𝑮𝑺𝑻
𝑽𝑨𝑻
The greater the value of A, B, C, D, and E the
greater the equity. In contrast, the smaller the value
of the ratio, the lower the spread equity. To evaluate
the feasibility of GST implementation, the authors
focus on the value of the E ratio, which identifies the
ratio of potential GST revenues to potential VAT
revenues. If the value is greater than 1, GST is
feasible for implementation in Indonesia, and vice
versa.
3.2 Potential GST calculation
Estimated potential GST receipts are based on total
consumption expenditures, composed of both
household and private sectors, multiplied by a GST
rate of 6%. This approach is one of three GST
acceptance theories used in India and adapted from
previous research (Rao & Chakraborty, 2013). The
scale of the analysis used in this case is national and
annual, and the estimation equation is therefore as
follows:
𝑮𝑺𝑻
𝒕
= 𝚺
(
𝒄𝒐𝒏𝒔𝒑𝒆𝒓𝒌𝒂𝒑𝒊𝒕𝒂
𝒊𝒕
∗ 𝒑𝒐𝒑𝒖𝒍𝒂𝒕𝒊𝒐𝒏
𝒊𝒕
∗ 𝟏𝟐 ∗
𝟔%
)
+ (𝒄𝒐𝒏𝒔
𝒑𝒓𝒊𝒗𝒂𝒕𝒆
𝒊𝒕
∗ 𝒏𝒖𝒎𝒃𝒆𝒓 𝒐𝒇
𝒑𝒓𝒊𝒗𝒂𝒕𝒆
𝒊𝒕
∗ 𝟔%)
(2)
Equation 2 indicates that GST would be affected by
total consumption activities in both the individual
Potential Implementation of Goods and Services Tax as a Substitute of Value Added Tax in Indonesia
105

household and private sectors, multiplied by a GST
standard rate of 6% per year.
3.3 VAT potential calculation
The GST value used in the estimation is the potential
value. So that like-for-like comparability can be
achieved, the VAT calculation also uses the
potential rather than the actual value. The potential
for VAT revenues is based on the value of GDP by
expenditure for household and private consumption
at a tax rate of 10%, because by definition VAT and
GDP are similarly based on value added.
𝑷𝑷𝑵
𝒑
=
𝟏𝟎
𝟏𝟎𝟎
∗
𝚺(𝑪
𝒉𝒐𝒖𝒔𝒆𝒉𝒐𝒍𝒅
+𝑪
𝒑𝒓𝒊𝒗𝒂𝒕𝒆
)
𝒕
(3)
Equation 3 indicates the potential VAT value from
the sum of value added of goods and services
multiplied by the VAT rate implemented.
3.4 Empirical estimation
Six variables are used in the model, representing
aspects expected to have an effect on potential tax
revenue from GST. The first variable (a targeted
variable in this study) is GRDP. The amount of
regional revenue can be estimated from the value of
GRDP and domestic income as a basis for tax
collection. Since, the characteristics of provinces in
Indonesia are different and making the potential for
regional income also different, so this GRDP
variable is used to identify the potential for regional
revenues, including the potential for GST revenue.
To analyze price changes in goods and services,
as well as to identify the difference in inflation
before and after GST implementation (transitional
condition), the value of the consumer price index is
symbolized by CPI and quadratic CPI (SQCPI). This
variable is used as an adaptation of the method used
in the study by Valadkhani (2005), which analyzed
CPI basket changes resulting from the transition to
GST in Australia.
Consumption by the government as well as
household and private consumption are taxed. This
variable is used as a control variable in the model to
identify potential tax revenue that can be levied from
the consumption activity of economic actors in a
country. Not only is government spending
referenced in terms of its effect on GST, as
symbolized by GOVEXP, but also the total
population of a region. A large population living in
an area is expected to affect the potential for tax
revenues from GST by assuming that each
individual has a consumptive nature, so that buying
and selling transactions may increase. Because of
this, a population variable is used to identify this
factor. This variable was adapted from the study by
Grady (2009) on the impact of GST distribution in
Canada as seen from demographic factors including
population size.
In addition, the level of individual education is
also thought to have an effect on tax revenues. In
line with this view, Ibrahim (2013) used educational
variables as a control in his research into GST
practice in Malaysia. Thus, in this present research,
educational-level variables are adapted to analyze
the effect of education levels on individuals’
consumption patterns. In this study, the education of
individuals to a minimum of senior high school level
is symbolized by senior high school (SHS). As a
justification of this choice of variable, individuals
who have high school education in Indonesia tend to
have job opportunities which are better in terms of
income.
The final control variable is the trade sector of
the sectoral GDP of each province. Trading activity
has relevance for consumption activity, so this
variable is considered to be linked closely to the
potential for GST implementation.
In this research, the economic model used is
ordinary least square (OLS) regression estimation
with a panel data method. The analytical unit used is
the provincial level, to enable the analysis of the
magnitude of potential tax revenues in terms of the
GRDP of the various provinces. The reason this
model was chosen rather than other models is that it
can reduce the occurrence of different specific
province errors in each region for constant variables
over time, such as cultural and geographic factors.
This method is therefore able to describe variable
changes over time by minimizing error in estimating
the impact of independent variables on dependent
variables. In addition, the movement of continuous
variables can more easily be illustrated by using the
data panel method compared with, for instance, the
maximum likelihood method.
Regression is performed by setting a GST rate of
6%, based on the GST standard rate applied
worldwide. The determination of this GST rate is
based on international regulatory reviews and
scientific literature. Also, this study adds control
variables related to demographic and economic
factors and will compare the results of potential tax
revenue between GST and VAT in order to increase
tax revenue. The specification model to estimate the
potential of GST as follows:
SEABC 2018 - 4th Sriwijaya Economics, Accounting, and Business Conference
106
𝒍𝒏𝑮𝑺𝑻
𝒊𝒕
= 𝜷
𝟎
+ 𝜷
𝟏
𝒍𝒏𝑮𝑫𝑹𝑷
𝒊𝒕
+ 𝜷
𝟐
𝑪𝑷𝑰
𝒊𝒕
+ 𝜷
𝟑
𝑺𝑸𝑪𝑷𝑰
𝒊𝒕
+ 𝜷
𝟒
𝒍𝒏𝑮𝑶𝑽𝑬𝑿𝑷
𝒊𝒕
+ 𝜷
𝟓
𝒍𝒏𝑷𝑶𝑷
𝒊𝒕
+ 𝜷
𝟔
𝒍𝒏𝑺𝑯𝑺
𝒊𝒕
+ 𝜷
𝟕
𝒍𝒏𝑻𝑹𝑨𝑫𝑬
𝒊𝒕
+ 𝜺
𝒊𝒕
(4)
Equation 4 is log-log model indicator for each 1%
change in the independent variable to dependent
variables. It is used to examine the hypothesis
variables which reference GST revenue, and allows
for the possibility that those variables would affect
potential GST revenue. A classical assumption test
was conducted to evaluate whether the parameters
generated by the regression model derived from the
OLS method are best linear unbiased estimators.
Thus, the classical assumption test used covers three
aspects: multicollinearity, heteroscedasticity, and
autocorrelation.
4 RESULTS AND DISCUSSION
4.1 Descriptive analysis
In general, the percentage of the revenue potential of
GST in provinces in Indonesia increased from 2005
to 2015. The decrease seen in 2008 was due to the
global subprime mortgage crisis that hit the United
States, but in the following years, the potential GST
acceptance rate shows a positive trend. It can be
concluded that, in light of the pattern of increasing
consumption activities by both households and the
private sector in Indonesia, there is the potential
nationally for a positive response to the
implementation of GST-type taxation in the country.
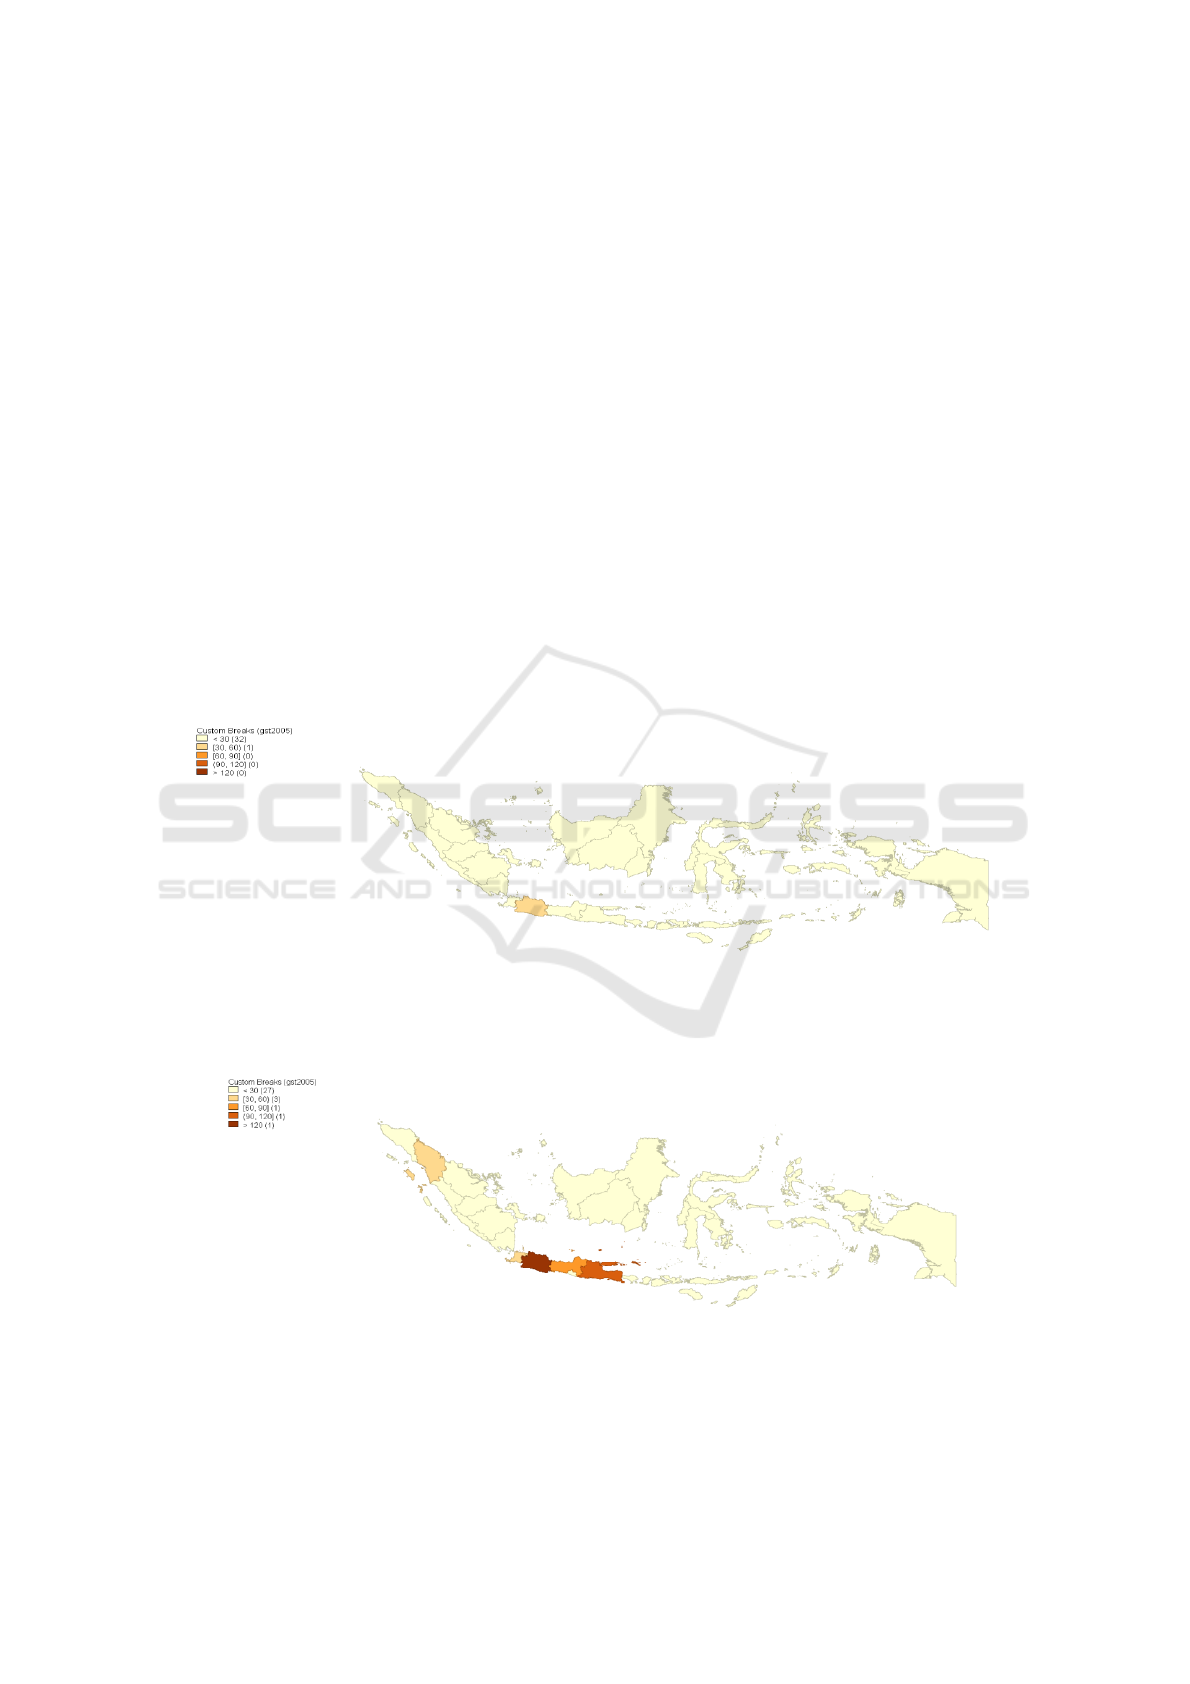
Figures 2 and 3 show the changes in the
potential distribution of GST in 33 provinces in
Indonesia for each year. In viewing this movement,
the authors only sampled for 2005 and 2015. To
achieve interprovincial equity, equitable distribution
of regional income is required.
Figure 2. Geographical distribution of potential GST tax revenues in 33 provinces in 2005
Source: Authors, from information from GEODA
Figure 3. Geographical distribution of potential GST tax revenues in 33 provinces in 2015
Source: Authors, from information from GEODA
Potential Implementation of Goods and Services Tax as a Substitute of Value Added Tax in Indonesia
107

Figures 2 and 3 show geographical locations if
GST is implemented at a regional level in Indonesia,
based on custom breaks. The use of custom breaks is
based on the classification of values within the
group (province) into five class intervals. The first
class contains areas that have potential GST revenue
of fewer than Rp30 trillion per year; the second
consists of regions with potential GST revenues of
between Rp31 and 60 trillion per year; the third is
regions with a potential GST revenue of Rp61 to 90
trillion per year; the fourth class interval contains
regions with potential tax revenue from GST of
Rp91 to 120 trillion and the final class interval
includes the regions with potential for annual GST
revenues of over Rp120 trillion.
In 2005, the highest GST revenue potential was
in West Java while the lowest was in Gorontalo, at
18.83% and 0.26% of total GST revenue potential
for the year, respectively. In this year, 97% of
provinces in all regions had a potential value of GST
revenues of less than Rp30 trillion. However, in
2015 there was a widening of distribution from
previously only the centralized West Java province.
There was an expansion of potential GST revenues
in other provinces, such as Banten, DKI Jakarta,
Central Java and East Java, with an average increase
of 54%. Although still concentrated in the island of
Java, there was an increase in GST acceptance
potential outside Java, although still in the same
interval class.
Furthermore, there was an increase in the
average potential GST acceptance nationally of
57.56%. Although still centered on the island of
Java, the study found interesting conditions occurred
in the province of North Sumatra that shows
significantly increased of GST revenue from 2005 to
2015. This condition is supported by the main
economic sector in the area, which is rich in natural
resources in the form of natural gas in the area of
Binjai and Langkat oilfields. Thus, the distribution
of potential GST revenues from 2005 to 2015 has a
positive trend, with a national average of Rp6 trillion
in 2005 increasing to Rp21 trillion per year by 2015.
Therefore, GST in Indonesia has the potential for
encouraging tax revenues in terms of both the ratio
of taxes and overall domestic revenues, as well as
contributing to the improvement of regional income
distribution.
4.2 Comparison of the strengths and
weaknesses of VAT and GST
Each type of tax has advantages and disadvantages,
both administratively and in practice. This
comparison aims to identify the efficiency and
welfare effects of the differences between the VAT
and GST. Table 1 presents a comparison of the
advantages and disadvantages of these two taxes.
Table 1. Comparison of the strengths and weaknesses of VAT and GST
TAX TYPE
STRENGTHS
WEAKNESSES
Value added
tax
(VAT)
Only taxed once, so there is no double
taxation
Uses a flat tax
Tax base is based on value added in
goods and services
VAT is charged on any transactions
involving the transfer of taxable goods or
taxable services in certain regions of the
country
VAT input and VAT output requirements
increase accounting cost
VAT is implemented at a central level
only, so there can be no fiscal
decentralization
Goods and
services tax
(GST)
An easier administrative system, thus
reducing tax avoidance and tax evasion
Reduces lost revenue opportunities by
tightening supervision at an early stage
in the production and distribution chain
There can be GST refunds for foreign
tourists
Minimizes economic distortion
The potential for double taxation
Reduces people’s incentives to consume
Source: (Le, 2003)
SEABC 2018 - 4th Sriwijaya Economics, Accounting, and Business Conference
108

4.3 Empirical results
Table 2 shows that, in general, each variable for
model 1, model 2, and model 3 has constant value
changes with varying significance levels of 1%, 5%
and 10%. In general, it can be concluded that every
major variable and control variable in the model has
been tested in accordance with the theory of
robustness with constant value changes and with
various control variables added. The best model is
model 2, which is the model with the main control
variable being the population having an education
level of at least SHS. This reflects the majority of
workers in Indonesia being SHS graduates. This
model has an adjusted R-squared value of 0.9520,
which means that the dependent variable in the
model can be explained by an independent variable
of 95.2%.
For variables related to wealth and income in the
regional economy, GRDP for all three models is
consistent, suggesting that the value of GRDP based
on expenditure has a positive correlation trend and is
significant for the percentage of potential GST. This
can be seen from the significance value of 5% for
the default. It can therefore be concluded that
increase in revenue of GRDP of 1% in an area will
increase the potential of GST acceptance by 5%,
ceteris paribus. This result is in accordance with the
theory that the greater the regional income, the
greater the tax revenue. In model 2, the percentage
of GRDP has the best level of significance, with a p-
value of 0.019 from adding a variable related to a
demographic factor, in this case, the education level
of its population.
For CPI and quadratic CPI (SQCPI) variables,
CPI has a positive and significant impact on the
percentage of potential GST revenues with a 99%
confidence interval. However, this impact does not
occur in long-term balance. It indicates that the
effect of GST on inflation shows that impacts occur
only at the time of the initial introduction of GST
and when it has just been implemented, ceteris
paribus. This is due to a small shock to the economy
and the unfamiliarity of the market with a new type
of taxation, known as transitional cost, which
increases the price of goods and services. For local
government expenditure variables (GOVEXP), it
can be seen that all three models show consistent
results suggesting that local government expenditure
has a positive and significant correlation with the
percentage of potential GST acceptance. This is in
line with Adolf Wagner's theory which states that
the greater the economic income of a country, the
greater the government spending to balance the
development of the state and the needs of society.
Table 2. Estimation Result for Fixed Effect Model of
potential GST Revenue
Variable
Model 1
Model 2
Model 3
lnGDRP
0.040**
(0.018)
0.033***
(0.018)
0.028
(0.019)
CPI
0.043***
(0.003)
0.043***
(0.003)
0.042***
(0.003)
SQCPI
-
0.000***
(0.000)
-
0.000***
(0.000)
-0.000***
(0.000)
lnGOVEXP
0.046**
(0.019)
0.039**
(0.019)
0.039**
(0.019)
lnPOP
0.710***
(0.043)
0.708***
(0.042)
0.708***
(0.042)
lnSHS
0.113***
(0.038)
0.113***
(0.038)
lnTRADE
0.040**
(0.023)
Prob>F
0.0000
0.0000
0.0000
N
363
363
363
Within R-
square
0.9553
0.9565
0.9569
Adjusted R-
square
0.9500
0.9510
0.9520
Note: *** Significant at 1% level; ** Significant at
the 5% level; * Significant at the 10% level
Source: Authors’ Calculation.
From Table 2, the results for model 1 indicate
that an increase in government spending of 1% will
lead to an increase in the potential of GST
acceptance of 0.046%, ceteris paribus. In addition, in
model 1, local government spending is also
significant and has a positive correlation trend with
the percentage potential for GST, in which the
coefficient value will be smaller with the increase in
control variables. This is in line with the theory that
revenues and expenditures have a cointegration
relationship with each other. Demographic-related
variables such as total population deliver constant
results with potentially positive relationships with a
potential percentage of GST acceptance. With a 99%
confidence level, the size of provincial populations
is significant for the increasing percentage of
potential GST acceptance. Therefore, in model 1,
ceteris paribus, for every 1% increase in provincial
population, the potential for GST acceptance will
increase by 0.710%.
In addition, models 2 and 3 show similar results,
with a significance level of 1%. Therefore, by
assuming that each individual engages in
consumption activity, this is consistent with the
Potential Implementation of Goods and Services Tax as a Substitute of Value Added Tax in Indonesia
109

theory that consumption is positively correlated
with implementation. Another demographic variable
is SHS education level, reflecting the level of
education of workers in Indonesia. The justification
of this variable is that people who have graduated
from high school have income to spend. This is
supported by statistics for workers in Indonesia
which show that the majority of workers are high-
school educated, and it can therefore be assumed
that they carry out consumption activities. In the
regression estimate, the SHS variable has a
potentially positive and significant relation at a 99%
confidence interval for potential GST acceptance in
provinces in Indonesia. It can therefore be said that
for every 1% increase in the population of high
school graduates, ceteris paribus, the potential of
GST acceptance will increase by 0.113%.
Meanwhile, the economic-sector-related
variables used as other controls are the trade sectors.
Table 2 shows that, with the entry of TRADE
variables, the value of GRDP becomes insignificant.
This is because this variable only includes trade
activities that are highly relevant to the imposition of
GST. GRDP covers not only consumption activities
but also other components, such as gross domestic
fixed capital formation and inventory changes that
are less relevant to GST. Consequently, the p-value
of GRDP decreases. Therefore, it can be interpreted
that for every increase in GDP of the trade sector by
1%, ceteris paribus, the potential of GST acceptance
will increase by 0.023%. Thus, it can be stated that
although each variable used has a different level of
significance, for GRDP in each province CPI and
quadratic CPI and government spending have met
the hypothesis proposed in this study.
Figure 4 describes the potential tax revenue of
GST and VAT for domestic product and GDP from
2005 to 2015. Using a GST tax rate of 6% (the
world standard), GST revenue potential in Indonesia
is almost twice as great as the tax revenue potential
for VAT at a 10% rate. If the government plans to
implement a GST with value of revenue equal to the
potential of VAT revenue as it has been
implemented thus far, it should charge a GST rate of
at least 5%. Thus, this difference of 1% is a revenue
advantage in the potential implementation of GST
rather than VAT. The world standard rate of 6% has
a larger revenue estimate with an upward trend each
year than the potential VAT revenue at the 10% rate
as currently applied. As a result, for a GST rate of
6%, the potential for receipts is the same as for
VAT at a 10% rate.
Figure 4. GST and VAT potential revenue ratio in terms of
domestic revenue and GDP 2005–2015
Overall, the study can assess feasibility based on
Stiglitz’s (2000) tax principles. One of the principles
focused on in this research is the comparative
efficiency of VAT and GST. This factor can be
determined from comparison of the value of the tax
revenue ratio for each, supported by empirical
analysis of the panel data regression between
regions. In summary, the estimated potential GST
revenue can be evaluated based on the Stiglitz’s
theory of tax principles as described above. Table 3
shows a comparison of VAT and GST for
descriptive and econometric analyses performed in
accordance with the taxation principles. In short,
GST-type tax has met the rules to be considered to
be a good tax policy.
Table 3. Evaluation framework for the Stiglitz taxation
principles for VAT and GST
Principle
VAT
GST
Efficiency
No
Yes
Administrative
simplicity
No
Yes
Flexibility
Yes
Yes
Political
responsibility
Yes
Yes
Fairness
Yes
Yes
5 CONCLUSION
This research proposes the use of a provincial
panel data method with an surcharge (opsen) system
as a new method to obtain best assignment rules for
the distribution of tax revenue collected to
strengthen fiscal capacity. Based on the analysis
from the OLS panel data model at a regional level,
GST can be seen to have a significant potential to
increase tax revenues. In summary, GST has
potential applicability in Indonesia, evident from the
ratio of GST revenue (as compared to that for VAT)
SEABC 2018 - 4th Sriwijaya Economics, Accounting, and Business Conference
110

of greater than 1, thus meeting the rules of Stiglitz's
theory. Furthermore, the potential GST revenue in
Indonesia is greater than the potential for VAT by an
average amount of Rp60 trillion each year. As a
result, greater efficiency is expected if GST is
implemented in Indonesia rather than the current
VAT regime. We were aware that this research has
some limitations. The variable used to describe
consumption level, in this case education level, was
not very specifically focused on describing
household expenditure levels.
Further research should improve on certain
aspects: first, it would be beneficial to conduct more
microlevel research to more accurately measure
consumer readiness, perceptions, and acceptance of
GST and to investigate how it would affect
household expenditure and income inequality and
poverty level; second, the research should measure
the role of regional government in supporting policy.
ACKNOWLEDGEMENT
Authors thank to Hibah PITTA Universitas
Indonesia for partly and financially support to
rewrite and publish the first author’s undergraduate
thesis that is submitted to Department of Economics,
Faculty of Economics and Business, Universitas
Indonesia. All remaining errors are our own.
REFERENCES
Grady, P. (2009). An analysis of the distributional impact
of goods and services tax. Munich PErsonal RePEc
Archive Paper, 13144. https://mpra.ub.uni-
muenchen.de/13144/1/MPRA_paper_13144.pdf
Ibrahim, M. R. (2013). The impact of goods and services
tax on middle-income earners in Malaysia.
International Journal of Economics Business and
Management Studies, 2(1), 12–19.
Jenkins, G., & Khadka, R. (1998). Tax reform in
Singapore. (Development Discussion Paper 644).
Harvard Institute for International Development.
http://jdintl.econ.queensu.ca/publications/qed_dp_129.
pdf
Le, T. M. (2003). Value-added taxation: Mechanism,
design, and policy issues. (World Bank course on
Practical Issues of Tax Policy in Developing
Countries). Washington DC.
http://siteresources.worldbank.org/INTTPA/Resources
/TuanPaper.pdf
Mansor, N. H. A., & Ilias, A. (2013). Goods and services
tax (GST): A new tax reform in Malaysia.
International Journal of Economics Business and
Management Studies, 2(1), 12–19.
Nurhidayati. (2013). Estimating elasticity and buoyancy of
Value Added Tax (VAT) in Indonesia: Aggregate and
Sectoral Basis Analysis Unplublished Tesis,
University of Indonesia.
Palil, M. R., & Ibrahim, M. A. (2011). The impacts of
goods and services tax (GST) on middle income
earners in Malaysia. World Review of Business
Research, 1(3), 192–206.
Ramesh, A. (2015). Gst in India - Challenges and
opportunities. Perquisa Journal, 1(1). Munich
Personal RePEc Archive Paper, 13144.
Rao, R. K., & Chakraborty, P. (2013). Revenue
Implications of GST and Estimation of Revenue
Neutral Rate: A State Wise Analysis. National Institute
of Public Finance and Policy, New Delhi.
Rosen, H. S., & Gayer, T. (2010). Public Finance (9th ed).
New York, NY: McGraw-Hill.
Stiglitz, J. E. (2000). Economics of the public sector (3rd
ed). New York, NY: W.W. Norton & Company.
Valadkhani, A. (2005). Goods and services tax effects on
goods and services included in the consumer price
index basket: Australia. The Economic Record, 81,
104–114.
WorldBank.. Tax Revenue (% of GDP). Retrieved from
http://databank.worldbank.org/data/reports.aspx?sourc
e=2&series=GC.TAX.TOTL.GD.ZS&country=IDN,
MYS,SGP,AUS,CAN#
Potential Implementation of Goods and Services Tax as a Substitute of Value Added Tax in Indonesia
111
