
MSI Analysis of a Roro Ferry Design
Ketut Suastika
1
, Heri Setyawan
1
, Dedi B. Purwanto
1
and Xuefeng Zhang
2
1
Department of Naval Architecture, Faculty of Marine Technology, Institut Teknologi Sepuluh Nopember (ITS),
Surabaya, Indonesia
2
School of Marine Science and Technology, Tianjin University, China
Keywords: Comfort Level, MSI Analysis, Relative Motion Spectrum, Roro Ferry, Vertical Acceleration.
Abstract: Crew and passengers’ comfort is one of the main objectives in the design of a ferry. A parameter quantifying
it is the so-called motion sickness incidence (MSI). In this study, the comfort level of a roro ferry design is
assessed for which the vessel’s vertical acceleration and the MSI were used as quantitative parameters. The
voyage area is the seas around Adaut, Saumlaki and Letwurung in the Eastern part of Indonesia. The response
characteristics of the vessel were calculated using a diffraction theory. The vertical acceleration and the MSI
were determined from the vessel’s relative motion. The predicted vertical acceleration is 1.18 m/s
2
or equal
to 0.12 g, where g is the gravitational acceleration. Although the vertical acceleration is 20% below the
maximum recommended one of 0.15 g, the discomfort level is, according to ISO 2631-1: 1997, classified as
uncomfortable. Furthermore, the predicted MSI is approximately 15%, which is larger than the maximum
recommended one of 10%. Further consideration of the design and/or operating location is recommended.
1 INTRODUCTION
Crew and passengers’ comfort is one of the main
objectives in the design of ferries. A parameter
quantifying it is the so-called motion sickness
incidence (MSI), which concept was first proposed by
O’Hanlon and McCauley (1974) in the early 1970s.
A definition of the MSI is as follows: the percentage
of passengers who vomit within an exposure time of
two hours. Improvement of comfort level and the
consequence reduction of MSI have always been
considered as the most important factors in the design
of passenger ships (Campana et al., 2009; Diez and
Peri, 2010).
Piscopo and Scamardella (2015) gives an
overview of the historical development of the concept
of MSI and the similar concept, called vomiting
incidence (VI), developed by Lawther and Griffin
(1987). The development started from a consideration
of a simple vertical sinusoidal motion (O’Hanlon and
McCauley, 1974) to irregular waves making an
arbitrary angle to a moving vehicle, including
population characteristics (age, gender). It turns out
that the vessel’s vertical acceleration dominantly
determines the motion sickness incidence (O’Hanlon
and McCauley, 1974; Lawther and Griffin, 1987;
ISO, 1997; Lloyd, 1998; Cepowski, 2012; Piscopo
and Scamardella, 2015).
The purpose of this study is to analyse a given
ferry design regarding its comfort level by estimating
the vessel’s vertical acceleration and the value of the
MSI, which are then compared with recommended
standard values. The analysis results can serve as
feedback to further consider the design and/or the
operating location of the ferry.
Furthermore, case studies of full-scale design in
which detail calculations of vertical acceleration and
MSI are discussed, are still lacking. The present
results can enrich the literature on MSI.
2 SHIP PARTICULARS AND
WAVE DATA
The ship particulars are summarized in Table 1. The
lines plan and general arrangement are shown in Figs.
1 and 2, respectively (Safiraa, 2017; Setyawan, 2018).
The intended operating location of the ferry is the
seas around Adaut, Saumlaki and Letwurung in the
Eastern part of Indonesia (see Figs. 3 and 4). The
representative significant wave height is 2.28 m and
the average zero up-crossing wave period is 5.95 s
Suastika, K., Setyawan, H., Purwanto, D. and Zhang, X.
MSI Analysis of a Roro Ferry Design.
DOI: 10.5220/0008374700710076
In Proceedings of the 6th International Seminar on Ocean and Coastal Engineering, Environmental and Natural Disaster Management (ISOCEEN 2018), pages 71-76
ISBN: 978-989-758-455-8
Copyright
c
2020 by SCITEPRESS – Science and Technology Publications, Lda. All rights reserved
71
(BMKG, 2018). The wave spectrum calculated using
the ITTC formulation (ITTC, 2002) is shown in Fig. 5.
Table 1: Ship Particulars.
Length overall 47.00 m
Length between perpendiculars 42.00 m
Breadth moulded 12.00 m
Depth 3.20 m
Draft 2.15 m
Volume of displacement 823.17 m
3
Service speed 12 knots
Crew 20 persons
Passenger 152 persons
Vehicle
12 trucks and 7
sedans
Main engine
2 x 800 HP
Heav
y
dut
y
Figure 1: Lines plan of the roro ferry.
Figure 2: General arrangement of the roro ferry.
Figure 3: A map showing Banda seas, Arafura seas and
Timor seas in the Eastern part of Indonesia in which Adaut,
Saumlaki and Letwurung are located (marked with a red
balloon).
Figure 4: The seas around Adaut, Saumlaki and Letwurung
(zoomed in from Fig. 3).
Figure 5: Representative wave spectrum for the seas around
Adaut, Saumlaki and Letwurung.
3 PROCEDURE FOR THE MSI
CALCULATION
A formula to calculate the MSI is given in Lloyd
(1998) as follows:
MSI 1000.5 erf
log
0.798
𝑚
4
𝑔𝜇
MSI
0.4
(1)
ISOCEEN 2018 - 6th International Seminar on Ocean and Coastal Engineering, Environmental and Natural Disaster Management
72
where the parameter μ
, according to O’Hanlon and
McCauley (1974), is given as
𝜇
MSI
0.654 3.697 log
1
2π
𝑚
4
𝑚
2
⁄
2.320log
1
2π
𝑚
4
𝑚
2
⁄
2
(2)
while according to Lloyd (1998) given as
𝜇
MSI
0.819 2.32 log
𝑚
4
𝑚
2
⁄
2
(3)
In Eqs. (1), (2) and (3), erf is the error function,
m
2
and m
4
are, respectively, the second and fourth
spectral moments of the relative motion spectrum [see
Eq. (11) below] and g is the gravitational
acceleration.
As has been stated earlier in the introduction, the
main contributor to MSI is the vessel’s vertical
acceleration. This manifests in Eq. (1) in which the
quantity
𝑚
4
represents a measure for the vessel’s
vertical acceleration.
Due to the ship speed and its relative direction to
the wave propagation direction, the wave frequency
is Doppler shifted, represented by the encounter wave
frequency as follows (Bhattacharyya, 1978):
ω
ω
ω
𝑉
𝑔
cos𝜇
(4)
(for deep water) where ω
e
is the encounter wave
frequency, ω
w
is the wave frequency relative to the
fixed bottom, g is the gravitational acceleration, V is
the ship speed and
is the wave heading (
= 90º for
beam seas and
= 180º for head seas).
Correspondingly, the encounter wave spectrum is
given as
𝑆
ω
𝑆
ω
1
1
4ω
𝑉
𝑔
cos𝜇
(5)
where S
(ω
e
) is the encounter wave spectrum and
S
(ω
w
) is the wave spectrum for zero-speed ship. In
this study, the wave headings considered are from
beam seas to head seas.
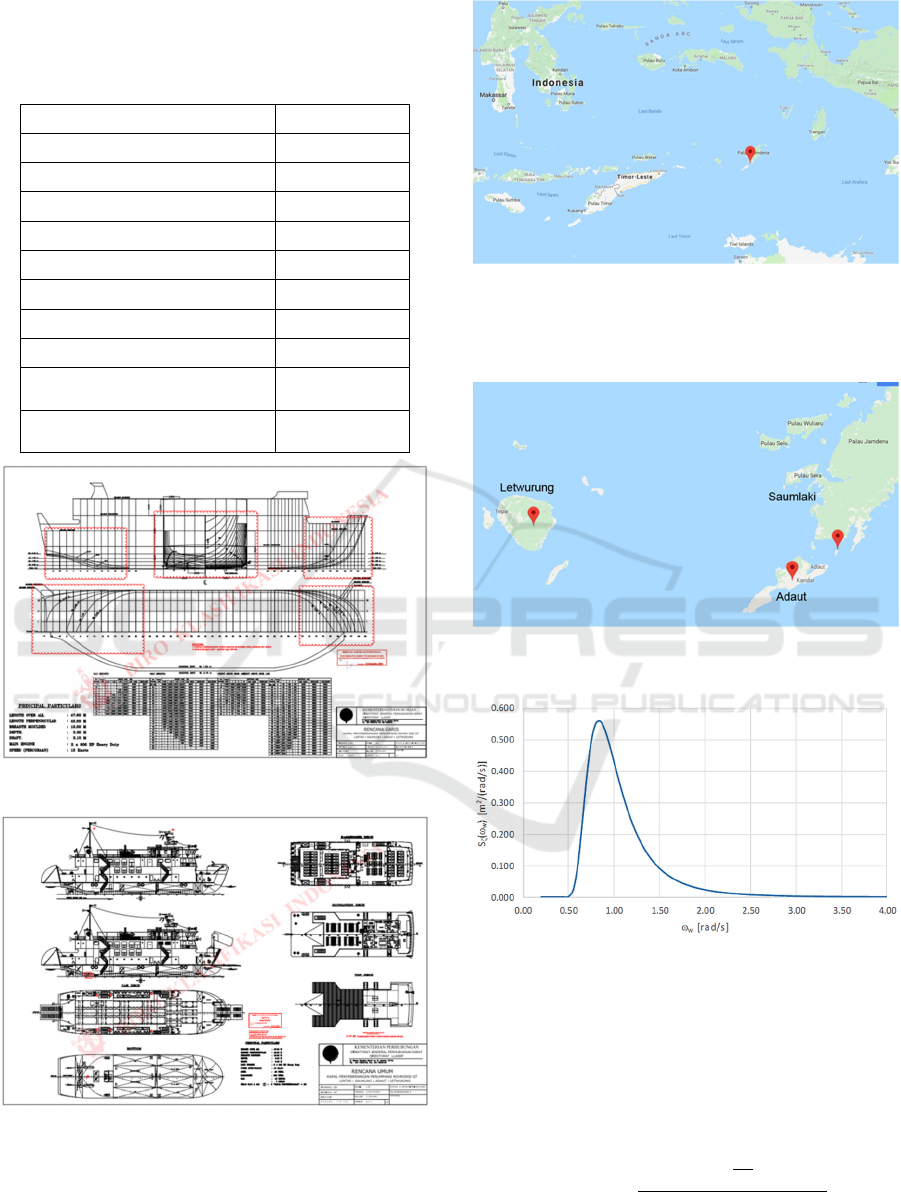
Figure 6 shows encounter wave spectra for 12
knots ship speed with 90º, 135º and 180º wave
headings. For
= 90º,
e
=
w
and S
(ω
e
) = S
(ω
w
),
as expected, because cos
= 0 in this case (cf. Fig.
5). As
increases from 90º to 180º, the spectral peak
decreases but the frequency range with significant
wave energy becomes wider. The areas under the
spectral energy curves remain constant, that is, the
energy content of the wave field remains unaltered.
Figure 6: Encounter wave spectra for 12 knots ship speed
with 90º, 135º and 180º wave headings.
The response characteristics of the vessel are
represented by the response amplitude operators
(RAO). Only the heave and pitch motions are
considered in the present study. The motion RAOs are
calculated using a diffraction theory (Newman,
1977).
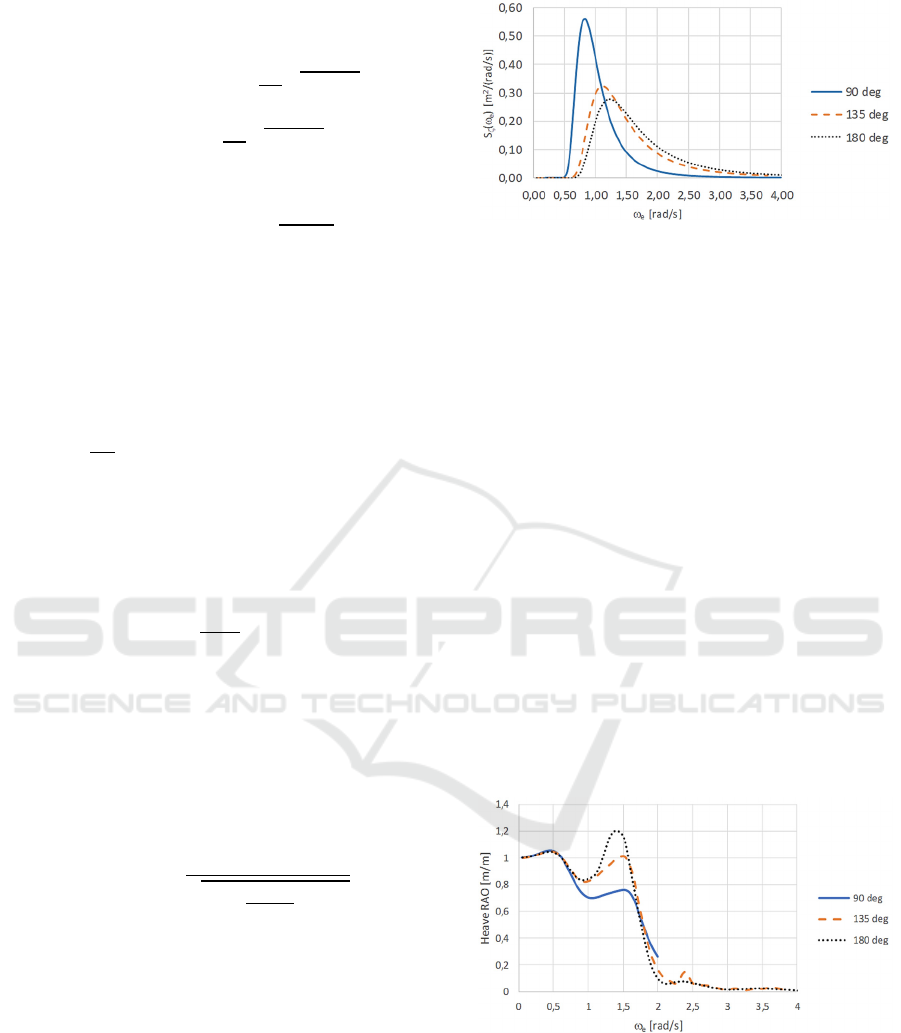
Figures 7 and 8 show the heave and pitch RAOs,
respectively, as function of encounter wave frequency
for 12 knots ship speed with 90º, 135º and 180º wave
headings. The wave heading
= 180º (head seas)
gives the largest heave and pitch responses, followed
by
= 135º and subsequently by
= 90º (beam seas).
Laying down Figs. 7 and 8 aside Fig. 6, it is
observed that a significant response of the ship for
= 135º and 180º occurs in the frequency range where
significant wave energy is present (0.8 <
e
< 1.8
rad/s). The heave RAO can reach approximately 1.2
m/m and the pitch RAO can reach 5º/m. Because of
the above situation, relatively large ship responses
can be expected, particularly for the condition of head
seas.
Figure 7: Heave RAOs for 12 knots ship speed with 90º,
135º and 180º wave headings.
MSI Analysis of a Roro Ferry Design
73
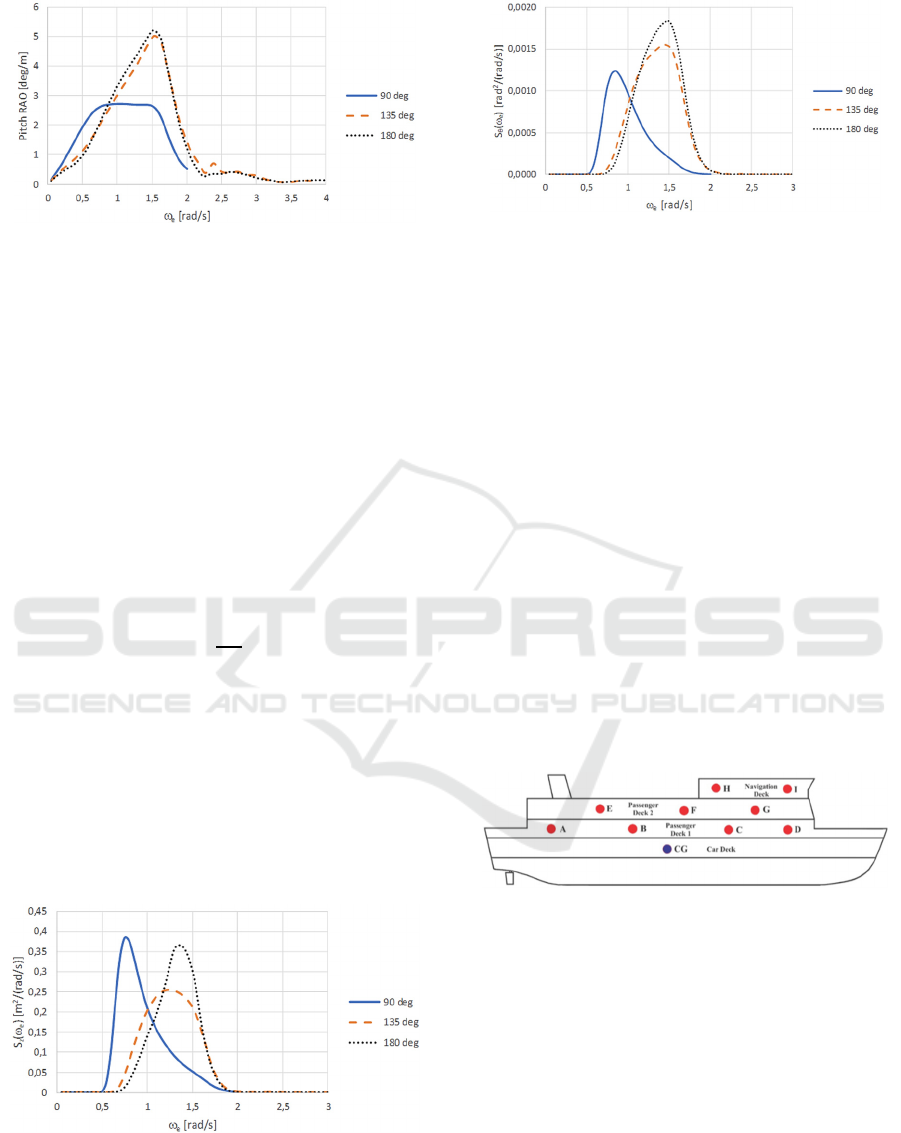
Figure 8: Pitch RAOs for 12 knots ship speed with 90º, 135º
and 180º wave headings.
In the following, all calculations are based on the
encounter wave frequency
e
. Utilizing the RAO and
the wave spectrum, the heave and pitch spectra of the
vessel can be calculated as follows (Bhattacharyya,
1978):
𝑆
ω
RAO
ω
2
𝑆
ω
(6)
where S
R
(
e
) is the response spectrum and S
(
e
) is
the wave spectrum. Figures 9 and 10 show the heave
and pitch spectra, respectively, for 12 knots ship
speed with 90º, 135º and 180º wave headings. The
significant response amplitude A
s
is used as a
parameter to characterize the motion spectra, which
is calculated as follows:
𝐴
2
𝑚
(7)
where m
0
is the area under the response spectrum.
Using Eq. (7), the significant heave amplitudes are,
respectively, 0.868, 0.877 and 0.897 m for
= 90º,
135º and 180º. Furthermore, the significant pitch
amplitudes are, respectively, 2.94º, 3.82º, and 3.96º
for
= 90º, 135º and 180º. The wave heading
= 180º
(head seas) gives the largest heave and pitch
responses, as expected (in view of the heave and pitch
RAOs described above).
Figure 9: Heave spectra for 12 knots ship speed with 90º,
135º and 180º wave headings.
Figure 10: Pitch spectra for 12 knots ship speed with 90º,
135º and 180º wave headings.
In the following, only results for wave heading
= 180º (head seas) are presented because it gives the
largest responses.
Utilizing the heave and pitch spectra, the relative
motion spectrum can be calculated from the following
relation (Bhattacharyya, 1978):
𝑆
ω
𝑆
ω
𝑥𝑆
ω
𝑆
ω
(8)
where S
s
(
e
) is the relative motion spectrum, S
z
(
e
)
the heave spectrum, S
(
e
) is the pitch spectrum,
S
(
e
) is the wave spectrum and x is the longitudinal
distance from the centre of gravity (CG) to the point
under consideration. The longitudinal centre of
gravity (LCG) of the ferry is 18.51 m measured from
the aft perpendicular. Its vertical distance from the
base line (VCG) is 2.15 m. Notice in Figs. 9 and 10
that for
e
> 2.0 rad/s, both S
z
(
e
) and S
(
e
) tend to
zero. So, Eq. (8) becomes S
s
(
e
) = -S
(
e
) for
e
> 2.0
rad/s. This observation will be used to check the
resulting relative motion spectrum.
Figure 11: Locations within the ship where the relative
motion, the vertical acceleration and the MSI are calculated,
denoted by points A, B, … I.
Some locations have been chosen within the ship
where the relative motion, the vertical acceleration
and the MSI are calculated (see Fig. 11). For example,
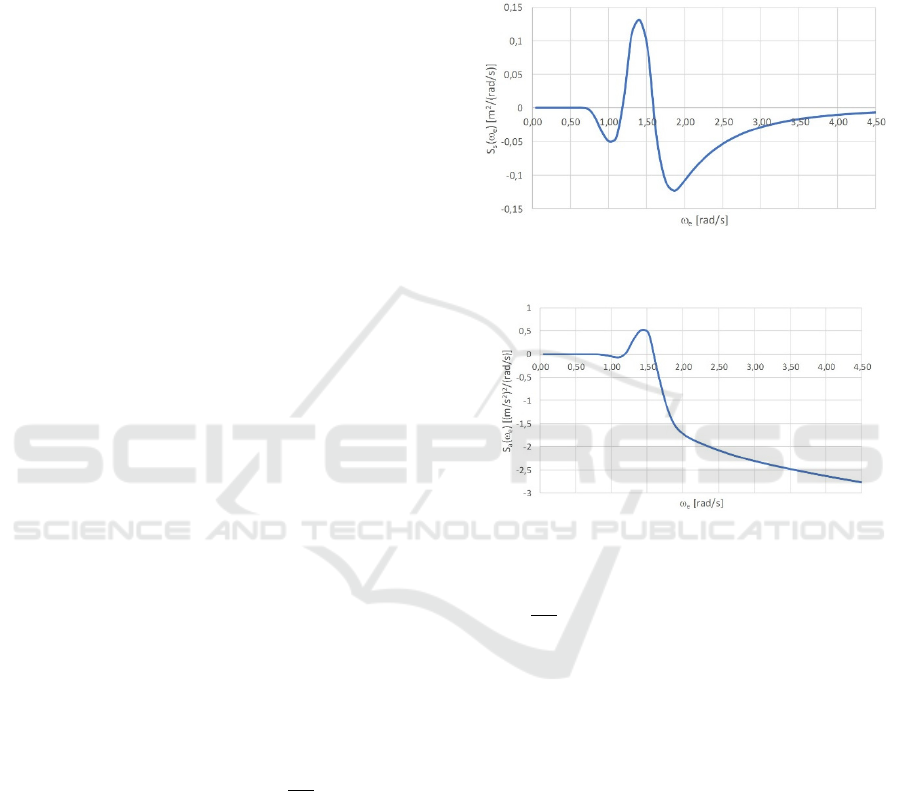
Fig. 12 shows the relative motion spectrum at point I
(front navigation deck). The relative motion spectrum
can take negative and positive values. Looking at
Figs. 12 and 6, it is observed that S
s
(
e
) = -S
(
e
) for
e
> 2.0 rad/s, as has been anticipated.
Based on the relative motion spectrum, the
velocity spectrum and the acceleration spectrum can
be calculated as follows:
ISOCEEN 2018 - 6th International Seminar on Ocean and Coastal Engineering, Environmental and Natural Disaster Management
74
𝑆
ω
ω
𝑆
ω
(9)
𝑆
ω
ω
𝑆
ω
(10)
where S
v
(
e
) is the velocity spectrum and S
a
(
e
) is the
acceleration spectrum. Figure 13 shows the
acceleration spectrum at point I for 12 knots ship
speed in head seas, calculated using Eq. (10). The
values of the acceleration spectrum at relatively high
frequencies become dominated by the factor ω
. For
example, at
e
= 4.5 rad/s, the (absolute) value of the
motion spectrum is much smaller than the peak value
(Fig. 12) but the (absolute) value of the acceleration
spectrum at this frequency takes the largest value (a
global maximum) due to the factor ω
. This value
may not be reliable. Therefore, care should be taken
in interpreting the acceleration spectrum.
Furthermore, at
e
= 3.0 rad/s, the value of the wave
spectrum is approximately 10% of the peak value
(Fig. 6 for
= 180º) and the values of the heave and
pitch spectra are approximately zero for
e
> 2.0 rad/s
(Figs. 9 and 10). Therefore, for the calculation of the
significant amplitude of the acceleration, the
acceleration spectrum will be truncated at
e
= 3.0
rad/s, that is, the spectral values for
e
> 3.0 rad/s will
be neglected.
To calculate the significant amplitudes of the
velocity and acceleration, it is common to define a
spectral moment m
n
as follows:
𝑚
ω
𝑆
ω
dω
,𝑛0,1,2…
(11)
Using the definition in Eq. (11), m
0
is the area
under the relative motion spectrum (in m
2
), m
2
is the
area under the relative velocity spectrum (in m
2
/s
2
)
and m
4
is the area under the acceleration spectrum (in
m
2
/s
4
). The significant amplitude of the vertical
acceleration is required for the calculation of the MSI
and to determine the discomfort level of the ferry. In
Eq. (1), the significant amplitude of the vertical
acceleration is calculated as 0.798
√
𝑚
.
4 RESULTS AND DISCUSSION
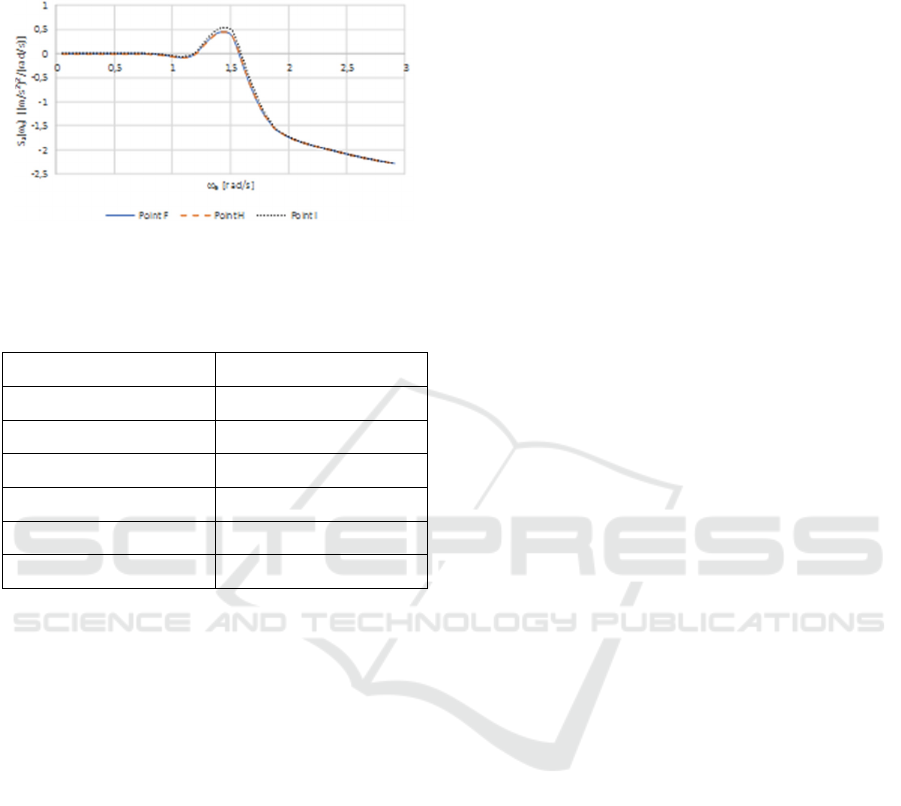
Figure 14 shows the vertical acceleration spectra at
points F (1.0 m fore CG), H (2.0 m fore CG) and I
(12.0 m fore CG) for 12 knots ship speed in head seas
(truncated at
e
= 3.0 rad/s). As shown in Fig. 14, the
three curves almost coincide. This observation holds
also for all other points shown in Fig. 11. This
indicates that the longitudinal distance x from the
point under consideration to CG [or the second term
in the r.h.s. of Eq. (8)] does not contribute
significantly to the resulting motion spectrum
(acceleration spectrum). In other words, the pitch
response plays a minor role compared to the heave
response in determining the relative motion (vertical
acceleration) of the vessel.
Figure 12: Relative motion spectrum at point I for 12 knots
ship speed in head seas.
Figure 13: Vertical acceleration spectrum at point I for 12
knots ship speed in head seas.
The acceleration amplitude calculated as
0.798
√
𝑚
is approximately 1.18 m/s
2
or equal to 0.12
g, where g is the gravitational acceleration. The
recommended maximum vertical acceleration is 0.15
g (Bhattacharyya, 1978). Although the predicted
vertical acceleration is 20% below the recommended
maximum value of 0.15 g, the discomfort level is,
according to ISO 2631-1: 1997 [see Table 2],
classified as uncomfortable.
The MSI calculated from Eqs. (1) and (2) is
14.63% and that calculated from Eqs. (1) and (3) is
14.51%. They are close to each other, which can be
rounded to 15%. The predicted MSI of 15% is larger
than the maximum recommended one of 10% (ISO,
1997; Kivimaa et al., 2014).
Based on the predicted vertical acceleration and
the MSI, it is recommended to further consider the
present design to make the vessel more comfortable
for crew and passengers if the ferry is to be operated
in the seas around Adaut, Saumlaki and Letwurung.
Another option is, if modifications are difficult to
MSI Analysis of a Roro Ferry Design
75
achieve, the ferry should be operated in other
locations where the wave condition is more
favourable.
Figure 14: Vertical acceleration spectra at points F (1.0 m
fore CG), H (2.0 m fore CG) and I (12.0 m fore CG) for 12
knots ship speed in head waves (truncated at
e
= 3.0 rad/s).
Table 2: Classification of discomfort level (ISO, 1997).
Habitability Acceleration Discomfort Response
< 0,315 m/s
2
Not uncomfortable
0,315 – 0,63 m/s
2
A little uncomfortable
0,5 – 1 m/s
2
Fairly uncomfortable
0,8 – 1,6 m/s
2
Uncomfortable
1,25 – 2,5 m/s
2
Very uncomfortable
> 2 m/s
2
Extremely uncomfortable
5 CONCLUSIONS
The comfort level for crew and passengers of a ferry
design was analysed for which the vessel’s vertical
acceleration and the MSI were estimated using a
standard procedure. The predicted vertical
acceleration is 1.18 m/s
2
or equal to 0.12 g, where g
is the gravitational acceleration. Although the
vessel’s vertical acceleration is 20% below the
maximum recommended one of 0.15 g, the
discomfort level is, according to ISO 2631-1: 1997,
classified as uncomfortable. Furthermore, the
predicted MSI is approximately 15%, which is larger
than the maximum recommended one of 10%. It is
recommended to further consider the present design
to make the vessel more comfortable for crew and
passengers if the ferry is to be operated in the seas
around Adaut, Saumlaki and Letwurung in the
Eastern part of Indonesia. If modifications of the
design are difficult to achieve, then the ferry should
be operated in other locations where the wave
condition is more favourable.
ACKNOWLEDGEMENTS
Ketut Suastika was a visiting researcher at the School
of Marine Science and Technology, Tianjin
University, China, in the period from October 10th,
2018 to January 7th, 2019 where parts of the present
study were carried out. He thanks the School of
Marine Science and Technology, Tianjin University,
China, for the opportunity having been provided.
REFERENCES
A. Lawther, M. J. Griffin, 1987. Prediction of the incidence
of motion sickness from the magnitude, frequency and
duration of vertical oscillation, J. Acoustical Soc.
America 82 (3), pp. 957-966.
A. R. J. M. Lloyd, 1998. Seakeeping: Ship behaviour in
rough water, Ellis Horwood Ltd.
BMKG, 2018. Indonesian Agency for Meteorology,
Climatology and Geophysics.
D. Safiraa, 2017. Undergraduate Thesis (in Indonesian),
Department of Naval Architecture, Faculty of Marine
Technology, ITS Surabaya, Indonesia.
E. F. Campana, G. Liuzzi, S. Lucidi, D. Peri, V. Piccialli,
A. Pinto, 2009. New global optimization methods for
ship design problems, Optimization Engrg. 10 (4), pp.
533-555.
H. Setyawan, 2018. Undergraduate Thesis (in Indonesian),
Department of Naval Architecture, Faculty of Marine
Technology, ITS Surabaya, Indonesia.
ISO, 1997. Mechanical vibration and shock-Evaluation of
human exposure to whole-body vibration-Part 1:
General requirements, Int’l. Organization
Standardization.
ITTC, 2002. Proc. 23rd Int’l Towing Tank Conf.
J. F. O’Hanlon, M. E. McCauley, 1974. Motion sickness
incidence as a function of the frequency and
acceleration of vertical sinusoidal motion, Aerospace
Medicine 45 (4), pp. 366-369.
J. N. Newman, 1977. Marine hydrodynamics, The MIT Press.
M. Diez, D. Peri, 2010. Robust optimization for ship
conceptual design, Ocean Engrg. 37 (11-12), pp 966-
977.
R. Bhattacharyya, 1978. Dynamics of marine vehicles,
Wiley.
S. Kivimaa, A. Rantanen, T. Nyman, D. Owen, T. Garner,
B. Davies, 2014. Ship motions, vibration and noise
influence on crew performance and well-being studies
in FAROS project, Transport Research Arena (TRA)
5th Conf.: Transport Solutions from Research to
Deployment, Paris.
T. Cepowski, 2012. The prediction of the motion sickness
incidence index at the initial design stage, Zeszyty
Naukowe 31 (103), pp. 45-48.
V. Piscopo, A. Scamardella, 2015. The overall motion
sickness incidence applied to catamarans, J. Nav.
Archit. Ocean Engrg. 7, pp. 655-669
ISOCEEN 2018 - 6th International Seminar on Ocean and Coastal Engineering, Environmental and Natural Disaster Management
76
