
Flow Pattern in the Port of Kalbut Situbondo
Shintya Rani, Engki A. Kisnarti and Rahyono
Hang Tuah University, Surabaya, Indonesia
Keywords: The Flow Pattern, Port of Kalbut Situbondo.
Abstract: One of the important reviews in port development is a current. The pattern and velocity of the current
greatly affect the movement of the ship, so this research is needed to know the pattern and speed of the
current at port of Kalbut Situbondo. The data used in this research are bathymetry, tidal, wind, and current.
Bathymetry, tidal, and wind data are processed using hydrodynamic modules. Based on the simulation
results the current pattern can be predicted that at high tide, the current flows from the Northeast to the
Southwest with a starting speed of 0.05 m/s up to 0.45 m/s. The current velocity at low tide is 0.05 m/s to
0.15 m/s which is flows from Southwest to Northeast.
1 INTRODUCTION
The Port of Kalbut Situbondo is a regional feeder
port whose main function is to serve the domestic
sea transport activities, the restructuring of domestic
sea transport in limited quantities, feeder for the
main port and gathering port, and as the place of
origin of passenger and goods destinations, and the
ferry transportation with service range within the
province. Site selection to build ports should take
into account the factors of the ocean and land
(Syaefudin, 2008). The flow review in the port
development plan is very important, as the current
determines how much sedimentation can occur at the
port.
The current is the movement of a mass of water
from one place to another caused by wind blowing
or caused by tidal movement of sea water (Nontji,
1993). The movement of water masses is caused by
three factors: wind, tidal currents, and turbulence
(Pond and Pickard, 1983). The currents can also be
formed by winds blowing in very long periods of
time, can also be caused by the waves that hit the
beach at an angle (Loupatty, 2013). It can also be
caused by waves formed from waves coming into
the shoreline, thus there will be two current systems
that dominate seawater movement i.e. rip current
and longshore current. The purpose of this research
is to know and analyze the direction and speed of
current in The Port of Kalbut Situbondo.
2 METHODS
This research was started from January to July 2017
and took place in Kalbut Harbor Waters located in
Semiring Village, Mangaran Subdistrict, Situbondo
District, East Java Province. Situbondo district is
adjacent to Madura Strait in the north, Border with
Bali Strait in the east, District of Bondowoso and
Banyuwangi in the south, District of Probolinggo in
the west (http://situbondokab.go.id). Geographically,
Kalbut Port is located at coordinates 07 ° 37'30 ° S
and 114 ° 01'00 ° E. The location of the study is
shown in Figure 1:
Figure 1: Research location at Port of Kalbut Situbondo.
38
Rani, S., Kisnarti, E. and Rahyono, .
Flow Pattern in the Port of Kalbut Situbondo.
DOI: 10.5220/0008373400380042
In Proceedings of the 6th International Seminar on Ocean and Coastal Engineering, Environmental and Natural Disaster Management (ISOCEEN 2018), pages 38-42
ISBN: 978-989-758-455-8
Copyright
c
2020 by SCITEPRESS – Science and Technology Publications, Lda. All rights reserved
The materials required in this study are
bathymetry data obtained from the Pusat Hidro
Oseanografi TNI-AL (Pushidrosal), tidal data
obtained from field observations using tidal palms,
five years of wind data obtained from Badan
Meteorologi Klimatologi dan Geofisika (BMKG).
Current data obtained from field observations using
current meters at depth of 0.2d, 0.6d, 0.8d.
Equipment needed to assist data processing in order
to obtain the results of current patterns in the waters
of Kalbut Port Situbondo using hydrodynamic
module program.
The implementation of this research is divided
into two stages, the first stage is the data collection
bathimetri, tides, winds, waves, currents and
sediments and then proceed with data processing and
data analysis. The first step is to digitize the
bathymetry map to get the depth contour. Tidal data
is processed using Admiralty method to obtain tidal
harmonic constants (Fikri, et.al, 2013). Wind data as
a wave generator is used to determine the direction,
height, and significant period, while the current data
is processed to determine the current velocity as the
validation of the model results. The results of tidal,
bathymetric, and wind data processing as inputs to
create a simulation in hydrodynamic module
(Oktiarini, 2015) which will produce simulation in
the form of pattern and current velocity.
3 RESULTS
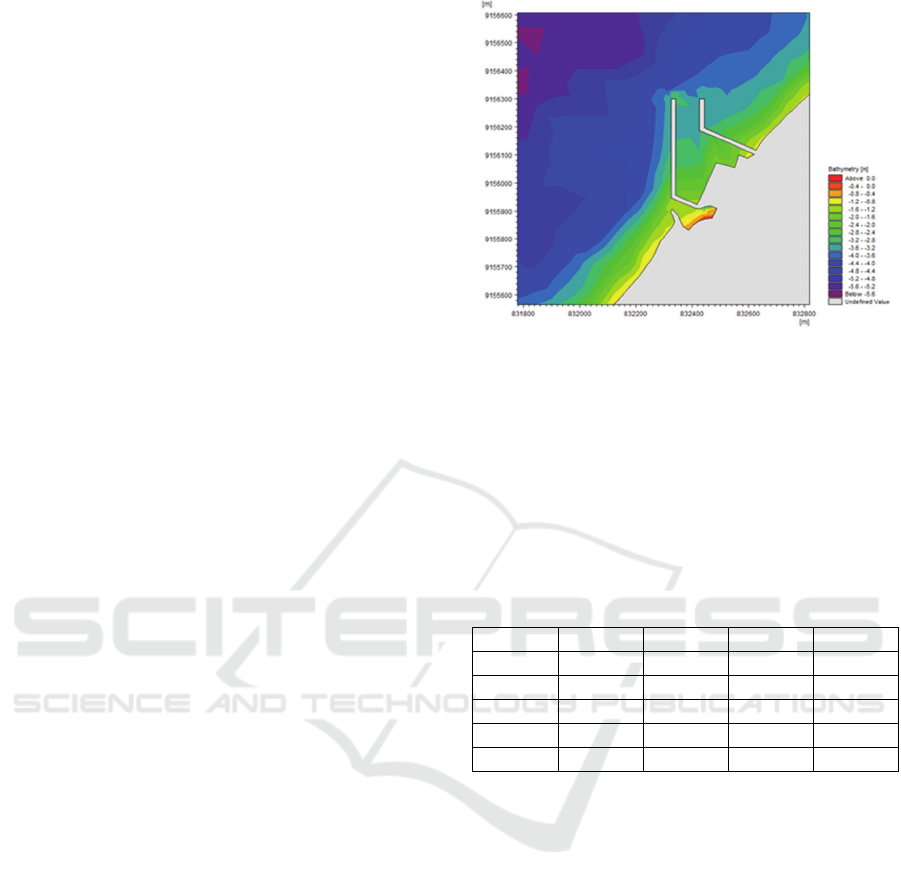
3.1 Bathymetry
The depth of Kalbut Waters Situbondo ranged from
2-5.2 meters indicated by the gradation of dark orange
to purple. The depth of the water in the pond is about
2-2.4, while slightly in front of the pond water depth
ranging from 2.8-4 meters. The average slope of the
topography of this area is 0.02 ° or 1:42. Based on
Verstappen which refers to the United State Soil
System Management (USSSM) and Universal Soil
Loss Equation (USLE), a slope of less than 1 ° is
included in the almost flat category (Verstappen,
1953). The bathymetry profile of The Port of Kalbut
waters region as shown in Figure 2.
Figure 2: Bathimetry of The Port of Kalbut Situbondo.
3.2 Tidal
The observed data obtained were calculated using
the admiralty method to find the tidal harmonic
constant. The harmonic constant will be used to
process time series data that will be input into the
hydrodynamic module. The harmonic constants are
as shown in Table 1:
Table 1: Constant tidal harmonics.
S
o
M
2
S
2
N
2
K
1
128 38 2 55 22
347 20 112 112
O
1
M
4
MS
4
K
2
P
1
16 1 2 0.4 7
296 91 282 20 112
The values of the constants M2, S2, O1 and K1
have relatively larger values than the other constant
values because they are the major constants in the
tides used as determinants of the type of tides. M2 is
a constant influenced by the moon, O1 is a constant
influenced by the declaration of the moon, K1 is a
constant influenced by moon and sun declination,
whereas S1 is a constant influenced by the sun.
Among the four constants M2 and O1 values are
relatively larger than K1 and S2, this indicates that
the moon has a greater influence than the influence
of the sun in the up and down movement of water in
Kalbut Situbondo waters. Rthe tides are influenced
by the gravitational pull of celestial bodies,
especially the moon and the sun, because the
position of the moon closer to the earth, the gravity
of the earth is stronger so that its influence on tidal
fluctuations is also more Great than the sun
(Pariwono, 1989). The value of Fromzahl in these
waters is 0.97 which indicates that this type of tidal
Flow Pattern in the Port of Kalbut Situbondo
39
in these waters is a mixture of double daily skew
that occurs twice and twice a day at low tide but
occasionally occurs once and once the high tide has
high and time different.
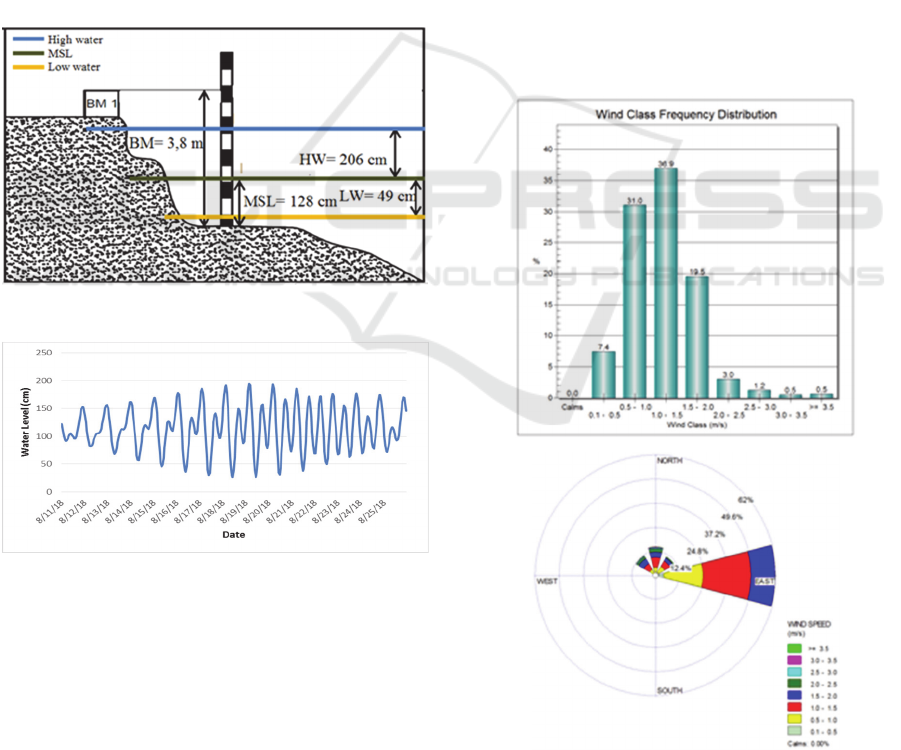
The mean sea level (MSL) value of the waters is
128 cm from the zero point of the known tidal signs
of the constant value in Table 4.1 above in column
S0. After knowing harmonic constants, then can be
calculated face of low or low water and high water
that happened in those waters. The high water (HW)
that occurs in the area is 206 cm above the middle
seat or MSL, while the low water value (LW) in the
region is 49 cm below the middle seat or MSL. At
the time of tidal measurement there should be a
benchmark that serves as a bounding point of
measurement. The height of the benchmark for this
tidal measurement is 380 cm from the point of zero
tide sign. Tidal profile can be seen in Figure 3 and
Figure 4.
Figure 3: Benchmark profile of tidal signs.
Figure 4: Tidal fluctuation.
The tide is closely related to bathymetry, low
water or so-called Z0 is the zero point of the map in
the bathymetry map. Z0 serves as a zero in the
bathymetry, meaning that the entire depth of the
waters is measured from Z0 not from the bottom of
the waters. This is done for the sake of safety of
shipping. In the bathymetry field measurement
results are also required correction of the tides to be
able to know the actual depth before it is affected by
the tidal and low tide conditions. In the next stage,
this tidal data will be used as input in the program to
be able to know the current pattern and the
sedimentation that occurred. Tidal data will be
processed in the form of time series which is then
stored with a separate file form to later be used as
input material on the hydrodynamic module.
3.3 Wind and Wave
Wind data obtained made a form of wind rose to
determine the direction of wind movement, speed,
and frequency of wind movement. Wind that has
been processed into a form of wind rose indicates
that the first dominant wind direction comes from
the East with a frequency of 62%, the second
dominant wind comes from the North with a
frequency of 15%, the third dominant wind from the
North West with a frequency of 11%, and the fourth
dominant wind comes from the Northeast with a
frequency of 11%. The frequency distribution and
the result of wind roses can be seen in Figure 5.
Figure 5: Frequency of wind.
ISOCEEN 2018 - 6th International Seminar on Ocean and Coastal Engineering, Environmental and Natural Disaster Management
40
The dominant velocity of all dominant directions
is 1-1.5 m / s indicated by the red color then the
second dominant velocity is 0.5-1 m / s indicated by
the yellow color. These two dominant velocities are
highly visible in the first dominant wind direction
originating from the East. In the area of the water
visible speed 1-1.5 m / s is indicated by the red
frequency greater. The third dominant velocity of
1.5 - 2 m / s is indicated by the blue color. The
dominant speed is applicable in all dominant wind
directions. Based on the wind data can be
forecasting the wave to determine the significant
height (Hs) and significant period (Ts) of the wave.
The winds are sorted into significant winds corrected
to determine the wind above sea level (Uw) which
has a value of 5.25. Then from the value of Uw is
known value of wind voltage factor (UA) is 5.45. To
find out Hs and Ts have to know the fetch value as
presented in Table 4.2 and Figure 4.7 which yields a
fetch value of 98.2. Based on the value of UA and
fetch it can be known the value of Hs and Ts using
nomogram graph in Figure 2.6. Kalbut Waters Port
Situbondo has a Hs value of 0.7 m with a value of Ts
4.5 seconds.
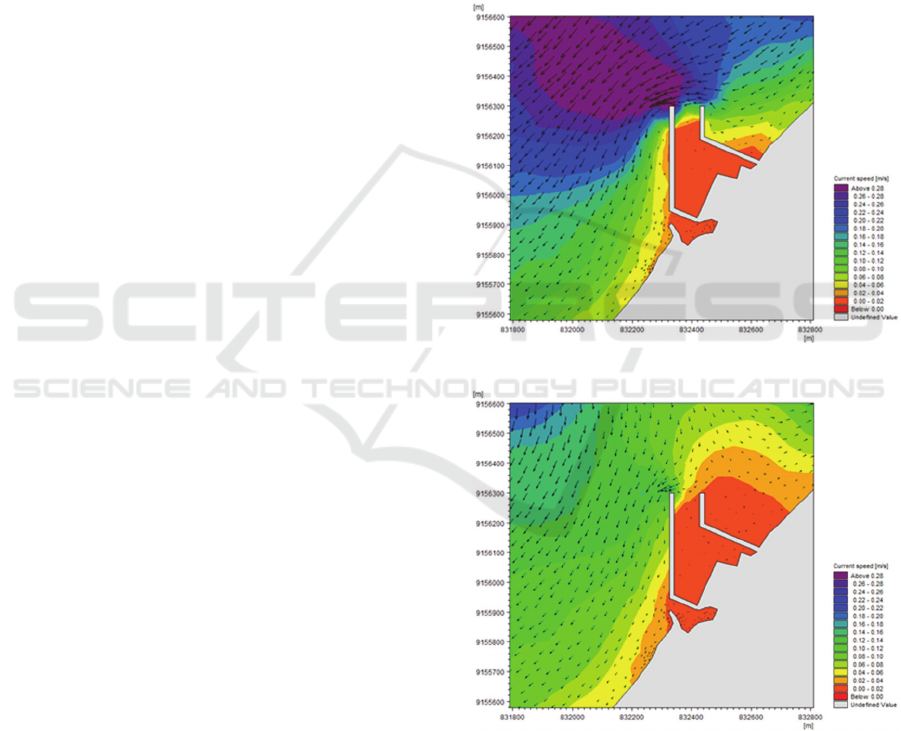
3.4 Current
The pattern of current distribution in The Port of
Kalbut Situbondo when the tide flows from the
North to Northeast and Southwest with a speed of
0.02 - 0.28 m / s. The current velocity outside the
port gradually increases until the highest maximum
speed of 0.28 m / s reaches the front of the left jetty
mouth marked in red. There are two patterns of
distribution, some of the currents flowing from the
Northeast flow directly to the Southwest. The
second pattern is the current from the North, the
current flows towards the coast then the current
turns to two different directions ie to the Northeast
and Southwest. This is due to the current flowing
toward the coast obstructed by the rising coastal
topography so that the current is turned in two
different directions.
The current in the pond is relatively quiet with a
range of 0.02-0.04 m / s as it is protected by the
jetty. Current velocity at high tide is shown in Figure
6. At low tide (Figure 7) the current velocity in The
Port of Kalbut Situbondo ranges from 0.02-0.2 m / s
marked by blue to light green. The current pattern at
low tide flows from the Southwest to the Northeast,
increasingly to the Northeast increasing relative
speed which is characterized by the green color in
the Northeast. In the mouth of the jetty to the left
also occurs the addition of current velocity caused
by the jetty turns.
The difference in current velocity at both high
and low tides can be caused by different depths. The
current will be faster when the depth is increased, it
is also clearly indicated by the current at the next
tide on the right and left of the jetty. The current
velocity inside a very small port can be caused by
two things, the first being a jetty that deflects the
current coming from the North East so as not to
enter the harbor area, the second being the depth
towards the shallower shore, hampering the
movement of the current.
(a)
(b)
Figure 6: (a) Current pattern at high tide; (B) the current
pattern towards the pairs.
Flow Pattern in the Port of Kalbut Situbondo
41
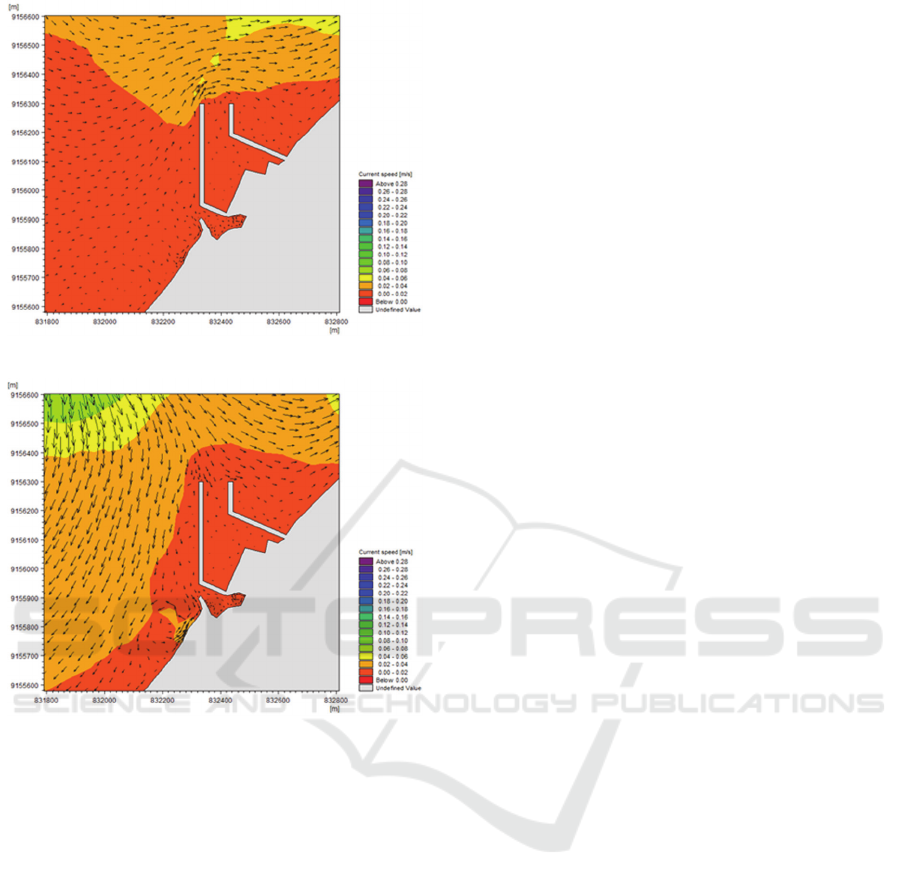
(a)
(b)
Figure 7: (a) Current pattern at low tide; (b) the pattern of
the current toward receding.
The existence of two different patterns in tidal or
low tide conditions in a day due to the type of tidal
that occurs in this area of water is a mixture of
double daily skew. At a time when the currents
originating from the North usually occur at the turn
of the transit. At when the maximum tide, the
current flows from the Northeast with a long time
span, then becomes receded and the direction of
change in flow from the southwest, the decrease in
speed occurs briefly. At the time of re-currents
flowing from the North to the mainland and in the
two-way northeast of Northeast and Southwest, after
that become receded with the same direction of flow
until completely in real receding condition with the
current pattern flowing from the Southwest toward
Northeast with a long time.
4 CONCLUSIONS
There are two patterns of current in the waters of the
Port of Kalbut Situbondo that is the current flowing
from the Northeast to the Southwest at high tide and
at low tide flowing from the Southwest to the
Northeast. At the time of the transition when
heading to high tide or to the low tide, current flows
from the north to the beach and diverted to the
Northeast and Southwest. The mean current velocity
within the port area is 0.02-0.04 m / s.
REFERENCES
Fikri. I. A., 2013. Purwanto. Hariadi. Studi Pola Transpor
Sedimen di Perairan Pelabuhan Tanjung Adikarta
Pantai Gelagah, Yogyakarta. Jurnal Oseanografi. 2
No.2:171-178.
Loupatty, G., 2013. Karakteristik Energi Gelombang dan
Arus Perairan Di Provinsi Maluku. Jurnal Barekeng. 7
No.1: 19-22.
Nontji, 1993. A. Laut Nusantara. Djambatan.
Oktiarini. D., Atmojo. W., dan Widada, 2015. S. Transpor
sedimen di Lokasi Perencanaan Pembangunan
Pelabuhan Marunda, Jakarta Utara. Jurnal
Oseanografi. Vol.4 No. :325-332.
Pariwono, 1989. J. I. Gaya Penggerak Pasang Surut.
Dalam Pasang Surut. Ed. Ongkosongo, O.S.R. dan
Suyarso. P3O-LIPI. Jakarta. Hal. 13-23.
Pond, S dan G. L Pickard, 1983. Introducy Dynamical
Oceanography. 2nd Edition.
Syaefudin. 2008. Studi Pemilihan Lokasi Alternatif
Pelabuhan Trisakti Banjarmasin Propinsi Kalimantan
Selatan. Jurnal Hidrosfir Indonesia. ISSN: 1907-1043.
3 No.3:113-122.
Verstappen, H. Th, 1953. Applied Geomorphology,
Geomorphological Surveys for Environmental
Development, Elsivier, Amsterdam.
ISOCEEN 2018 - 6th International Seminar on Ocean and Coastal Engineering, Environmental and Natural Disaster Management
42
