
Changes of Coastlines Caused by Abration using Multitemporal
Satellite Images: Case Study - Coastal of Gianyar District, Bali
Teguh Hariyanto
1
, Cherie Bhekti Pribadi
1
, Akbar Kurniawan
1
and Mutia Kamalia Muktar
1
1
Geomatics Engineering Department, Faculty of Civil, Environment, and Geo Engineering, Institut Teknologi Sepuluh
Nopember Surabaya Indonesia
Keywords: Coastlines, Multitemporal Satelite Images, Gianyar, Bali
Abstract: The beach was a transitional area between land and sea. In Gianyar Regency, Bali stretches the sea along the
southern island of Bali which is an area that is directly adjacent to the coastal area. Of course, this is
inseparable from the dynamics of changes in the physical coast caused by land erosion by sea water (abrasion)
and the presence of sediment transport from the land (accretion) which generally highlight the changes in
shoreline. For this reason, research is needed to determine the magnitude of changes have occurred along the
coastline in 2002 to 2017 resulting in a map of shoreline changes. This research using the ratio interpretation
methods on the SWIR channel and green on Landsat 7 and Landsat 8 imagery plus classification, it can be
used to identify the coastline and analyze the magnitude of the changes that occur.
1 INTRODUCTION
Coastline is an area which has several separate
ecosystems between one ecosystem and another
ecosystem having interconnected and various
functions that are sometimes mutually beneficial or
harmful. Therefore, the coastal area is an area which
has dynamic movement as well as the coastline.
The southeast coast along the coast in Gianyar
Regency has a significant change due to impact of
these two aspect. Erosion of the beach has an impact
to collapse of shores on beach and stalls which
become a resting place for recreation to the beaches
in Gianyar Regency, Bali.
Classification of coastal areas in Indonesia can be
more easily recognized by using remote sensing
methods with temporal and spatial processes. Remote
sensing technology is very supportive in
identification and assessment of resources in coastal
areas and coastline changes, because it has the
advantage of being able to cover large areas with high
spatial resolution, as well as providing many choices
of remote sensing satellites which have good
accuracy in identifying objects on the surface of the
earth.(Hariyanto,2017)
Landsat satellites have the ability to detect
coastline changes using band ratio methods
(Vreugdenhil, C. B. 1999), therefore this study uses
Landsat satellites to determine the coastline changes
in 2002 and 2017 in Gianyar Regency, Bali
2 METHODS
The location of this study is located in Gianyar
Regency, Bali located between 115o13'29” BT –
115
o
22’23” BT and 8
o
18’48 ”LS - 8
o
38’58
"LS.Administratively, boundaries are as follows:
North Side : Bangli Regency
East Side : Klungkung Regency
South Side : Denpasar City and Badung Strait
West Side : Badung Regency
Hariyanto, T., Pribadi, C., Kurniawan, A. and Muktar, M.
Changes of Coastlines Caused by Abration using Multitemporal Satellite Images: Case Study - Coastal of Gianyar District, Bali.
DOI: 10.5220/0008373200330037
In Proceedings of the 6th International Seminar on Ocean and Coastal Engineering, Environmental and Natural Disaster Management (ISOCEEN 2018), pages 33-37
ISBN: 978-989-758-455-8
Copyright
c
2020 by SCITEPRESS – Science and Technology Publications, Lda. All rights reserved
33
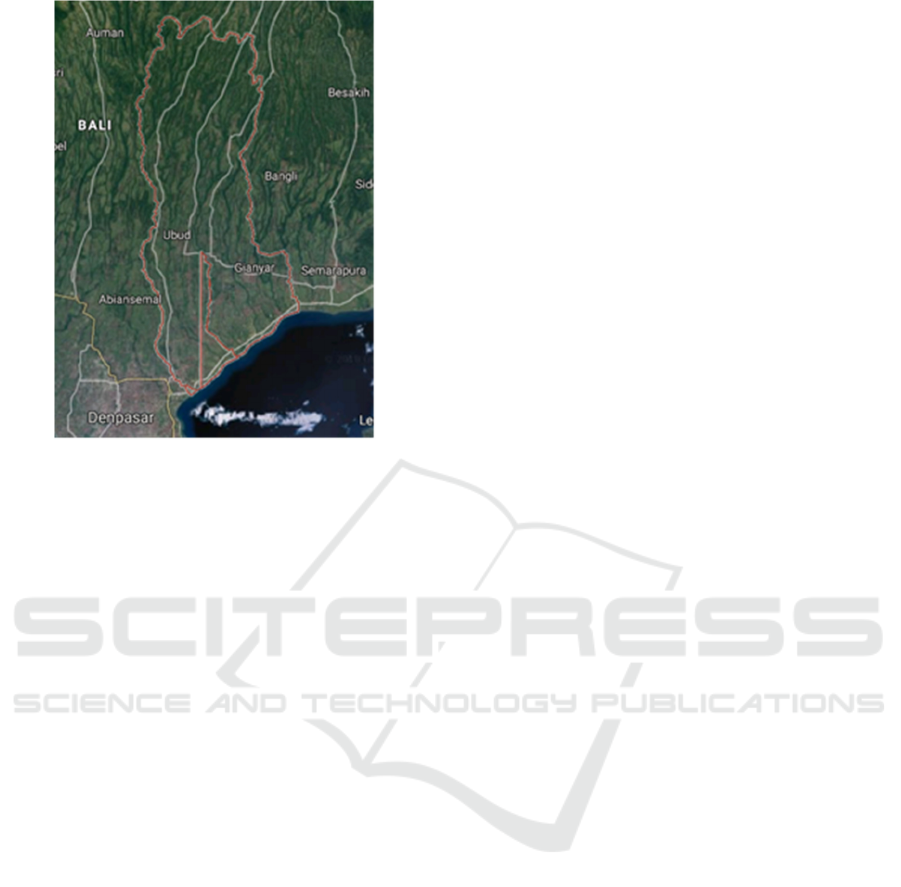
Figure 1: Study Area
3 DATA ACQUISITION
The data used in this study are Landsat 7 ETM+ C1
L1TP acquisition date of May 22th 2002, Landsat 8
OLI / TIRS C1 L1TP acquisition date of October 29th
2017, boundary administration of Gianyar regency,
boundary administration district in Gianyar regency,
ground truth of land cover in Gianyar regency was
obtained from measurements to the field, map of
Indonesian environment coast of gianyar regency,
tidal data in Gianyar regency in 2002 and 2017.
4 DATA PROCESSING
4.1 Band Merging
Combining Landsat 7 and Landsat 8 satellite imagery
combine separate bands into one file. Band combined
are blue, green, red and SWIR-1 bands. In this case,
band combined there are 4 bands, namely band 1, 2,
3 and 5 for Landsat 7 satellite imagery, and band
combined there are 4 bands, namely band 2, 3, 4 and
6 for Landsat 8 satellite imagery.
4.2 Sub-setting Image
The case study used is the beach along Gianyar
Regency, Bali. Subsetting image uses a subset of
vectors from the boundaries of Sukawati sub-district,
Blahbatuh sub-district, and Gianyar sub-district.
4.3 Land and Sea Masking
Band Ratio serves to separate the land and sea
regions. The formula used to identify coastlines
covered by sand and soil is a green band divided by a
SWIR-1 band. In this case, the band ratio on Landsat
7 satellite imagery uses a band 2 divided by band 5.
Whereas on satellite imagery Landsat 8 uses band 3
divided by band 6.
4.4 Raster Conversion to Vector
Changing the identified image of land and sea into
vector shapes (.shp) by using Raster to Polyline and
Raster to Polygon tools so that it will produce
coastlines from each image.
4.5 Supervised Classification
This classification to see land cover changes around
the coast. This classification starts with how to make
ROI from the pixels of each class, namely vegetation,
settlements, water bodies, and road bodies. Then the
classification is done with the supervised
classification: maximum likelihood tool, which will
form polygons from the classification results of each
class.
4.6 Accuracy Test
Accuracy test uses omission matrix and commission
which aims to find out whether the classification
process is accurate or not. If the results are above 85%
then tolerance has accepted. Accuracy testing is done
by making an omission table and a commission that
compares the results of the interpretation image with
field test results, then generate overall accuracy.
4.7 Spatial Analysis
Analyzing shoreline changes due to the abrasion of
Gianyar Regency, Bali in 2002 and 2017.
4.8 Map of Coastlines Change in 2002
to 2017
From the results of the image overlay, then the map
lay-outing process is carried out. The resulting map is
a map of shoreline changes due to abrasion in the
Gianyar Regency region, Bali from 2002 to 2017
which has been corrected with tidal data.
ISOCEEN 2018 - 6th International Seminar on Ocean and Coastal Engineering, Environmental and Natural Disaster Management
34

4.9 Calculation of Coastlines Change
Area in 2002 to 2017
This area calculation is used to determine how much
shoreline changes due to abrasion.
5 RESULT AND DISCUSSION
5.1 Land and Sea Masking
Coastlines change due to abrasion in Gianyar
Regency can be known through Landsat 7 and
Landsat 8 satellite imagery using band ratio method.
Band ratio is used to separate land and sea, so as to
produce coastlines from the image. This method uses
the value of the surface reflectance on radiometric
corrected images.
In this study, the two images used are L1TP levels
which has been orthorectified and radiometric
corrected using GCP from GLS2000 and DEM data
which include SRTM, NED, CDED, DTED, GTOPO
30, and GIMP (USGS, 2017).
The formula used in this method is a green band
divided by the SWIR-1 band, this formula can detect
sand-covered coastlines and land (Alesheikh, 2007)
where in this case study, beach in Gianyar Regency
was a beach covered with sand and soil. The formula
on Landsat 7 uses band 2 divided by band 5 and
Landsat 8 uses band 3 divided by band 6. The
following is the result of using the band ratio formula
on Landsat 7 and 8 satellite images:
Figure 2. Results of Landsat 7 Image Band Ratio
Figure 3: Results of Landsat 8 Image Band Ratio
Figure 4 tell us that Landsat 7 produces a land area
that is in solid gray, and an area of the sea colored in
gray dots. Meanwhile, in Figure 5 tell us that Landsat
8 produces a land area that is black and area of the sea
colored in white. From this process, a clear coastline
can be produced.
5.2 Raster to Vector Conversion
Raster to vector conversion is used to obtain
coastlines that can be calculated and overlayed so it
will be easier to analyze coastline changes due to
abrasion and make a map of coastline changes due to
abrasion. Result of raster to vector conversion on
Landsat 7 and 8 satellite imagery can be seen in the
following figure :
Figure 4: Landsat 7 Coastline Vector in 2002
Changes of Coastlines Caused by Abration using Multitemporal Satellite Images: Case Study - Coastal of Gianyar District, Bali
35
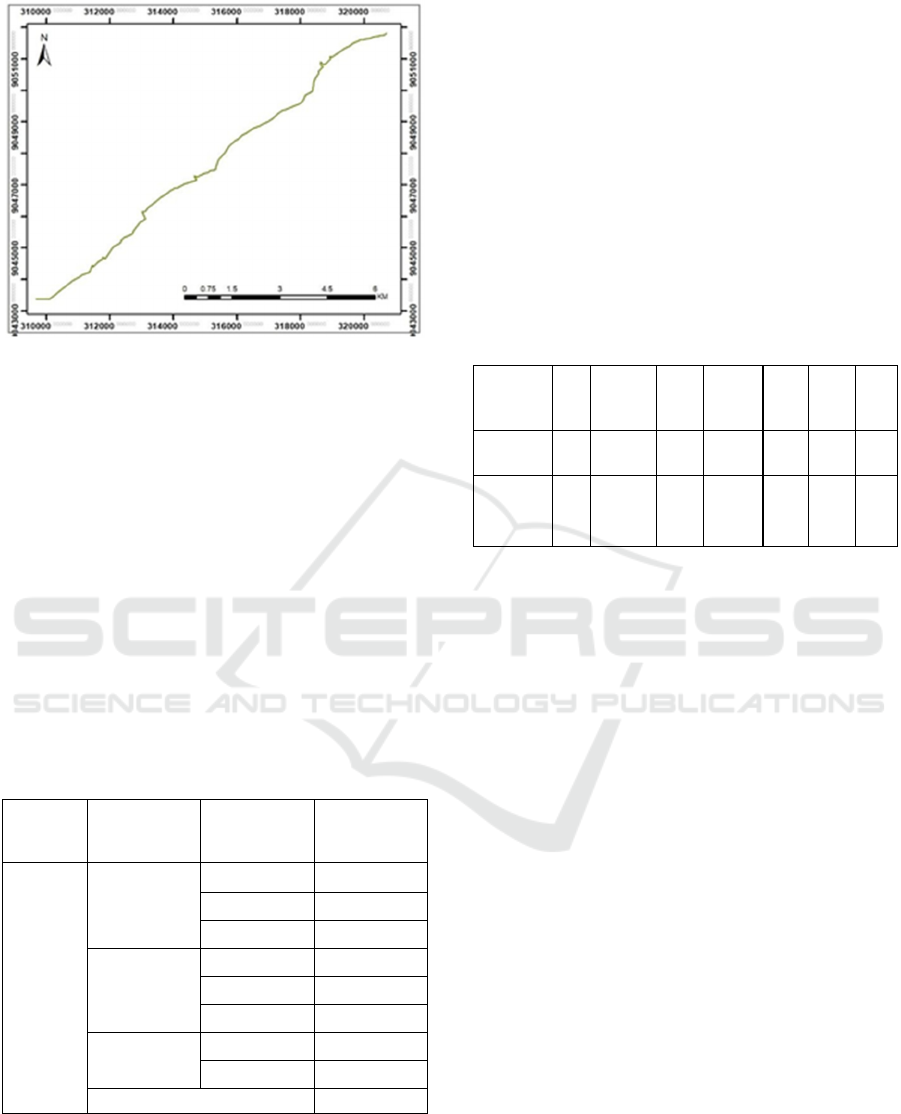
Figure 5: Landsat 8 Coastline Vector in 2017
Figure 6 tell us that coastline vector from Landsat
7 satellite imagery in 2002, and Figure 7 tell us that
coastline vector from Landsat 8 satellite imagery in
2017.
5.3 Coastline Changes
Coastline changes due to abrasion in Gianyar regency
can be known through Landsat 7 satellite imagery in
2002 and Landsat 8 satellite imagery in 2017 using
band ratio method which is converted into a vector,
so that extensive abrasion can be known. Image
processing results show the abrasion area that occurs
on coast of Gianyar Regency which is presented in
the following table:
Table 1. Changes in Area Due to Abrasion
District Sub-District Village
Abrassion
Area
(km
2
)
Gianyar
Sukawati
Ketewel 0,065
Sukawati 0,025
Saba 0,015
Blahbatuh
Pering 0,006
Keramas 0,007
Medahan 0,011
Gianyar
Lebih 0,026
Tulikup 0,040
Total
0,195
The results of processing Landsat 7 satellite
imagery in 2002 and Landsat 8 satellite imagery in
2017 show that the abrasion area that occurred quite
large from 2002 to 2017 of 0.195 km2. The village
that was most affected by abrasion is Ketewel Village
of 0.065 km2 Tulikup Village of 0.040 km2, Lebih
Village of 0.026 km2, Sukawati Village of 0.025
km2, Saba Village of 0.015 km2, Medahan Village of
0.011 km2, Keramas Village 0.007 km2, and the most
slightly exposed to abrasion is Pering Village of 0.006
km2. Coastline changes due to abrasion occur purely
due to natural factors, namely the beach located in
high seas zone.
Coastline from satellite imagery also takes into
account natural factors, one of which is the tide. Map
of the coastline changes of Gianyar Regency in 2002-
2017 has been corrected from the calculation of the
tides. The following is a tidal correction calculation:
Table 2. Tidal calculations
Acquisitio
n Date
Tim
e
HHW
L
(m)
d (m) m (m)
η
(m)
β
(o)
x
(m)
22 May
2002
10:1
2
1,391
11,06
3
384,20
8
0,32
8
1,64
9
0,19
9
29
October
2017
10:2
4
1,476
11,39
5
412,87
2
0,08
1
1,58
1
0,05
1
Coastline is carried out by take a point on the
coastline which is assumed that the condition of
seawater has experienced the same increase, after that
it can be calculated the slope of the coast which will
result in a distance of coastline shifting from tidal
correction (x). Highest High Water Level (HHWL) is
obtained from the tidal calculation using the least
square method, the depth value (d) is obtained from
the contour contained in Gianyar Regency, Beach
Environment Map which is corrected with the tidal
reading value when recording the image (η) and the
HHWL value. Coastline in 2002 obtained from
Landsat 7 were drawn ashore in the amount of 0.199
m and coastline in 2017 which is obtained from
Landsat 8 is drawn towards the land of 0.051 m.
6 CONCLUSION
Based on results of this study, there are several things
can be concluded in this study, Landsat 7 and 8
satellite imagery carried out by band ratio method, a
map of the Gianyar Regency coastline changes can be
made in 2002-2017. The results of the processing of
Landsat 7 and 8 satellite imagery show that the
abrasion area that occurred quite large from 2002 to
2017 was 0.195 km2. The village that was most
affected by abrasion is Ketewel Village of 0.065 km2
Tulikup Village of 0.040 km2, Lebih Village of 0.026
ISOCEEN 2018 - 6th International Seminar on Ocean and Coastal Engineering, Environmental and Natural Disaster Management
36

km2, Sukawati Village of 0.025 km2, Saba Village of
0.015 km2, Medahan Village of 0.011 km2, Keramas
Village 0.007 km2, and the most slightly affected
abrasion is Pering Village of 0.006 km2.
REFERENCES
Alesheikh, et al,2007. Coastline Change Detection Using
Remote Sensing, Int. J. Environ. Sci. Tech., 4 (1): 61-
66, 2007, ISSN: 1735-1472, IRSEN, CEERS, IAU.
Butler, M.J.A., M.C. Mouchot, V. B., and C Le Blanc,1988.
The Aplication of Remote Sensing Technology to
Marine Fisheries: An Introduction Manual. FAO
Fisheries Technical Paper.
Chand, P., and Acharya, 2010. P. Shoreline Change and Sea
Level Rise Along Coast of Bhitarkanika Wildlife
Sanctuary, Orissa: An Analytical Approach of Remote
Sensing and Statistical Techniques. Int J Geom and
Geosci.
Gao, B.C,1996. NDWI A Normalized Difference Water
Index for Remote Sensing of Vegetation Liquid Water
From Space. Remote Sensing of Environment, 58, 257-
266.
Hariyanto,T.,2017.Development of Total Suspended
Sediment Model using Landsat-8 OLI and
In-situ Data at the Surabaya Coast, East Java,
Indonesia, Indonesian Journal of Geography Vol. 49,
No.1, June 2017 (73- 79).
Moore, K. J., 2000. Shoreline Mapping Techniques. Journal
Coastal Res 16 (1), 111-124.
USGS. 2017. Landsat Collection 1 Level 1 Product
Definition.
Vreugdenhil, C. B. 1999. Transport Problems in Shallow
Water Battleneeks and Appropriate Modeling. Twente
University, Department of Civil Engineering and
Management, Seminar on Sediment Transport
Modelling.
Changes of Coastlines Caused by Abration using Multitemporal Satellite Images: Case Study - Coastal of Gianyar District, Bali
37
