
Fluid Chart on Fluid Intake Management Adherence among
Hemodialysis Patients: A Literature Review
Zaky Mubarak
1
, Endang Mahati
2
and Anggorowati
3
1
Master of Nursing Student, Faculty of Medicine, Diponegoro University, Indonesia
2
Lecturers of the Faculty of Medicine, Diponegoro University, Indonesia
3
Masters of Nursing Lecturers, Faculty of Medicine, Diponegoro University, Indonesia
Keywords: Fluid Chart, Adherence, Haemodialisis Patient.
Abstract: The purpose of this literature is evaluate the effect of fluid chart on fluid intake management adherence
among haemodialysis patients. The method that was used in this writing is a literature review study and the
analytical method that was used here is PICOT (Population, Intervention, Comparison, Outcome, dan
Time). This literature review used five bibliography databases (CINAHL, Scientdirect, Proquest, Pubmed,
and MEDLINE) from their inception in Januari 2010 to Desember 2017. The Inclusion criteria in this study
are articles published in 2010 to 2017 that are available in full text and in English laguange. The subject of
the study was patients in Hemodyalisis. A total of 27 articles had been identified and a total of 21 articles
excluded. Finally, there are 6 studies met the criteria. The results of all of the articles mention that the fluid
management of patients undergoing haemodialysis can be enhanced with paper-based monitoring
interventions. The majority of old haemodialysis patients is the basic reason why paper-based monitoring is
considered effective. Fluid Chart was one of the conventional monitoring media that has long been used by
health workers. Cost effectiveness and practicality were advantages of conventional reminder systems.
Strategies that were directed towards improving compliance behavior must target the barriers that underlie
compliance. Therefore, reminders provide useful additions to compliance improvement strategies.
1 INTRODUCTION
Management of limiting poor fluid intake will have
an impact on weight gain between two dialysis
times. Fluid restriction is less obeyed in self-
management of CKD patients (McLafferty et al.,
2014). Weight gain between two dialysis times
(IDWG) is influenced by several factors, namely:
environment, nutrition, behavior, physiology, and
psychology (Hung et al., 2008). Juan (2005) reveals
that the more the percentage of IDWG, the worse the
long-term prognosis and the resulting high blood
pressure predialysis.
New hemodialysis patients in Indonesia from
2007 to 2012 increased significantly with details of
4977 people (2007), 5392 people (2008), 8193
people (2009), 9649 people (2010), 15353 people
(2011), 19621 people (2012 ) The number of new
patients in East Java alone in 2012 reached 11672
people with 2796 people being patients with
terminal kidney disease. This number is the second
highest after West Java Province (Indonesian et al.,
2015).
Complications often occur in hemodialysis
patients are weight gain between two hemodialysis
times (Interdialytic weight gain = IDWG) caused by
the inability of the kidney excretion function, so that
whatever amount of fluid is consumed by the
patient, weight gain will always be present. In other
words, zero ml weight gain is impossible. Adding
too high an IDWG can cause negative effects on the
patient's condition, including hypotension, muscle
cramps, hypertension, shortness of breath, nausea
and vomiting, and others (Kugler, Maeding and
Russell, 2011).
Excess fluid complications in
patients with CKD are hypertension, peripheral
edema and ascites. The ideal weight gain between
two hemodialysis times is 1.5 kg (Bame, Petersen
and Wray, 1993).
Fluid balance refers to the balance between the
volume of water lost from the body and the volume
of water (McLafferty et al., 2014). Fluid Chart has
been a document in the health care system for more
than 50 years and is a non-invasive tool to assess the
104
Mubarak, Z., Mahati, E. and Anggorowati, .
Fluid Chart on Fluid Intake Management Adherence among Hemodialysis Patients: A Literature Review.
DOI: 10.5220/0008203801040109
In Proceedings of the 1st International Conference of Indonesian National Nurses Association (ICINNA 2018), pages 104-109
ISBN: 978-989-758-406-0
Copyright
c
2020 by SCITEPRESS – Science and Technology Publications, Lda. All rights reserved
hydration status of patients (Malster, Dougherty and
Lamb, 1999). Fluid Chart This is a chart
documenting the input and output that the patient
has taken in and out in a 24-hour period (Chung,
Chong and French, 2002).
Kaveh & Kimme (2000) and Abuelo (1998)
reveal that good fluid management is due to
restrictions on fluid intake, limiting up to 1 liter per
day is important to reduce the risk of excess volume
of fluid between dialysis times. Kimmel (2000),
Leggat (1998), Port (2004), Saran (2003) in Welch
(2006) suggested that a person with CKD who does
not adhere to fluid restriction can worsen the
prognosis of the disease with a high rate of
morbidity and mortality.
This article aims to find out that conventional
media in this case is illustrated by a fluid chart that
can help hemodialysis patients to achieve fluid
fulfillment in accordance with how to adhere to a
defined fluid management.
2 METHODS
2.1 Search Strategy
Our search (Table 1) is limited to the PUBMED
database, CINAHL Science Direct, and Medline. We
use the Fluid chart search terms '' and 'Fluid
management' or 'fluid blocking compliance' AND
'hemodialysis patients', and we limit the search to
full text articles published between January 2010
and 2018. To be considered as candidate articles for
review, Fluid chart '' AND 'Management of fluids'
or' adherence to repair of fluids' AND 'patients with
hemodialysis must be stated in title or abstract.
Studies are included in our review if they focus on
Fluid charts, fluid management or compliance with
fluid restriction and hemodialysis patients. Because
we are interested in conventional (paper based)
media as a medium to meet fluid management,
especially compliance with fluid restriction in
hemodialysis patients. Morbidity and mortality of
hemodialysis patients depend on patient compliance
in carrying out hemodialysis treatment regimens,
one of which is fluid management. We also check
the reference list of papers included to identify
possible additional studies that might be missed
during database searches.
Literature analysis using PICOT (Population,
Intervention, Comparison, Outcome, and Time).
Based on the analysis found 2 themes, namely fluid
management in hemodialysis and fluid chart patients
as a fluid management compliance medium.
2.2 Search Outcome
The search resulted in six candidate publications,
which are briefly described in Table 2. 5 studies
discussed fluid charts and 1 drastic study of fluid
management in hemodialysis patients. Three studies
were completed in England (Jeyapala et al., 2015)
(Chung, Chong and French, 2002) (Tang and Lee,
2010); two in Australia (Georgiades, 2016) (Daffurn
et al., no date); and one in Hong Kong (Chung,
Chong and French, 2002).
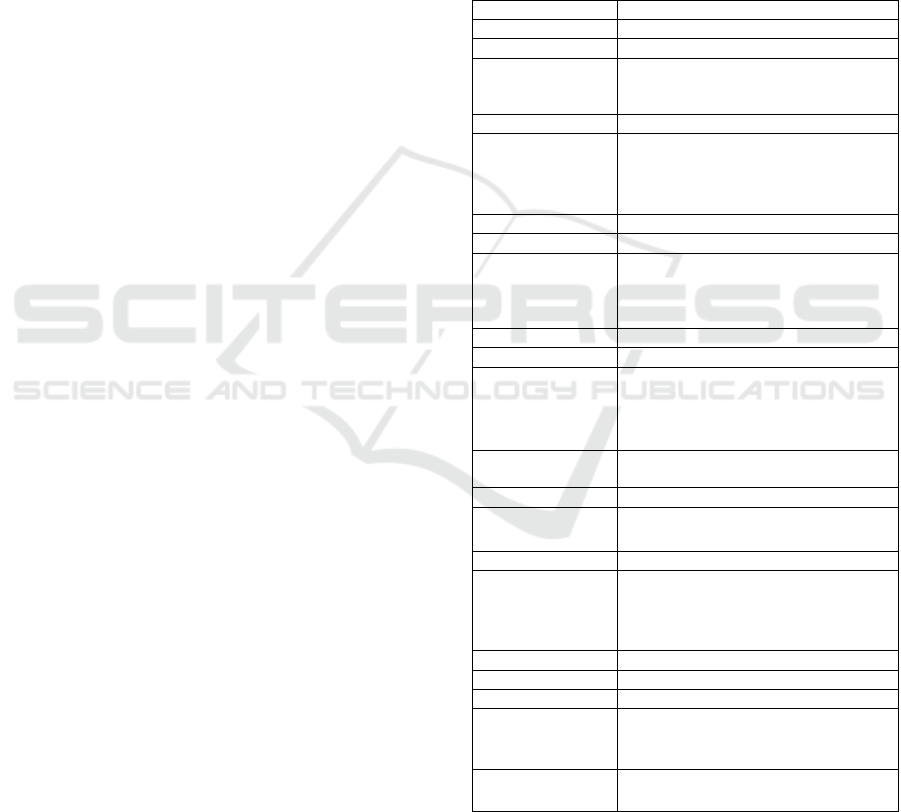
Table 1: Search Strategy.
Stage 1: initial search
Keywords
Fluid chart AND fluid management
Results 55737
Keywords
Fluid chart AND fluid management
OR
fluid
adherence retrictions
Results 10275
Keywords
Fluid chart AND fluid management
OR
fluid
adherence retrictions and hemodialysis
patient
Results 360
Stage 2: screening
Filter
Fluid chart AND fluid management
OR
fluid
adherence retrictions and hemodialysis
patient
2010 - 2018/Full text articles
Results 159
Filter
Fluid chart AND fluid management
OR
fluid
adherence retrictions and hemodialysis
patient
Title/Abstract/2010-2018/Full text
articles
Results 27
Filter
Title/Abstract/‘Related articles’ examined for
rele
vance
Results 12 and 8 ‘related’
Filter
inclusion/exclu
sion
criteria
Articles examined for relevance. ‘Related
articles’
of relevant articles examined for
relevance. Manual
searching in bibliographies
of relevant articles.
Consultation of experts
Results 6
Criteria
Inclusion
Fluid chart AND fluid management
OR
fluid
adherence retrictions and hemodialysis
patient
Exclusion
Nutrition management on hemodialysis patient
Chart on industri building
2.3 Appraisal
There is little consensus on how to assess qualitative
and quantitative articles. Quantitative studies are
Fluid Chart on Fluid Intake Management Adherence among Hemodialysis Patients: A Literature Review
105

assessed in terms of relativity and validity, while the
evaluative criteria for qualitative studies are based
on trust. Thus, we use some interesting general
points, as presented by Dixon-Woods et al 2010. and
Kearney 2007, to evaluate the accuracy of the study
included.
One qualitative study provides an explanation of
the effectiveness and suitability of fluid balance
charting by Lai Har Chung who analyzed 250
medical records and opinion surveys, 55 doctors and
98 nurses participated in this survey. The result is
that 50% of medical records have fluid balance
charts and in this case they make 12-16%
themselves in medical records. Infusion fluids and
urine catheter production were recorded in almost
70% of the reasons for using fluid balance charts.
32% of FB charts were found to be incomplete and
inaccurate. 46% of doctors and nurses report that
they believe FB charts do not always provide if not
needed. Doctors believe that so far only those who
have to stop the FB chart, nurses cannot provide
intervention except with the doctor's approval. The
end result is that the design of the chart must be
modified to accommodate different goal. Regarding
quantitative studies, fluid input / output charts in
hospitalized patients is a valuable source of
information for doctors who review intravenous
fluid prescriptions, but are known to be incomplete
and inaccurate. The lack of awareness of the
importance of fluid balance between nursing staff
and the advantages of unnecessary monitoring are
two factors that contribute to this problem. Vincent
conducted a quality improvement project on the
respiratory ward in a large district general hospital
which aimed to specifically address these two
factors. Pre-intervention audits show that only 53%
of input / output monitoring is clinically indicated,
with an average 50% graph completion. By using e-
Learning and verbal presentations to raise awareness
about fluid balance, we implemented a new system
where daily medical reviews of charts lead to
rationalization of monitoring. Post-intervention
audits show a 93% reduction in unnecessary
monitoring, with appropriate improvements in
completion (40%) and accuracy (48%) of the
remaining charts. In conclusion, education has
allowed cultural changes in wards that drastically
improve the quality of monitoring fluid balance.
2.4 Data Abstraction and Synthesis
All research included illustrates the experiences
experienced by victims of disability and returns to
work. To compare qualitative and quantitative
findings, the reviewer (CT) isolates and categorizes
the findings of the findings and summarizes them
into relevant themes (thematic analysis): fluid
management in hemodialysis and fluid chart patients
as a fluid management compliance medium.
Furthermore, quantitative in-depth and
complementary qualitative findings from
questionnaires were integrated and divided into
'Fluid charts' and' fluid management compliance.
This abstraction and synthesis process is also
discussed with fellow authors.
2.5 Fluid Chart on Fluid Adherence
Management in Hemodialysis
Patient
Table 2: Studies included in the literature review.
Tittle, Author, origin Design Sample Data collection Employment variables/themes
A Balancing Act:
Maintaining Accurate
Fluid Balance Charting,
Dimitra Georgiades
Australia
article - Critical appraisal
examined the contributing factors
that inhibit accurate fluid balance
charting such as lack of time related
to patient acuity and inadequate
training and education
Management of Fluid
Status in Hemodialysis
Patients: The Roles Of
Technology and Dietary
Advice
Elizabeth Lindley
et al. UK
Clinical
mangement
-
The implementation of bioimpedance
measurements to assist in the
optimisation of the patient’s target
weight, and the use of salt restriction
to avoid excessive fluid gains, should
enable most haemodialysis patients
to stay close to normal hydration
throughout the interdialytic period
ICINNA 2018 - The 1st International Conference of Indonesian National Nurses Association
106

Table 2: Studies included in the literature review. (cont.)
Tittle, Author, origin Design Sample
Data
collection
Employment variables/themes
Tittle,
Author,
origin
Improvement of fluid
balance monitoring
through education and
rationalisation, Masaki
Vincent, Thabo
Mahendiran, UK
Quantitative
study
117 patient:
1.
Whether daily fluid
balance monitoring was
happening.
2.
Whether daily fluid
balance monitoring was
clinically indicated.
3.
Whether "totals"
boxes had been completed
(eg 12 hours total for oral
input, 24 hours total for
oral input, 12 hours total
for IV input, etc).
4.
Whether "totals"
boxes were accurate. We
defined a sum as
"accurate" if the error in
the final sum was inferior
to 10% of the sum itself.
two main
group
interventions
Fluid balance monitoring can be
improved by the implementation
of a system where daily medical
review of fluid charts allows
rationalisation of monitoring,
reducing unnecessary workload
and improving chart completion
and accuracy in patients who
need it. In order to make such a
cultural change succeed on a
ward, it is crucial to raise
awareness and education around
the importance of fluid balance.
Statistical
analysis
Fluid balance chart: do
we understand i ?,
Vincent CY Tang and
Elaine WY Lee, UK
Quantitative
study
13 patient of surgical
patient requiring
intravenous fluid and
catheterized for urine
output monitoring from
all five surgical wards on
the same day
two main
group
interventions
Fluid balance chart is a useful
monitoring tool of patient
hydration status, however it can
be counterproductive and
dangerous if the documentation
is poor and interpretation
incorrect.
Statistical
analysis
The efficiency of fluid
balance charting : an
evidance – based
management project,
Lai Har Chung et al,
Hong Kong
Qualitative
study
250 medical records and
an opinion survey.
75 doctors and 98 nurses
participated in the survey.
Collection of
data the
survey method
In the case of fluid balance
charting in this study, it could be
said that the major cause of
inefficiency is that those who are
making the observation are not
empowered to make the decision
to terminate the chart when they
are thought unneccessary. In
addition, the design of chart does
not seem to encourage a
distinction record, output
observation and fluid balance
observation.
Conducted
all of the
interviews
and data
recording
Fluid Balance charts :
do they measure up ?,
Kathrine Daffurn et al,
Australia
Quantitative
study
The study was conducted
in two parts. The first part
used a questionnaire
designed in consultation
with a psychologist
attached to the critical
care research unit.
The second part of the
study involved groups of
nurses in a practical
exercise to estimate fluid
gains and losses. Forty-
five registered nurses
were selected, using a
random number table,
from the population of
nurses rostered on the
chosen
study date.
Conducted 2
parts
This study has shown that nurses
rate FBCs highly, although some
discrepancies were identified in
the way that they are used.
Nurses may be commencing
FBCs unnecessarily and doctors
do not always look at them.
Nurses can estimate fluid
volumes with reasonable
accuracy, which is encouraging
as they do not or cannot always
measure the fluids being
recorded.
Statistical
Analysis
Fluid Chart on Fluid Intake Management Adherence among Hemodialysis Patients: A Literature Review
107

3 RESULTS
3.1 Management of Fluid in
Hemodialysis Patients
Fluid management is a skill in identifying problems,
setting goals, solving problems, making decisions in
response to fluctuations in signs and symptoms,
taking action in response to physiological responses
to lack of body fluids, monitoring and managing
symptoms (Lindberg, Wikström and Lindberg,
2010). It is important to remember about the causes
of thirst. Thirst is a direct result of too much salt in
water, food and also salt added to food. Too much
salt diet will cause sodium levels to increase and
activate the thirst mechanism in the brain, for that it
is necessary to drink enough liquid to normalize
sodium. A more important aspect of maintaining
normal IDWG in patients with hemodialysis and
peritoneal dialysis is to reduce the amount of salt
and use spices and spices to add flavor (Santos and
Peixoto, 2008).
The advantages of IDWG may not always be the
cause of the patient's lack of understanding about
limiting fluid intake. Increased fluid-filled food and
appetite for patients will increase IDWG, and this
fact can be obtained in detail in dietary studies,
indications of high protein and calories such as
fluids in jelly, ice cream, sauces and soup. Excess
IDWG can be prevented by daily fluid intake of 500-
750 ml in the situation of dry urine production.
Sodium intake of 80-110 mmol per day, will be
enough to control thirst and help patients regulate
fluid (Sezer et al., 2002).
3.2 Fluid Chart as a Fluid
Management Compliance Media
Fluid charts are widely used in most hospitals as a
guide to the patient's fluid status. The time the nurse
uses to map fluid intake and output can be very
significant in some cases (Chung, Chong and
French, 2002).
Paper graph based reminders are conventional
media from the support system of clinical decision
making (Decision Support System / DSS).
According to Kawamoto et al., A significant
increase in clinical practice can be found if the DSS
contains all of the following special features: (1)
provision of decisions as part of the clinical
workflow; (2) providing recommendations and not
just assessments; (3) providing decision support at
the time and location of decision making; and (4)
computer-based decision support.
6
This reminder
system processes the first three characteristics of
successful DSS but not computer-based or assisted
by informatics. However, Ansari et al. shows that
simple reminders on input - output fluid reports can
increase physician compliance with the use of drugs
which regulate fluid intake and output for patients
with chronic renal failure with Hemodialysis.
6
Paper-based graphs prove that conventional
reminder systems are attached to paper charts during
Clinical workflows can facilitate the awareness of
doctors and nurses to evaluate current fluid status.
4 DISCUSSION
Fluid Management Monitoring is done by recording
fluid intake and expenditure and body weight.
Liquid intake includes the type and amount of food
and liquid. While fluid expenditure is the amount of
urine, vomiting and diarrhea. Fluid Chart is one of
the conventional media that has long been used for
fluid management, especially patients with chronic
diseases. Patients with CKD with Hemodialysis are
very at risk with fluid calculations, factors of patient
disobedience to fluid management are found in the
clinical domain. Fluid Chart is useful for calculating
the management and fluid balance of hemodialysis
patients. By recording all the liquid consumed by the
patient and recording all the fluids released by the
patient, both from the urine, sweat and vomit of the
patient. Patients who follow and carry out the
instructions to maintain fluid balance can help
maintain IDWG 2.5% to 3.5% dry weight or not
exceed 5% dry weight. The IDWG value
(interdialytic weight gain) is calculated based on the
patient's body weight before hemodialysis (wet
weight) minus weight after hemodialysis (dry
weight). The normal value of IDWG is less than 3%
dry weight (Malster, Dougherty and Lamb, 1999).
Factors of patient adherence in adhering to the
amount of fluid consumption determine the
achievement of optimal dry weight (Riyanto (2011).
Kimmel, et al (2000) showed that age is a strong
factor in the level of patient adherence. Patient aged.
Fefendi (2008) explained that patients with
productive age feel motivated to recover, have a
higher life expectancy and as the backbone of the
family (Cvengros, Christensen and Lawton, 2004).
5 CONCLUSIONS
Fluid Chart is one of the conventional monitoring
media that has long been used by health workers.
ICINNA 2018 - The 1st International Conference of Indonesian National Nurses Association
108

Cost effectiveness and practicality are advantages of
conventional reminder systems. Repeated telephone
calls, text messages, pager systems, or advanced
appointments for a condition, require relatively high
costs and labor to be prepared. Repeated monitoring
can also be seen as instructive rather than helpful
(Hung et al., 2008).
Fluid management of patients undergoing
hemodialysis can be improved by paper-based
monitoring interventions. Hemodialysis patients who
are mostly elderly are the basic reasons why paper-
based monitoring is considered effective. The
physiological aging process which includes a blurred
vision, decreased memory, and a lack of knowledge
about modern technology is a consideration for the
use of conventional media as a monitoring medium.
Strategies that are directed towards improving
compliance behavior must target the barriers that
underlie compliance. Therefore, reminders can
provide useful additions to compliance improvement
strategies (Kugler, Maeding and Russell, 2011).
REFERENCES
Bame, S. I., Petersen, N. and Wray, N. P. (1993)
‘Variation in hemodialysis patient compliance
according to demographic characteristics.’, Social
Science & Medicine (1982). Department of Urban
Planning, Texas A&M University, College Station
77843.: Pergamon, 37(8), pp. 1035–1043.
Chung, L. H., Chong, S. and French, P. (2002) ‘The
efficiency of fluid balance charting: An evidence-
based management project’, Journal of Nursing
Management, 10(2), pp. 103–113. doi:
10.1046/j.0966-0429.2001.00296.x.
Cvengros, J. A., Christensen, A. J. and Lawton, W. J.
(2004) ‘The role of perceived control and preference
for control in adherence to a chronic medical
regimen’, Annals of Behavioral Medicine, 27(3), pp.
155–161. doi: 10.1207/s15324796abm2703_3.
Daffurn, K. ‘Fluid baiance charts: do they measure up?’
Georgiades, D. (2016) ‘A BALANCING ACT:
MAINTAINING ACCURATE FLUID BALANCE
CHARTING.’, Australian nursing & midwifery
journal, 24(6), pp. 28–31.
Hung, C. S.. (2008) ‘Using paper chart based clinical
reminders to improve guideline adherence to lipid
management’, Journal of Evaluation in Clinical
Practice, 14(5), pp. 861–866. doi: 10.1111/j.1365-
2753.2008.01066.x.
Indonesian, P. (2015) ‘Program Indonesian Renal
Regestry (IRR)’, pp. 1–45.
Jeyapala, S. (2015) ‘Improving fluid balance monitoring
on the wards’, BMJ Quality Improvement Reports,
4(1), p. u209890.w4102. doi:
10.1136/bmjquality.u209890.w4102.
Kugler, C., Maeding, I. and Russell, C. L. (2011) ‘Non-
adherence in patients on chronic hemodialysis: An
international comparison study’, Journal of
Nephrology, 24(3), pp. 366–375. doi:
10.5301/JN.2010.5823.
Lindberg, M., Wikström, B. and Lindberg, P. (2010)
‘Subgroups of haemodialysis patients in relation to
fluid intake restrictions: A cluster analytical
approach’, Journal of Clinical Nursing, 19(21–22), pp.
2997–3005. doi: 10.1111/j.1365-2702.2010.03372.x.
Malster, M., Dougherty, L. and Lamb, J. (1999) ‘Fluid and
electrolyte balance’, pp. 42–49.
McLafferty, E, (2014) ‘Fluid and electrolyte balance.’,
Nurs Stand, 28(29), pp. 42–49. Available at:
http://ovidsp.ovid.com/ovidweb.cgi?T=JS&PAGE=ref
erence&D=ovftp&NEWS=N&AN=00002311-
201403190-00052.
Santos, S. F. F. and Peixoto, A. J. (2008) ‘Revisiting the
dialysate sodium prescription as a tool for better blood
pressure and interdialytic weight gain management in
hemodialysis patients’, Clinical Journal of the
American Society of Nephrology, pp. 522–530. doi:
10.2215/CJN.03360807.
Sezer, S. (2002) ‘The association of interdialytic weight
gain with nutritional parameters and mortality risk in
hemodialysis patients’, Renal Failure, 24(1), pp. 37–
48. doi: 10.1081/JDI-120002659.
Tang, V. C. Y. and Lee, E. W. Y. (2010) ‘Fluid balance
chart: Do we understand it?’, Clinical Risk, 16(1), pp.
10–13. doi: 10.1258/cr.2009.090005.
Fluid Chart on Fluid Intake Management Adherence among Hemodialysis Patients: A Literature Review
109
