
The Content Distribution and Pollution Assessment of Heavy Metals
in the Surface Sediments of Dalian Bay
Qinbang Sun
*
, Fan Gao, Yang Wang, Depeng Li and Zhaolin Chen
National Marine Environmental Monitoring Center, Dalian 116023, China
Keywords: Sediment; Heavy metal; Pollution assessment; Principal Component Analysis; Dalian Bay
Abstract: The distribution of 6 heavy metals sediments samples collected in the coastal waters of Dalian Bay in May
2015, was studied. The results showed that the content range of Cu, Pb, Zn, Cd, Hg and As in the surface
sediments samples were 9.10~84.90, 9.80~65.90, 29.70~259.00, 0.12~1.30, 0.021~0.350, 4.18~44.50
mg∙kg
-1
, and the average values were respectively 34.62, 30.47, 106.50, 0.36, 0.12 and 11.10 mg∙kg-1.
Moreover, the content values of Cd and Hg were lower than the background values of the national coastal
zone. The quality of marine sediments samples was evaluated by the single-factor pollution index method in
this study. The evaluating results showed that the average content of Cu, Pb, Zn, Cd, Hg and As was
consistent with the marine sediment quality I standard, and the pollution level of the 6 heavy metals was Cu >
Zn > Cd > Hg > As>Pb. With the Hakanson potential ecological risk index method, the survey data were
analyzed. The analysis results showed that the potential ecological risk index level of Dalian Bay was
medium, and the potential ecological risk indexes of surface sediments heavy metals were almost similar. The
correlation analysis of heavy metals survey data in the surface sediment showed that there was a positive
correlation between Cu, Pb, Zn, Cd and As in the surface sediments of the sea area and the correlation
coefficient was large, indicating that they had a certain homology. The TOC content was positively correlated
to the Cu, Zn and Cd content, and the petroleum was correlated to Cu, Pb, Zn, and Cd content. This indicated
that the distribution of heavy metals was effected by TOC and petroleum. The main source of heavy metal
pollution in marine sediments was further studied by the principal component analysis, and the contribution
rate of the first 2 principal components was 86.87%. Combined with the correlation analysis results, the
principal component analysis results showed that the main source of heavy metal Cu, Pb, Zn and Cd in Dalian
Bay was the industrial pollution. This paper reveals the distribution characteristics of heavy metals in the
sediments of Dalian Bay, and provides scientific basis for the marine ecological civilization constructionand
the comprehensive control of marine environment.
1 INTRODUCTION
Dalian Bay is a semi-closed natural bay at the
southern end of Liaodong peninsula, along the coast
of which there are rich port resources and many
chemical plants and sewage outlets (Li et al., 2016).
In recent years, the large-scale marine reclamation
land activities and the development of port industries
have brought great pressure to the marine
environment of the sea area. The heavy metal content
in marine surface sediments is an important basic
data to measure the quality of the marine
environment. Heavy metal pollution has become an
important content of marine environmental pollution
assessment (Zhang et al., 2012; Alam et al., 2018;
Krika and Krika, 2017; Mallick et al., 2016;
Gurumoorthi et al., 2016; Islam et al., 2016; Vaezi et
al., 2016; Chen et al., 2015)At present, numerous
studies have focused on pollution of Dalian Bay. For
example, Wang Shaofang et al reported the last 100
years evolution of heavy metal pollution in the Dalian
bay
(Wang et al., 2002). Wang Jiahua reported the
pollutions and source directive significance of heavy
metals in the sediments of Dalian bay (Wang et al.,
2002). Zhang Yufeng reported the spatial-temporal
distribution, structural features and ecological
responses of nutrients in Dalian Bay ( Zhang et al.,
2015). Ma Xindong reported the main pollution
factors and sources contribution of water quality in
Dalian Bay (Ma et al.,2016). Liu Chuantao observed
the occurrence and bioavailability of mercury in the
surface sediments of the Dalian Bay (Liu et al.,
Sun, Q., Gao, F., Wang, Y., Li, D. and Chen, Z.
The Content Distribution and Pollution Assessment of Heavy Metals in the Surface Sediments of Dalian Bay.
DOI: 10.5220/0008189403110318
In The Second International Conference on Materials Chemistry and Environmental Protection (MEEP 2018), pages 311-318
ISBN: 978-989-758-360-5
Copyright
c
2019 by SCITEPRESS – Science and Technology Publications, Lda. All rights reserved
311
2017). However, there are few reports on the
pollution assessment of heavy metals in the surface
sediments of Dalian Bay in recent years. In this paper,
the contents and pollution characteristics of heavy
metals (Cu, Pb, Zn, Cd, Hg and As) in the surface
sediments were studied through the heavy metals
survey data of the Dalian Bay in May 2015. The
pollution status and sources of heavy metals in the
marine sediments of Dalian Bay were assessed with
Hakanson potential ecological risk index method and
the principal component analysis method, which
would provide a scientific basis for the ecological
civilization construction of Dalian Bay and the
comprehensive control of heavy metals pollution in
the marine environment of Dalian Bay.
2 MATERIALS AND METHOD
2.1 The Overview of Research Area
The Dalian Bay lies on the southern tip of Liaodong
peninsula, whose three sides are surrounded by land,
and only whose southeast is connected with the
Yellow Sea. The coastline is a typical bedrock harbor
type coast. At the mouth of the Bay, Sanshan Island
like a barrier protects the whole bay. And there are 3
inner bay from the southwest to the northeast at the
top of the Bays, namely, which are Choushuitao,
Tianshuitao and Hongtuduizi bays (Chen and Wang,
2016) The total area of the bay is about 174 km
2
, and
the coastline is tortuous, which is a typical bedrock
harbour coast. The seabed geomorphology type is
single and belongs to flat shoal. The tide of the sea
area is a regular half day. The tidal current belongs to
the irregular half day tidal current. The velocity of
residual current in the bay is relatively small, and is
affected by the monsoon and has obvious seasonal
variation. The sources of sediment in this bay are
mainly the waste residues abandoned by coastal
plants and mining enterprises and the weathered
erosion debris along the coast. There are no big rivers
around the bay, and there are only some intermittent
streams. The silts carried by sewage, waste discharge
and flood in the flood season, are the main source of
marine sediments in the bay (Bao, 1991).
2.2 The Collection and Analysis of
Samples
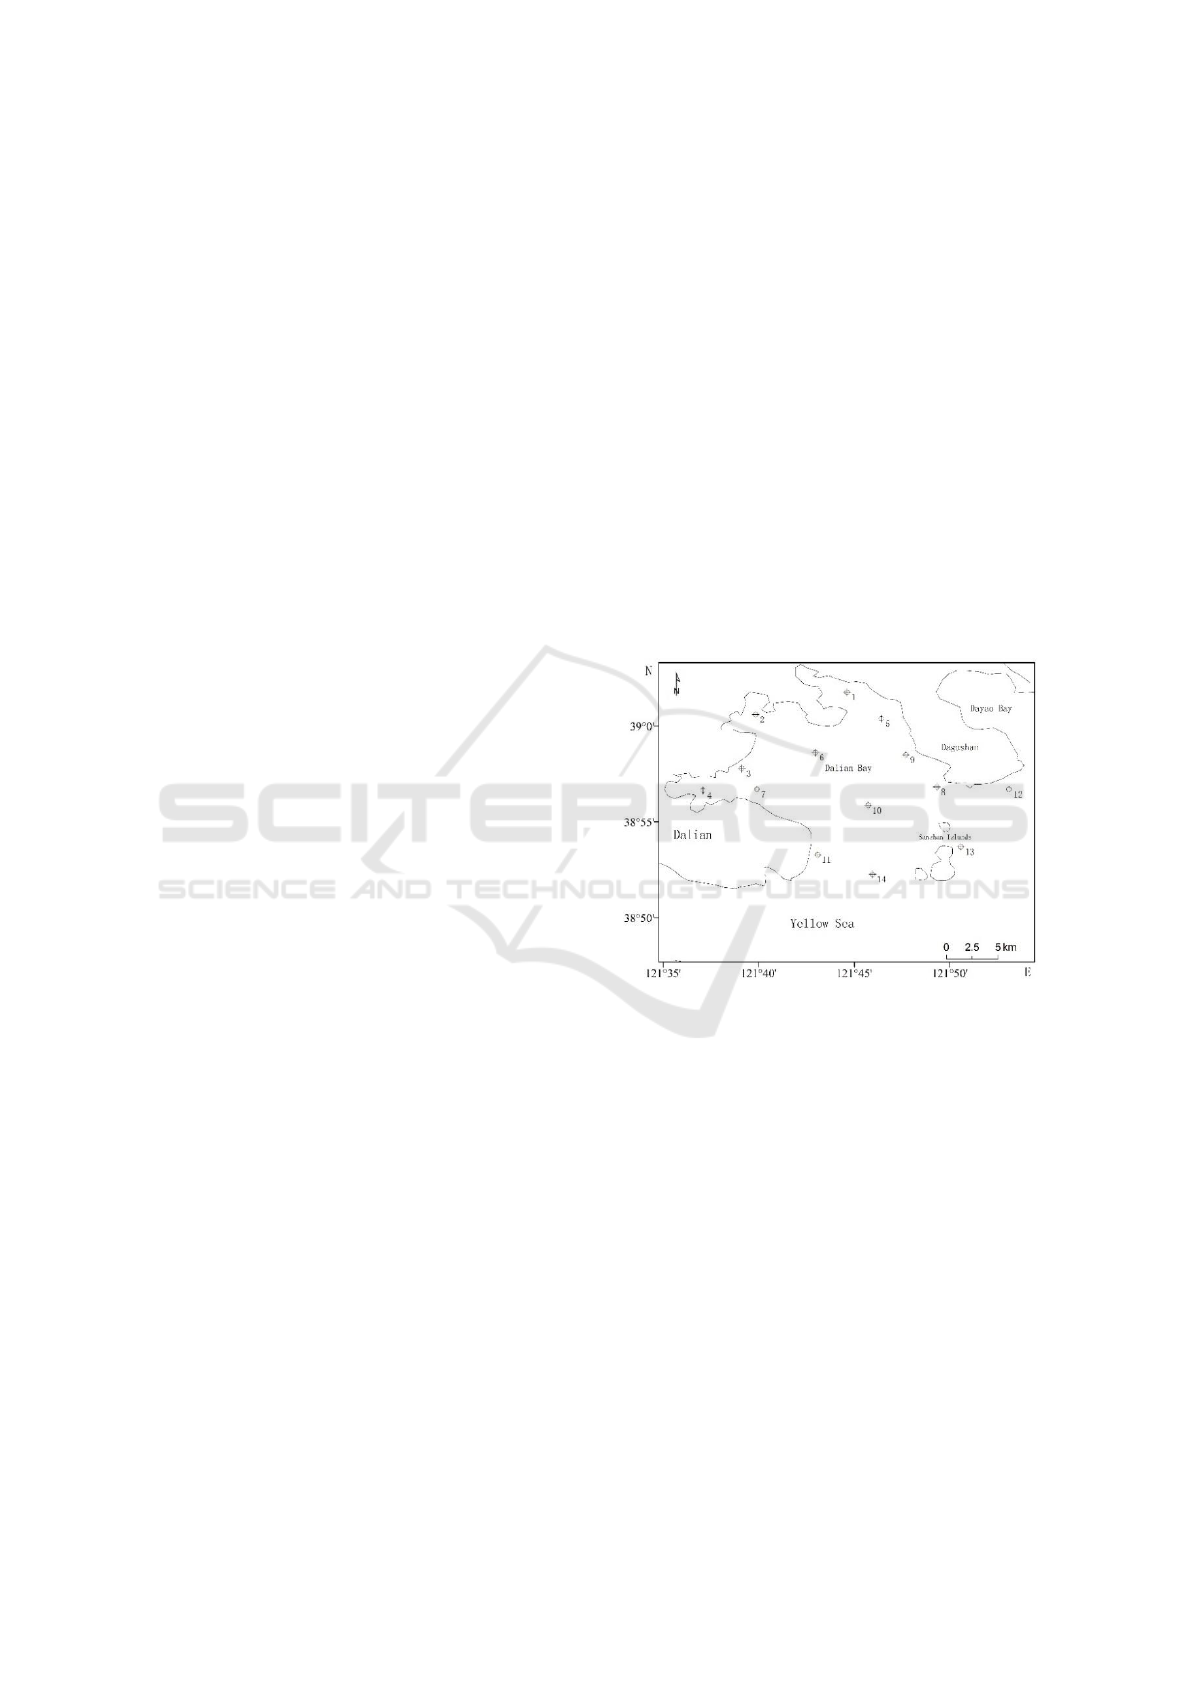
In May 2015, 14 sediment survey stations (Figure 1)
were set up in the Dalian Bay Area (Figure 1) to
sample surface sediments. The survey parameters
mainly included Cu, Pb, Zn, Cd, Hg, As, TOC and
petroleum. The sediment samples were collected
using the 0.025m
3
grab dredge, and the samples were
filled in the clean polyethylene bags with a bamboo
knife for the subsequent analysis of heavy metals
parameters. The samples were filled with the
aluminum lunch boxes for the analysis of TOC and
petroleum parameters. The heavy metal samples were
dried in the oven at 105 (the mercury, organic
carbon, and oil samples were dried at 45). The
samples were grinded in an agate bowl, and were
screened over 80-mesh nylon sieves (oil and organic
matter were screened over metal sieves) for the
analysis. The content of Cu, Pb, Zn and Cd in each
sampling station was determined by the atomic
absorption spectrophotometry. The content of Hg and
As were determined by the atomic fluorescence
spectrometry. The content of TOC was determined
with the potassium dichromate redox capacity
method, and the content of petroleum was determined
by the ultraviolet spectrophotometry.
Figure 1: The distribution of sampling stations.
2.3 The Assessment Method
2.3.1 Single-factor Pollution Index Method
The single-factor pollution index method is the
simplest method of evaluating the environmental
quality index. There is no dimension, and each
pollution factor is evaluated separately, and the
results of the standard-reaching rate/exceeding
standard rate, exceeding standard multiplier,
statistical multiplier and statistical representative
value are obtained by the statistical analysis (Luo et
al., 2016).
The mathematical calculation expression of the
single-factor pollution index is:
(1)
MEEP 2018 - The Second International Conference on Materials Chemistry and Environmental Protection
312
In the expression,
is the pollution index of
factor i, and
is the measuring content of factor i,
and
is the assessment standard value of factor i.
2.3.2 Subtitle Potential Ecological Risk
Index Method
The potential ecological risk index method was first
put forward by Swedish scholar Hakanson
(Hakanson, 1980), which could comprehensively
reflect the potential impact of heavy metals in the
sediments on the ecological environment (Ding et al.,
2005; Zhou et al., 2015) The Hakanson potential
ecological risk indexes and classification are shown
in Table 1.
The mathematical expressions of potential
ecological risk assessment on the heavy metals of
sediments, which were put forward by Hakanson,
were:
(2)
(3)
(4)
In the expressions,
is the pollution coefficient
of heavy metal element i, and
is the potential
ecological risk index of heavy metal element i, and
is toxicity coefficient, and
is the measuring value
of heavy metal content (mg∙kg
-1
),and
is the
reference value of assessment(mg∙kg
-1
),and is the
comprehensive potential ecological risk index of
heavy metal.
Table 1: Hakanson potential ecological risk indexes and
classification.
The Potential
ecological risk factor
( )
Ecological
risk pollution
degree
The Potential
ecological risk
index (RI)
Total
potential
ecological
risk degree
<40
Slight
RI<150
Slight
40< ≤80
Medium
150<RI ≤300
Medium
80< ≤160
Strong
300<RI ≤600
Strong
160< ≤320
Very strong
RI≥600
Very strong
≥320
Fortissimo
—
—
2.3.3 Principal Component Analysis Method
The Principal Component Analysis (PCA) is a
statistical analysis method of mastering the main
contradiction. It can reflect the most of the original
information of multiple variables by simplifying the
data (that is, using less comprehensive indicators
instead of a large number of indicators that have a
certain correlation). Many studies have proved that
the principal component analysis method can be used
to analyze the source of the elements and the main
affecting factors on the enrichment of the elements in
the sediments. Therefore, PCA is a helpful tool to
analyze and evaluate the source of pollutants in the
sediments by more and more researchers (Li et al.,
2006; Kzrysztof and Danuta , 2003).
3 RESULTS AND DISCUSSION
3.1 The Change Characteristics of
Heavy metals Elements Content
The average content values of heavy metals Cu, Pb,
Zn, Cd, Hg and As in the sediments in May 2015
were 34.62, 30.47, 106.50, 0.36, 0.12 and 11.10
mg·kg
-1
, respectively. The results (Table 2) showed
that the average contents of Cd and Hg in the surface
sediments of the Dalian Bay sea area were lower than
the background values of heavy metals in the national
coastal zone (Compiling Group of Environmental
Quality Investigation Report of the National Coastal
Zone Office,1989), while the average contents of
other investigating factors were higher than the
reference background values.
Table 2: The contents of heavy metals in the surface
sediments (mg∙kg
-1
).
Heavy metal
Content range
Average value
The background value
Cu
9.1~84.9
34.62
30
Pb
9.8~65.9
30.47
25
Zn
29.7~259
106.50
80
Cd
0.12~1.3
0.36
0.5
Hg
0.021~0.35
0.12
0.2
As
4.18~44.5
11.10
10
Compared with the reference background value,
the distribution of the stations whose had high
content of Cu, Pb, Zn and As were the same, and the
stations were mainly located in the offshore area of
the Bay top; The average value of Cu is 1.15 times of
the background value, and the highest value appeared
at station No. 4 (84.90 mg·kg
-1
); The average value of
Pb was 1.22 times of the background value, and the
highest value appeared at station No. 7 (65.90
mg·kg
-1
); The average value of Zn was 1.33 times of
the background value, and the highest value appeared
at station No. 4 (259.00 mg·kg
-1
);The average value
of As was 1.11 times of the background value, and
i
r
E
i
r
E
i
r
E
i
r
E
i
r
E
i
r
E
The Content Distribution and Pollution Assessment of Heavy Metals in the Surface Sediments of Dalian Bay
313
the highest value appeared at station No. 7 (44.50
mg·kg
-1
). For the station No. 4 (1.30 mg·kg
-1
) and
No. 7 (0.96 mg·kg
-1
), Cd content was higher than the
reference background value, while for all the other
stations, Cd content was lower than the reference
background value. For the station No. 1, No. 12 and
No. 13, Hg content was higher than the reference
background value in the North Sea Area of the bay
mouth. The content of Hg in the three stations was
0.35 mg·kg
-1
, which was 1.75 times of the reference
background value. Compared with the background
values of heavy metals in the national coastal zone,
the pollution level of heavy metals in the sediments of
Dalian Bay was relatively light, and the main
pollution factors were Cu, Pb and Zn, and the
exceeding standard rate was 50%.
3.2 The Pollution Risk Assessment of
Heavy Metals in the Surface
Sdiments
3.2.1 The Single-factor Pollution Index of
Heavy Metals in the Surface Sediments
In this study, heavy metals in the surface sediments of
Dalian Bay were evaluated with a single-factor
pollution index method by making comparison with I
standard of marine sediment quality. According to
Eq.1, the calculation results of the single-factor
pollution indexes of heavy metals were shown in
Table 3.
Table 3: The single-factor pollution index evaluation in
surface sediments.
Heavy
metals
Single
factor
The standard value of marine
sediment quality /mg.kg
-1
Cu
0.99
Ⅰ
Ⅱ
Ⅲ
Pb
0.51
≤35.0
≤100.0
≤200.0
Zn
0.71
≤60.0
≤130.0
≤250.0
Cd
0.71
≤150.0
≤350.0
≤600.0
Hg
0.59
≤0.50
≤1.50
≤5.00
As
0.55
≤0.20
≤0.50
≤1.00
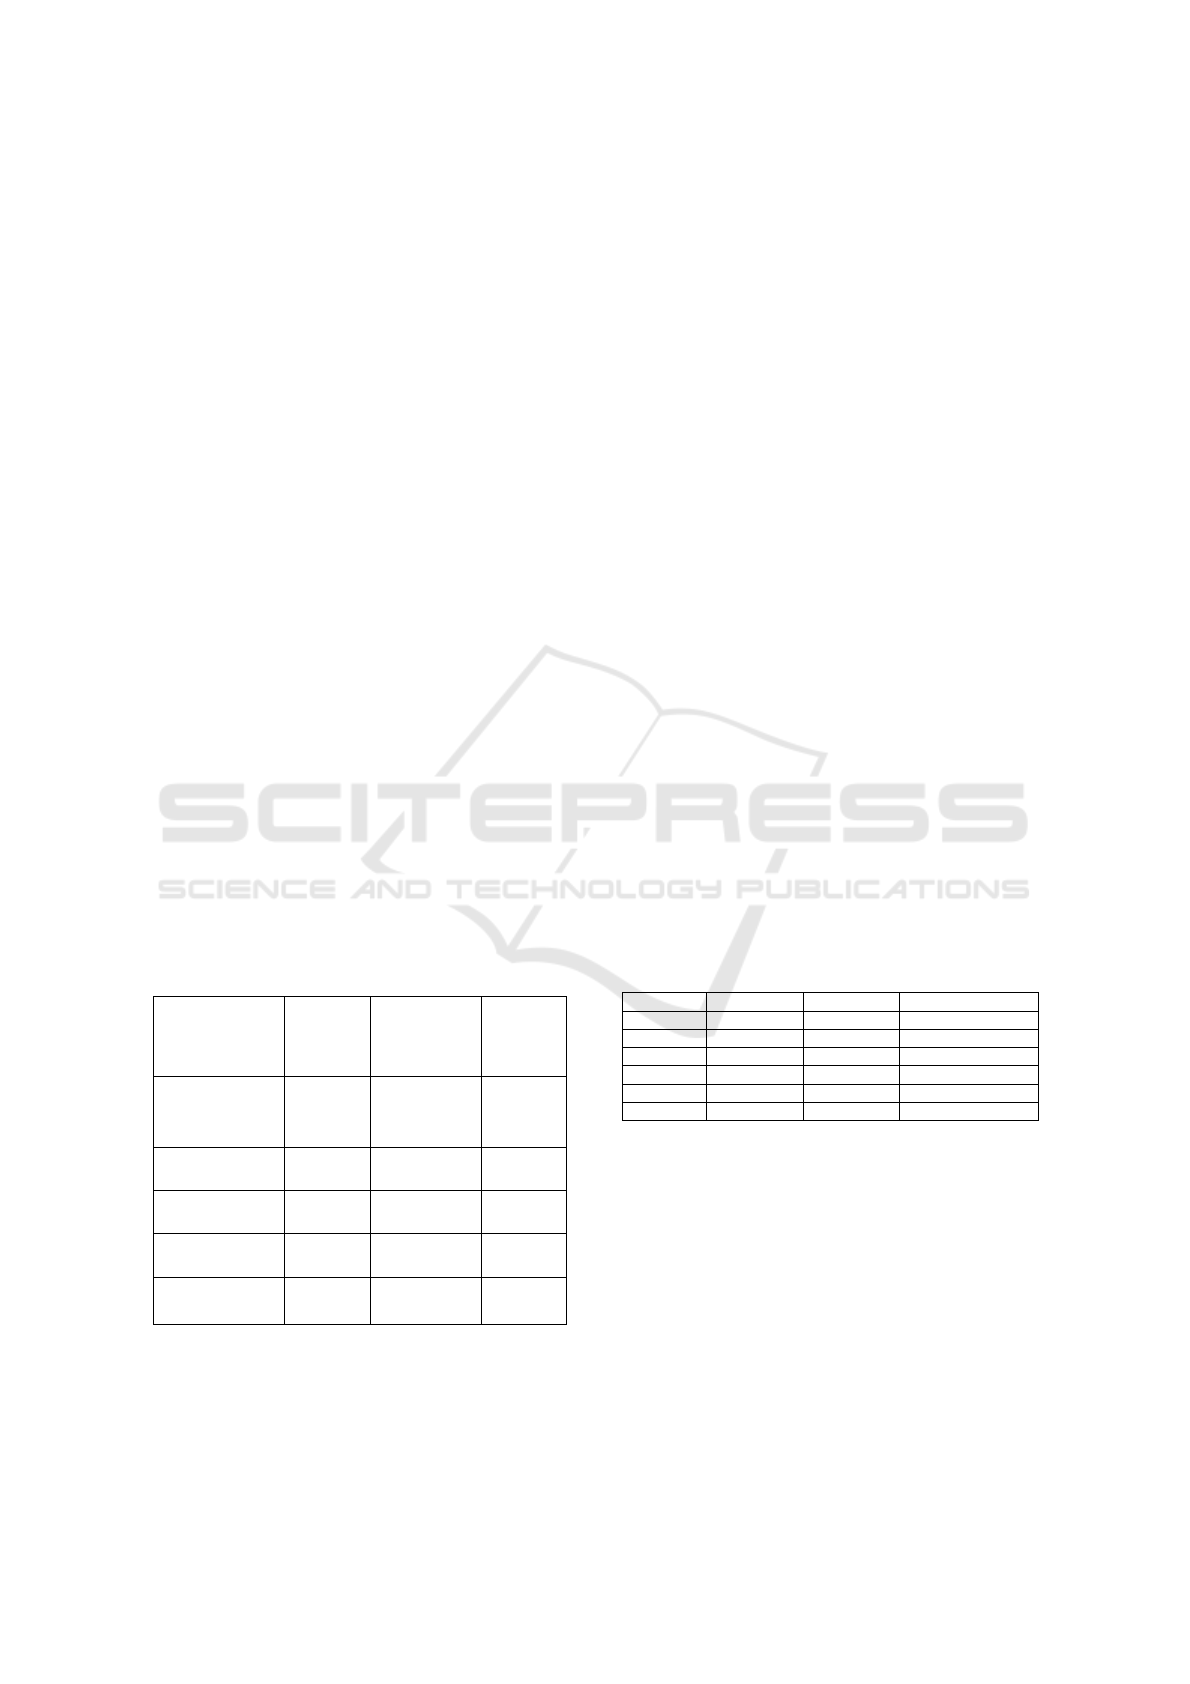
Figure 2: The boxplot of single factor pollution index
evaluation.
According to Table 3, the average values of the
single-factor pollution indexes of Cu, Pb, Zn, Cd, Hg
and As were less than 1. The evaluation value of each
heavy metal element met the I standard of marine
sediment quality. The pollution level of 6 heavy
metals was: Cu > Zn > Cd > Hg > As > Pb.
According to Figure 2, all the evaluation factors
had abnormal values in the individual station. In
general, each evaluation factor in the survey stations
could meet the I standard of marine sediment quality.
The sediments of Dalian Bay had not been
significantly polluted by the heavy metals, which was
consistent with the evaluation of heavy metal
pollution in the surface sediments of the Dalian Bay
conducted by Wang (Wang, 2012). Compared with
the I standard values of marine sediment quality, the
pollution level of heavy metals in the sediments of
Dalian Bay was relatively light, and the main
pollution factor was Cu, and the exceeding standard
rate was close to 50%.
3.2.2 The Potential Ecological Risk Index of
Heavy Metals in the Surface Sediments
In order to ensure that the selected background value
was close to the actual value of the sea area, the
background value of heavy metals in the national
coastal zone was used as the reference value in the
study, and the toxic response parameters of heavy
metal elements were shown in Table 4. According to
Eq. (2) - (4), the heavy metal potential ecological risk
index (
) and the comprehensive potential
ecological risk index (RI) were calculated in Table 5.
According to Table 5, the average content of Cu,
Pb, Zn, Cd, Hg and As were less than 40, and the
ecological risk of each single pollutant (
) lay at the
MEEP 2018 - The Second International Conference on Materials Chemistry and Environmental Protection
314
low level. The order of the potential ecological risk
index of the average content of 6 heavy metals was
Hg > Cd > As > Pb > Cu >Zn. The comprehensive
ecological risk index (RI, 69.28) was less than 150,
and the potential ecological risk grade of heavy
metals in the sea area was "relatively low".
Table 4: The background reference values and toxicity
coefficients of heavy metals in the sediments.
Factor
Cu
Pb
Zn
Cd
Hg
As
(mg/kg)
30
25
80
0.5
0.2
10
5
5
1
30
40
10
Table 5: The potential ecological risk index of heavy metals
in the sediments.
Statistical
value
The Potential ecological risk factor (
)
The Potential
ecological risk
index
(RI)
Cu
Pb
Zn
Cd
Hg
As
Minimum
value
1.52
1.96
0.37
7.20
4.20
4.18
33.40
Maximum
value
14.15
13.18
3.24
78.00
70.00
44.50
156.84
Average
value
5.77
6.09
1.33
21.39
23.60
11.10
69.28
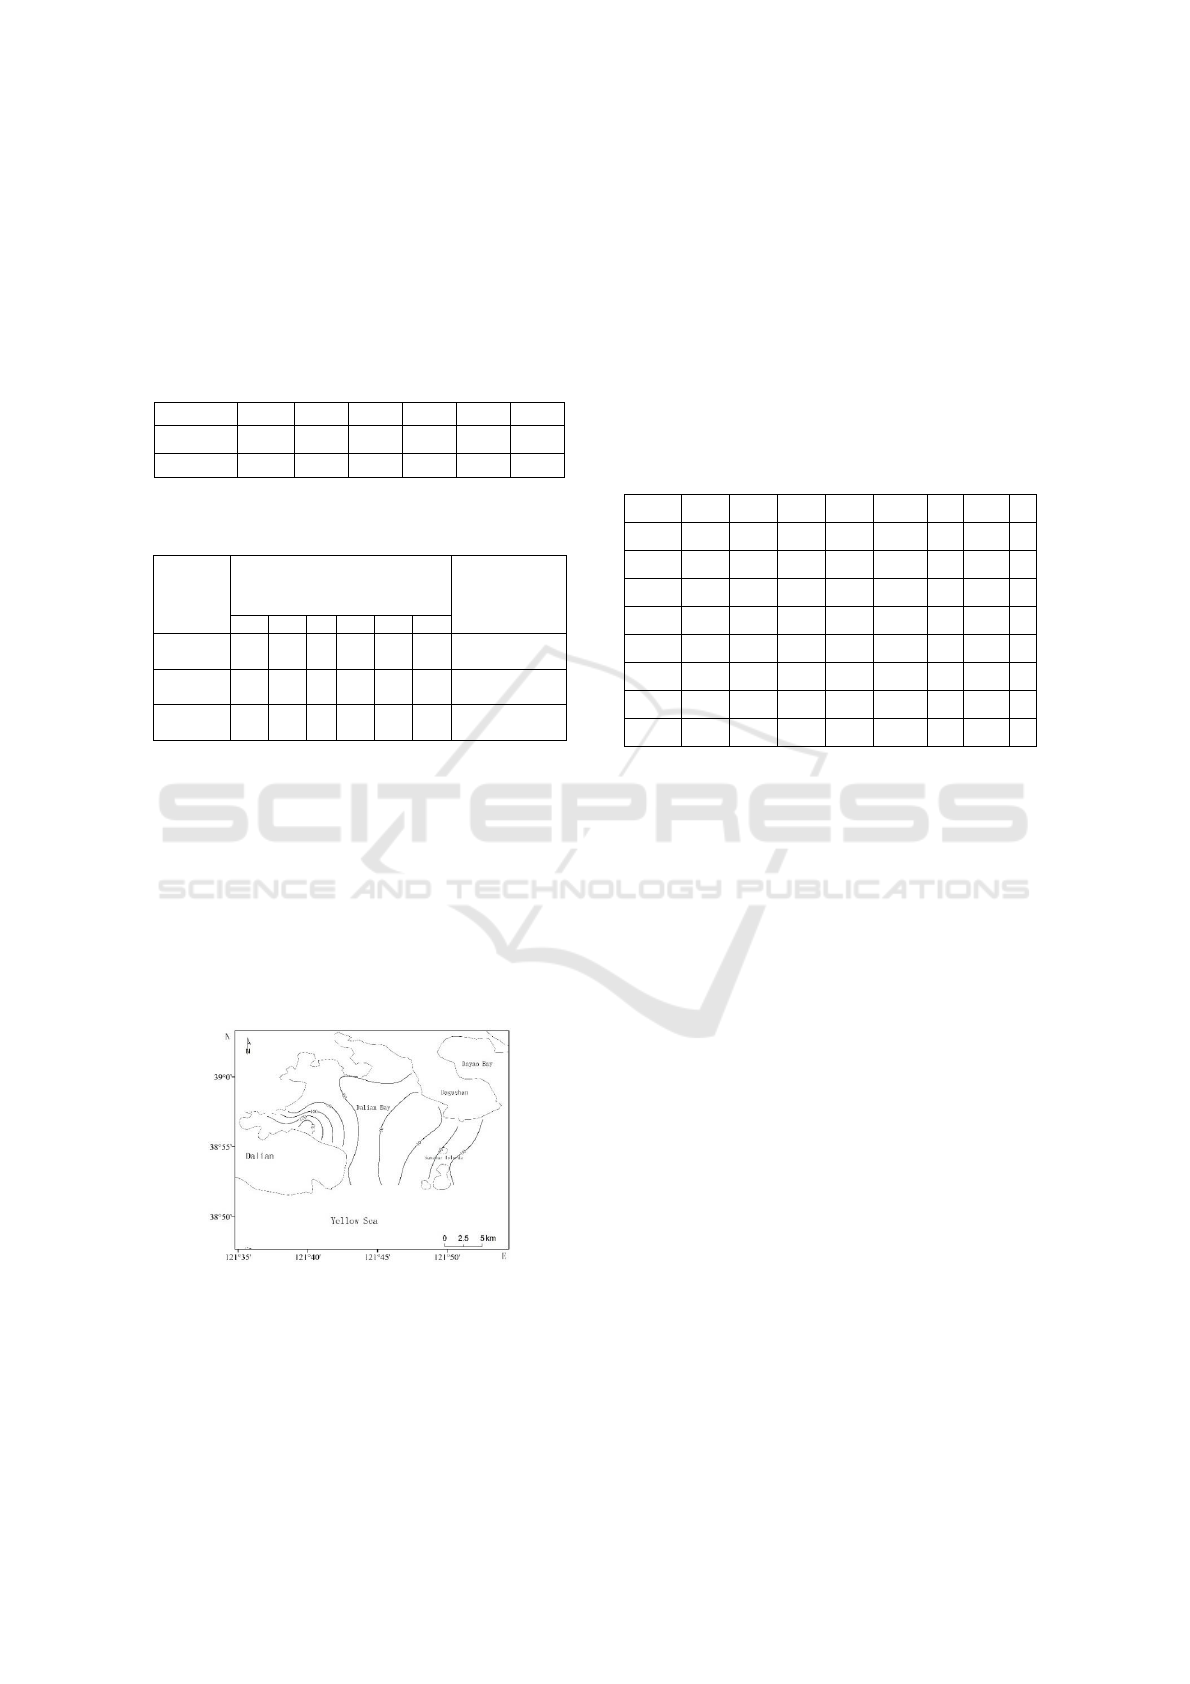
According to Figure 3, the spatial distribution of
potential ecological risk index in the Dalian Bay area
showed a SW (Southwest)-NE (Northeast) direction
(a low NE value and a high SW value). The relatively
high ecological risk index appeared in the south west
side of the bay of Dalian, and the low ecological risk
index in the bay area was lower, while the ecological
risk index of the sea area near Sanshan Island showed
a certain increase. Overall, the potential ecological
risk index of heavy metals in the surface sediments of
this area was basically the same.
Figure 3: The spatial distribution of potential ecological
risk index of heavy metals.
3.2.3 The Correlation Analysis of Heavy
Metals
The homology of heavy metals in the sediments
could be determined by the correlation analysis of
heavy metals. The change of TOC content and
composition was one of the important factors to
determine the distribution of heavy metals in the
surface sediments (Borg and Jonsson, 1996) The
Pearson correlation analysis of heavy metal contents
in 6 surface sediments with the content of TOC and
petroleum was carried out in this study. The results
were shown in Table 6.
Table 6: The correlation coefficients among heavy metals
and TOC in the sediments.
Category
C
Cu
C
Pb
C
Zn
C
Cd
C
Hg
C
As
C
TOC
C
Oil
C
Cu
1
C
Pb
0.913
**
1
C
Zn
0.992
**
0.899
**
1
C
Cd
0.959
**
0.830
**
0.951
**
1
C
Hg
-0.460
-0.451
-0.508
-0.312
1
C
As
0.863
**
0.817
**
0.811
**
0.838
**
-0.168
1
C
TOC
0.631
*
0.487
0.682
**
0.542
*
-0.505
0.346
1
C
Oil
0.752
**
0.533
*
0.804
**
0.747
**
-0.515
0.399
0.779
**
1
Note: * Correlation is significant at the 0.05 level
(2-tailed);** Correlation is significant at the 0.01 level
(2-tailed).
According to Table 6, there was a positive
correlation between Cu, Pb, Zn, Cd and As, and the
correlation coefficient was large, which indicated that
they had some homology. There was a strong
correlation between TOC and Cu, Cd and Zn, which
indicated that the heavy metals of the sea water in the
study area could be chelated through the surface
adsorption of TOC, and the generated metal organic
complexes were removed from the water and
adsorbed in the particles of the surface sediments
(Qiu et al., 2005; Reuter and Perdue, 1977). There
was a strong correlation between petroleum and Cu,
Pb, Zn and Cd, indicating that petroleum might be the
main source of Cu, Pb, Zn and Cd, and petroleum had
a certain influence on the distribution of Cu, Pb, Zn
and Cd.
3.2.4 The Source Analysis of Heavy Metals
Based on PCA Method
According to the analysis of section 3.2.3, there was a
strong correlation between the heavy metal elements
in the surface sediments of Dalian Bay. Through the
principal component analysis (shown in Table 7),
86.87% of the total information of 6 pollutants , TOC
and petroleum in the surface sediments of Dalian bay
could be reflected by 2 principal components
i
r
E
The Content Distribution and Pollution Assessment of Heavy Metals in the Surface Sediments of Dalian Bay
315
(eigenvalues: 5.77+1.18=6.95 variables), that is, the
first 2 principal components had been able to reflect
most of the data.
Table 7: The main calculated results of principal
component analysis (PCA).
Component
First principal
component
Second
principal component
Total
5.77
1.18
% of Variance
72.12
14.75
Cumulative %
72.12
86.87
Cu
0.988
0.134
Pb
0.894
0.232
Zn
0.996
0.042
Cd
0.939
0.225
Hg
-0.540
0.614
As
0.805
0.522
TOC
0.720
-0.500
Oil
0.814
-0.396
The contribution rate of the first principal
component was 72.12%, which showed that the
factor variable had high positive load on the content
of Cu, Pb, Zn, Cd and As, and the load of the first
principal component on TOC was 0.720, and the high
load on TOC showed the importance of the organic
matter as the metal ion binding, and from Table 6 and
7, 3 heavy metals (Cu, Zn, Cd) and TOC had a
significant positive correlation. It could be concluded
that the release of metal ions accompanied by the
degradation of organic matter is one of the sources of
heavy metals in the sediments. Therefore, the first
principal component mainly characterized the
contribution of organic matter to the source of heavy
metals in the sediments; The first principal
component on the petroleum was 0.814, and from
Table 6 and 7, Pb, Zn and Cd had a significant
positive correlation with petroleum, and the oil had a
high load in the principal component analysis, which
indicated that oil was one of the important sources of
heavy metal Cu, Pb, Zn and Cd elements. Therefore,
the first principal component mainly characterized
the contribution of organic matter and oil to the
source of heavy metals in the sediments, which was
consistent with the conclusion of the correlation
analysis of the heavy metals in the section 3.2.3.
Through consulting literature and field investigation,
it was found that the sedimentary environment of
Dalian Bay was affected by the pollution of the
surrounding chemical plant and the petroleum
pollutants in the sediments of the coastal waters.
Therefore, the contribution of heavy metals such as
Cu, Pb and Zn to the first principal component could
reflect the actual significance of the first principal
component, that is, the effect of the industrial
pollutant discharge on the marine sediments.
According to the correlation analysis of pollutants in
the section 3.2.3, we could found that there was a
strong correlation between Cu, Pb, Zn, Cd and As. It
was known that the first principal component mainly
dominated the source of heavy metals in the
sediments. The load of second principal components
on Hg and As contents could be seen from Table 7, of
which Hg is the highest (0.614). As Hg and As
elements were less correlated with TOC and
petroleum, it was deduced that Hg and As were less
likely to exist as the binding compounds of organic
and petroleum in the sediments. Therefore, the
industrial pollutant discharge in the area had little
influence on the distribution of the Hg and As
content.
4 CONCLUSIONS
Through the study of the distribution characteristics
of Cu, Pb, Zn, Cd, Hg and As in the surface sediments
of Dalian Bay in May 2015, the obtained main results
were as follows:
(1) The average content of Cd and Hg in the
surface sediments of Dalian Bay was lower than the
reference background value. The average contents of
other investigation factors were higher than the
reference background values. Compared with the
reference background values, the spatial distribution
of stations containing the highest content of Cu, Pb,
Zn and As was the same, and the stations were mainly
located in the offshore area of Bay top. Compared
with the background values of heavy metals in the
national coastal zone, the pollution level of heavy
metals in the sediments of Dalian Bay was relatively
light. The main pollution factors were Cu, Pb and Zn,
and the exceeding standard rate is 50%.
(2) The evaluated results of marine sediment
quality with the single-factor pollution index method
showed that the average content of Cu, Pb, Zn, Cd,
Hg and As could meet the I standard of marine
sediment quality. The potential ecological risk index
of Dalian Bay was "relatively low", and the order of
the potential ecological risk indexes of the average
content of 6 heavy metal elements was: Hg > Cd > As
> Pb > Cu > Zn. The spatial distribution feature
showed a SW-NE direction (a low NE value and a
high SW value). In general, the potential ecological
risk index of heavy metals in the surface sediments of
Dalian Bay had little difference as a whole.
MEEP 2018 - The Second International Conference on Materials Chemistry and Environmental Protection
316

(3) The correlation analysis of heavy metals in
surface sediments showed that there was a positive
correlation between Cu, Pb, Zn, Cd and As in the
surface sediments, and the correlation coefficient was
larger, indicating that they had a certain homology.
There was a positive correlation between TOC and 3
heavy metals (Cu, Zn and Cd), while there was a
correlation between petroleum and 4 heavy metals
(Cu, Pb, Zn and Cd). TOC and petroleum had a
certain influence on the distribution of heavy metals.
The main sources of heavy metal pollution in the
marine sediments were further studied with the
principal component analysis method, and the
contribution rate of the first 2 principal components
was 86.87%. According to the correlation analysis,
the main source of Cu, Pb, Zn and Cd was the
industrial pollutant discharge.
REFERENCES
Alam, A. R., Hossain, A. B. M., Hoque, S., & Chowdhury,
D. A., 2018. Heavy Metals in Wetland Soil of Greater
Dhaka District, Bangladesh. Pollution, 4(1), 129-141.
Bao, Y. E., 1991. Annals of China Gulf[M], China Ocean
Press. Beijing, 1st edition.
Borg, H., Jonsson, P., 1996. Large-scale metal distribution
in Baltic Sea sediments.Marine Pollution Bulletin, 32:
8-21.
Chen, J., Wang, Y. X., 2016. Effects of the coastline
changes on the hydrodynamic condition in the Dalian
Bay. Marine Science Bulletin. 35(3): 351-359.
Chen, M., Cai, Q. Y., Xun, H. et al., 2015. Research
Progress of Risk Assessment of Heavy Metals
Pollution in Water Body Sediments. Ecology and
Environmental Sciences. 24(6): 1069-1074.
Compiling Group of Environmental Quality Investigation
Report of the National Coastal Zone Office,1989. The
Report on the Comprehensive Survey of Coastal and
Marine Resources in China- Environmental Quality
Investigation Report, China Ocean Press. Beijing.
Ding, X. G., Ye, S. Y., Gao, Z. J., 2005. Methods of Heavy
Metal Pollution Evaluation for Offshore Sediments.
Marine Geology Letters, 21(8): 31-36.
Gurumoorthi, K., & Venkatachalapathy, R., 2016. Spatial
and seasonal trend of trace metals and ecological risk
assessment along Kanyakumari coastal sediments,
southern India. Pollution, 2(3): 269-287.
Hakanson, L. 1980. An ecological risk index for aquatic
pollution control: a sediment ological approach. Water
Research, 14(8): 975-1001.
Islam, S. M., Bhuiyan, M. A. H., Rume, T., &
Mohinuzzaman, M., 2016. Assessing heavy metal
contamination in the bottom sediments of Shitalakhya
River, Bangladesh; using pollution evaluation indices
and geo-spatial analysis. Pollution, 2(3): 299-312.
Krika, A., & Krika, F., 2017. Evaluation of the status of
heavy metal pollution in surface water and sediments of
the Nil River (North Eastern Algeria). Pollution, 3(2):
301-310.
Kzrysztof, L., Danuta, W., 2003. Application of principal
component analysis for the estimation of source of
heavy metal contamination in surface sediments from
the Rybnik Reservoir.Chemosphere, 51: 723-733.
Li, Q., Yan, Q. L., Li, H. B. et al., 2016. Distribution of
viriobenthos in surface sediment in Dalian and Dayao
Bay.Marine Environmental Science. 35(2): 184-189
Li, Y., Yu, Z. M., Song, X. X., 2006. Application of
Principal Component Analysis(PCA)for the Estimation
of Source of Heavy Metal Contamination in Marine
Sediments. Environmental Sciences. 27(1): 137-141.
Liu, C. T., Wang, L. J., Zhang, Y. F. et al., 2017. Speciation
and bioavailability of mercury in surface sediments of
Dalian Bay. Journal of Dalian Ocean
University.32(5):603-610.
Luo, F., Wu, G. R.,Wnag, C. et al., 2016. Application of
Nemerow pollution index method and
Single-factorevaluation method in water quality
evaluation. Envoronement and Sustainable
Development.5:87-89.
Ma, X. D., Lin, Z. S., Wang, L. J. et al., 2016. Analysis of
major pollution factors in sea water and contribution of
pollution sources in Dalian Bay .Marine Environmental
Science. 35(3):417-421.
Mallick, D., Islam, M., Talukder, A., Mondal, S., Al-Imran,
M., & Biswas, S., 2016. Seasonal variability in water
chemistry and sediment characteristics of intertidal
zone at Karnafully estuary, Bangladesh. Pollution, 2(4),
411-423.
Qiu, Y. W., Zhu, L. S., Li, M. Q., 2005. Distribution
characteristics of heavy metals and grain size of
sediments from Hailing Bay,China.Marine Science
Bulletin, 17(1):69-76.
Reuter, J. H., Perdue, E. M., 1977. Importance of heavy
metal-organic matter interactions in nature waters.
Geochimica et Cosmochimica Acta , 41:325-334.
Vaezi, A. R., Karbassi, A. R., Habibzadeh, S. K., Heidari,
M., & ValikhaniSamani, A. R., 2016. Heavy metal
contamination and risk assessment in the riverine
sediment. Indian Journal of Geo-Marine Sciences, 45
(8), 1017-1023.
Wang, J. H., 2012. Research on Heavy Metal Pollution and
source of material analysis in sediment of Dalian
Bay.Liaoning: Dalian Maritime University.
Wang, S. F., Wei, M. R., Lin, J. X., 2002. The Evolution of
Heavy Metal Pollution During Last Hundred Years in
the Dalian Bay. Earth Science Frontiers. 9(3): 209-215.
Zhang, X. R., Zhang, Y.,Ye, Q. et al., 2012. Environment
quality of Liaodong bay and pollution evolution of
heavy metals. Marine Geology & Quaternary Geology.
32(2): 21-29.
Zhang, Y. F., Tian, J., Yang, S. et al., 2015. Distribution
and structure of nutrients in seawater and ecological
responses in Dalian Bay. China Environmental
Science.35(1):236-243.
The Content Distribution and Pollution Assessment of Heavy Metals in the Surface Sediments of Dalian Bay
317

Zhou, X. B., Mei, P. Y., Peng, L. L. et al., 2015. Contents
and Potential Ecological Risk Assessment of Selected
Heavy Metals in the Surface Sediments of Bohai Bay.
Ecology and Environmental Sciences, 24(3): 452-456.
MEEP 2018 - The Second International Conference on Materials Chemistry and Environmental Protection
318
