
A Molecular Dynamics Simulation of the Influence of Defect on the
Melting of Amorphous Silica
Haijun Ji
1
, Xiaofang Wang
1
, Huiran Li
1*
, Zhiyuan Li
1
and Xinlu Cheng
2, 3
1
Equipment Support Department, Logistics University Of People's Armed Police Force, No.1, Huizhi Ring Road , Dongli
District, Tianjin, China
2
Institute of Atomic and Molecular Physics, Sichuan University, No.24, South Part of First Ring Road , Wuhou District,
Chengdu, China
3
Key Laboratory of High Energy Density Physics and Technology of Ministry of Education, Sichuan University, No.24,
South Part of First Ring Road , Wuhou district, Chengdu, China
Keywords: Molecular dynamics simulation; The vacancy cluster; Amorphous silica
Abstract: In this paper, the influence of defect on the melting process of amorphous silica has been studied using
molecular dynamics simulations. Using the bond evolution, it can be found that the melting process is
intimately related to the formation of defect. Meanwhile, there are some differences in the melting process
between the defected and undefected amorphous silica models. In addition, the pre-existing defect (void)
contributes to the damage of SiO
2
materials. And the glass transition temperature can be effectively reduced,
when the defects meet certain concentration.
1 INTRODUCTION
Silica is an important material in the technical
engineering. Vitreous silica is the most usual
structure among the various configuration states. For
this reason, amorphous silica (Bates, 1972; Huff et
al., 1999; Takada et al., 2004; Zachariasen, 1932;
Afify et al., 2017; Peek et al., 2018) has been widely
investigated. For instance, through the experimental
observation, Zhang et al. (Zhang, et al., 1993)
studied the effects of pressure on the melting of
SiO
2
, and provided the glass transition temperatures
under different pressures. As for the theoretical
research, the molecular dynamics (MD) has been
used to produce the vitreous silica by direct heating
β-crytobalite (El-Sayed et al., 2013; Mukhopadhyay
et al., 2004; Roder et al., 2001; Vollmayr et al.,
1996). Hoang (Hoang et al., 2007) investigates the
structures and thermodynamic properties for the
varisized vitreous silica using MD method.
When the silica material exposes to the radiation
(Gusev, 2000; Kurkjian, 2000; Kang et al., 2008;
Blöchl, 2000; Kuo et al., 2006; Zhang et al., 2008;
Malavasi et al., 2006), the vacancies may be formed
in the bulk. In turn the vacancies can lead to the
degradation of material properties. It has been found
that the motion of defects in the SiO
2
material might
cause serious device problems (Fowler, et al., 1997).
Luo et al. (An et al., 2006; Luo et al., 2007) pointed
that defect-induced densification of silica glass is the
dominant mechanism for densification. And the
vacancies can induce densification of silica glass
(An et al., 2006; Luo et al., 2007). In addition,
according to the previous reports, if there is a
sufficient concentration, vacancies tend to cluster
and form voids (Zheng et al., 2006; Weber et al.,
1998). Therefore, the silica with various vacancies
attracts a lot of attention and has been studied using
the MD method (An et al., 2006; Luo et al., 2007;
Mota et al., 2008). We can find a lot of work, which
were performed to investigate the materials with
voids in the past years (Chan and Elliott, 1991;
Mitra and Hockney, 1980). Malavasi et al.
(Malavasi et al., 2006) studied void size distribution
in silica glass structures.
In line with this, we focus on investigating the
effect of defect on the melting process of silica
glass. Especially, the effect of the particular defect,
vacancy cluster (void), is considered in our study.
Because the reactive force field (ReaxFF) (van Duin
et al., 2001) developed by Duin (van Duin, 2009) is
the tailored force field for a particular chemical
reaction (Rimsza et al., 2018; Chenoweth et al.,
2008). ReaxFF has been able to provide reasonable
accuracy for observable various phenomena,
Ji, H., Wang, X., Li, H., Li, Z. and Cheng, X.
A Molecular Dynamics Simulation of the Influence of Defect on the Melting of Amorphous Silica.
DOI: 10.5220/0008187501930198
In The Second International Conference on Materials Chemistry and Environmental Protection (MEEP 2018), pages 193-198
ISBN: 978-989-758-360-5
Copyright
c
2019 by SCITEPRESS – Science and Technology Publications, Lda. All rights reserved
193

including the properties of the SiO2 polmorphs
(Cowen et al., 2016), oxidation of silicon carbide
(Newsome et al., 2012), catalytic selective oxidation
processes (Chenoweth et al., 2008) and the effect of
an applied electric field (Assowe et al., 2012; Wood
et al., 2004; Gubbels- Elzas et al., 2014; Hattori et
al., 2012). Meanwhile, the ref. (Yu et al., 2016)
points that the ReaxFF can offer a realistic
description of silica glass. Considering all of these,
MD and the ReaxFF are applied in our simulations.
In order to study the influence of void, we construct
the models with pre-existing structural defect for
amorphous silica, respectively. With the purpose of
revealing the insightful physical and chemical
details, detailed structural analyses are provided in
the melting process.
2 CALCULATION METHOD
The initial structure of amorphous silica used in our
MD simulations is presented in Figure 1. The angle
parameters of the used primitive cell are α = β = γ =
90˚, and the length parameters are a=b=c = 21.39486
Å. The density of the intact construction is 2.20
g/cm
3
. The simulation box of amorphous silica is
constructed as 2a × 2b × 2c superlattice (with 5184
atoms). On the basis of ref. (An et al., 2006)and
(Luo et al., 2007), the defective models are
constructed by removing atom clusters. The atom
cluster with 21 atoms is removed from the intact
amorphous silica to construct the model with a void.
For convenience, the defected structure is labeled as
a-defect1. While the atom cluster with 76 atoms are
also eliminated to build the other defected silica,
which is named as a-defect2. Totally, there are two
kinds of defected silica (a-defect1 and a-defect2)
constructed, which has the defect concentration
0.41% and 1.47%, respectively. Moreover, each of
the void is located near the center of the system.
Additionally, the intact amorphous silica is defined
as a-intact. To clearly understand the progress of
structural damaging, the constructions are divided
into three regions from inside to outside, which can
be seen in Figure 1. For the defected models, the
introduced vacancy cluster is located in the region 1.
Figure 1: Schematic of the simulated system amorphous
silica, the yellow and red spheres indicate Si and O atoms,
respectively.
Considering the capability of the description of
silicon oxides, the force field parameters expanded
by Newsome et al. (Newsome et al., 2012) are used
in our work. To verify the feasibility of the force
field parameters, the Si−O bond of β-crystobalite is
calculated. The average length for the initial Si−O
bond provided by the ReaxFF is 1.58 Å. It is in
agreement with the length, 1.55 Å, in the idealized
structure. Therefore, the force field parameters
expanded by Newsome et al. are suited for the study
of the SiO
2
materials.
At the same time, three dimensional periodic
conditions are applied in all of the MD simulations,
which are performed with the LAMMPS software
package (Plimpton, 1995). During the entire
simulation process, the time step is set as 0.2 fs to
integrate the equations of motion. As for the
ensemble, both of the canonical (NVT) ensemble
and micro-canonical (NVE) ensemble are used in
our calculations. Firstly, the configurations are
equilibrated at 300 K for 10 ps using the canonical
(NVT) ensemble. Then the temperature for all of the
systems experiences a linear growth, and the heating
rate is 1.675 K/ps. The temperature is controlled
using a Berendsen thermostat (Berendsen et al.,
1984), with a temperature damping constant of 10fs.
The micro-canonical (NVE) ensemble is used in the
heating process. In this case, we can make a
comparison in the potential energy between different
models under the same thermal growth rate and
target temperature. To characterize the progress in
detail, we make an analysis of bonds evolution. At
the same time, the root mean square displacement
(RMSD) is also computed during the simulation.
MEEP 2018 - The Second International Conference on Materials Chemistry and Environmental Protection
194
3 RESULTS AND DISCUSSION
3.1 The Bond Evolution
It is well known that the melting of solid state
requires to break structural bonds, accompanied by
the formation of new bonds. Since the bonds are
localized, the number of bonds directly reflects the
formation and dissociation of bonds (the bonding
dynamic). It is necessary to make a detailed analysis
of bond evolution in melting process. When the
distance between two atoms is more than 3 Å, there
is almost no interaction. Considering this, it is can
be regarded as a Si–Si or O–O bond, if the distance
of two Si atoms or two O atoms is less than 3 Å. On
the basis, the changes of Si–Si and O–O bonds are
analyzed in the simulations.
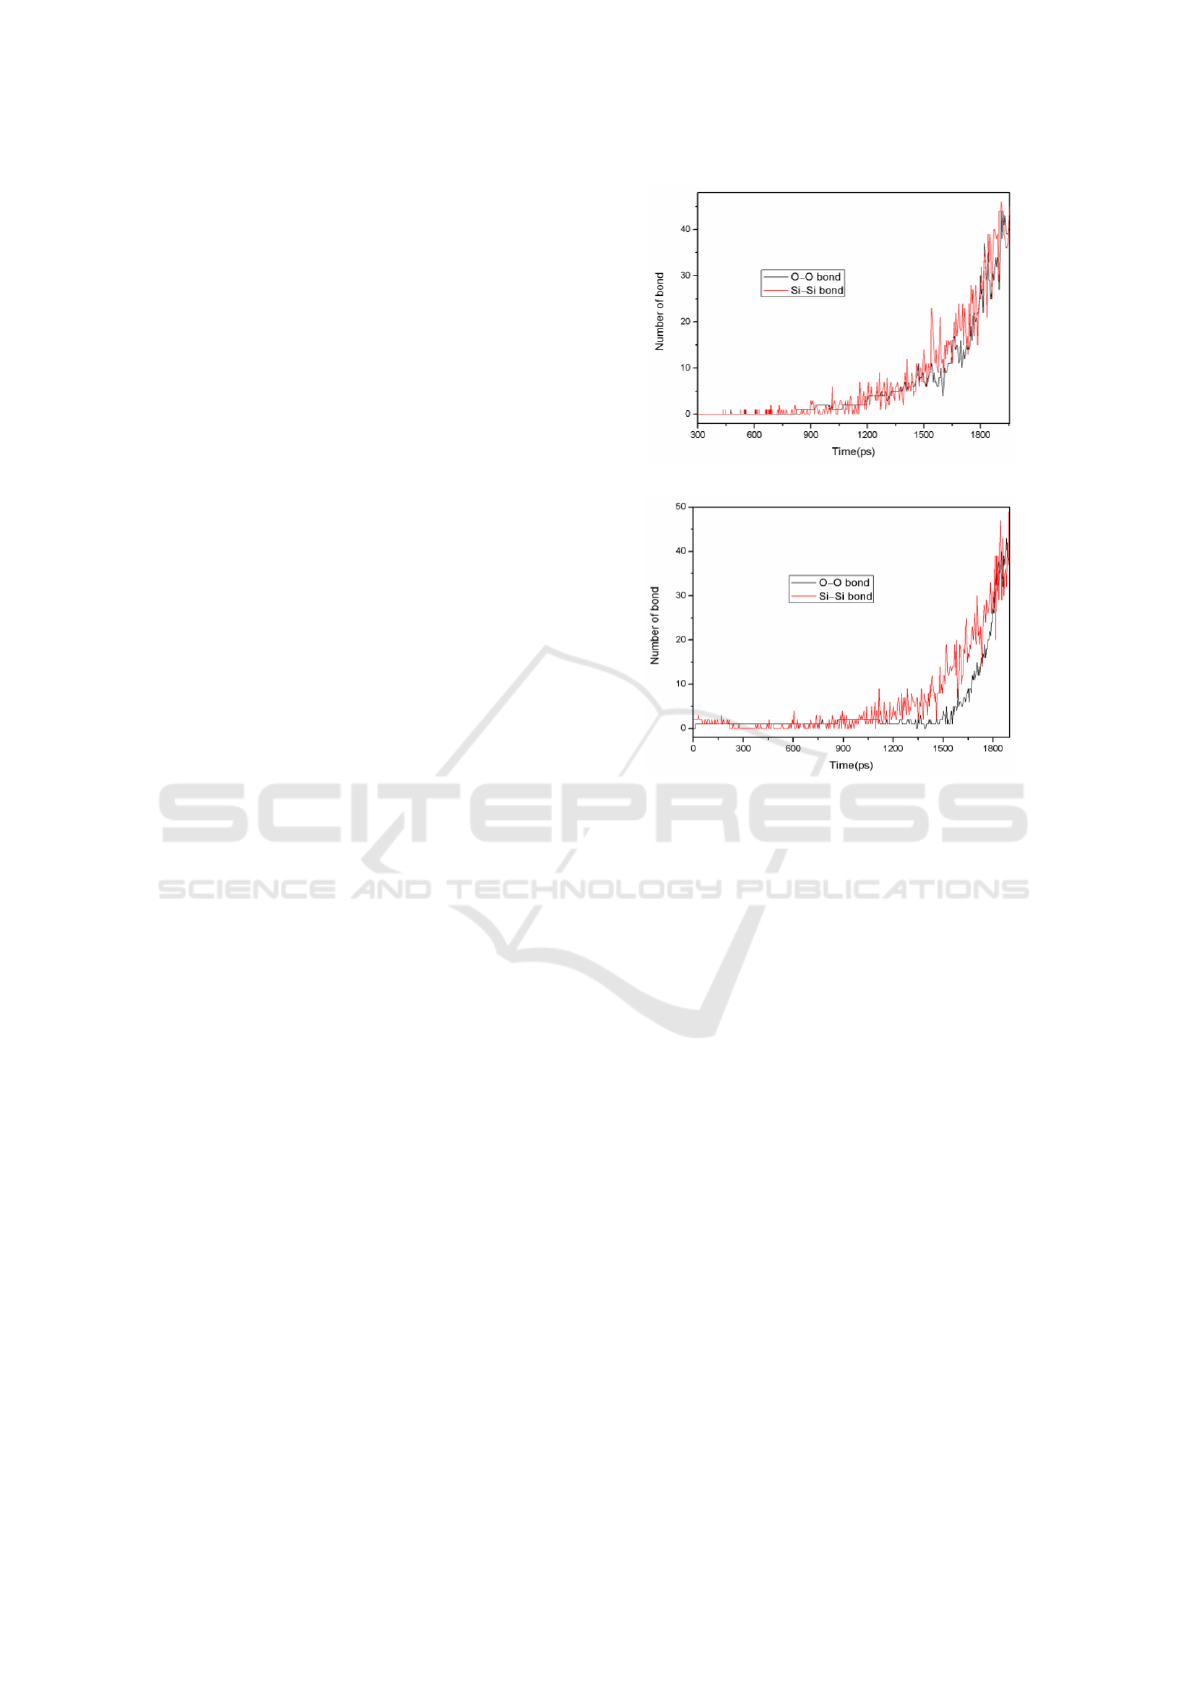
Figure 2 displays the calculated number of Si–Si
and O–O bonds in amorphous silica over time. From
Figure 2(a), it can be noted that there are no Si–Si
and O–O bonds in the initial intact silica. Both of
them appear as individually new bonds in the
melting process. Then, the number of the new bonds
tends to increase with the time running. It reveals
that the damage of the bulk of amorphous silica
stems from the formation of individual new bonds in
the heating process.
Meanwhile, the evolution of Si–Si and O–O
bonds gives an inspection for the occurrence of
structural defects, such as vacancy defect and
interstitial defect. We notice that the formation of
Si–Si bond is earlier than that of O–O bond. Then it
explains that Si atom escapes from its initial lattice
site at first. However, the number of bond
experiences a fluctuation with the time running,
which illustrates the newly formed bonds can also
be broken. The reason may be that the escaped
atoms are free and randomly displace. During the
diffusion, they might bond to the other atoms except
for their initial first-neighbour atoms.
Correspondingly, the Si–Si and O–O bonds are
formed and broken. As a result, various defects are
involved into the melting material. We can also
obtain the melting mechanism, the melting process
is intimately related to the individual defect.
(a)
(b)
Figure 2: The number of Si−Si and O−O bonds over time
in the intact amorphous silica and (b) the a-defect2.
According to Figure 2(b), there is a Si–Si bond
in a-defect2, when it begins to heat the material. It
accounts that the Si–Si bond exists in equilibrium
state of a-defect2. At the same time, the increasing
of Si–Si bond is faster than that of a-intact. And the
O–O bond appears once the heating time reaches13
ps. Obviously, the appearance of O–O bond is
earlier than the undefected structure. It suggests that
the atoms are less stable and the old bonds (Si–O
bonds) are more easier to be destroyed, when the
void is introduced into amorphous silica. It also
demonstrates that the defect helps to destroy the
material. Additionally, Similar to the case of intact
amorphous silica, newly formed Si–Si and O–O
bonds also can be broken in heating process.
A Molecular Dynamics Simulation of the Influence of Defect on the Melting of Amorphous Silica
195
(a)
(b)
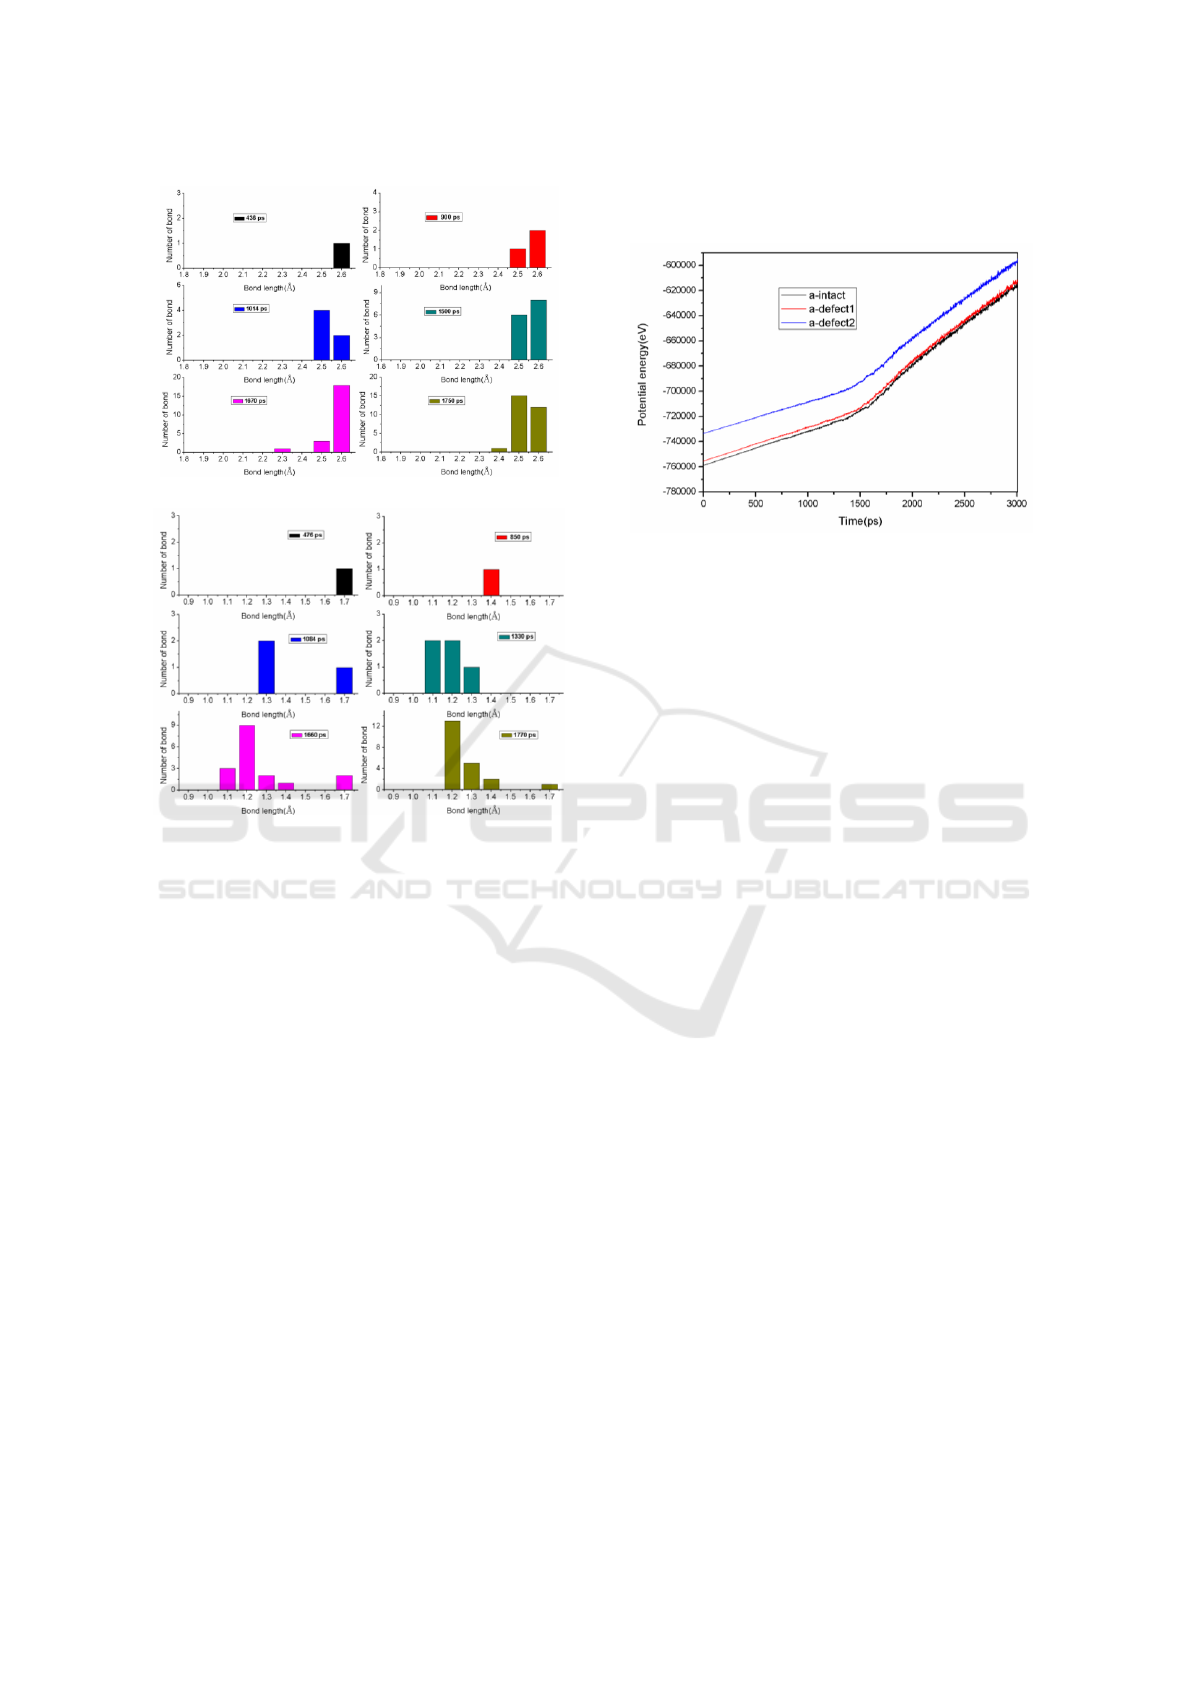
Figure 3: At some chosen time, the distribution of bond
length, (a) Si−Si and (b) O−O, in the melting process of
intact amorphous silica.
The bond distribution for intact amorphous silica
demonstrates that the Si–Si and O–O bonds are
generated with a long bond length at the initial stage
(in Figure 3). With the time running, there is an
expansion in the bond distribution. After some time,
the Si–Si bond lengths are mainly around 2.5 Å−2.6
Å. And the bond lengths of O–O concentrate in the
range from 1.2 Å to 1.3 Å. It can be deduced that the
strength of newly formed bond is weak at the low
temperature (because the temperature continuously
rises over time).
3.2 The Potential Energy
Figure 4 presents the changes of potential energies
in the heating process. There are some differences in
the evolutions of the potential curves for the three
models. When the void is introduced into
amorphous silica structures, the materials will have
higher potential energies. The reason maybe that the
atoms around the void are less stable. Moreover,
with the time running, there is an increase in the
potential energy of SiO
2
material, including the
void-structural material.
Figure 4: The potential energy change for different models
of amorphous silica.
Figure 4 shows an inflection point in the
potential curve of amorphous silica with or without
pre-existing structural defect. But the variation in
the slope of curve is not very markedness. The
reason is simply that the amorphous silica presents a
disordered state. While the abrupt increase maybe
directly correlative with the melting of the material.
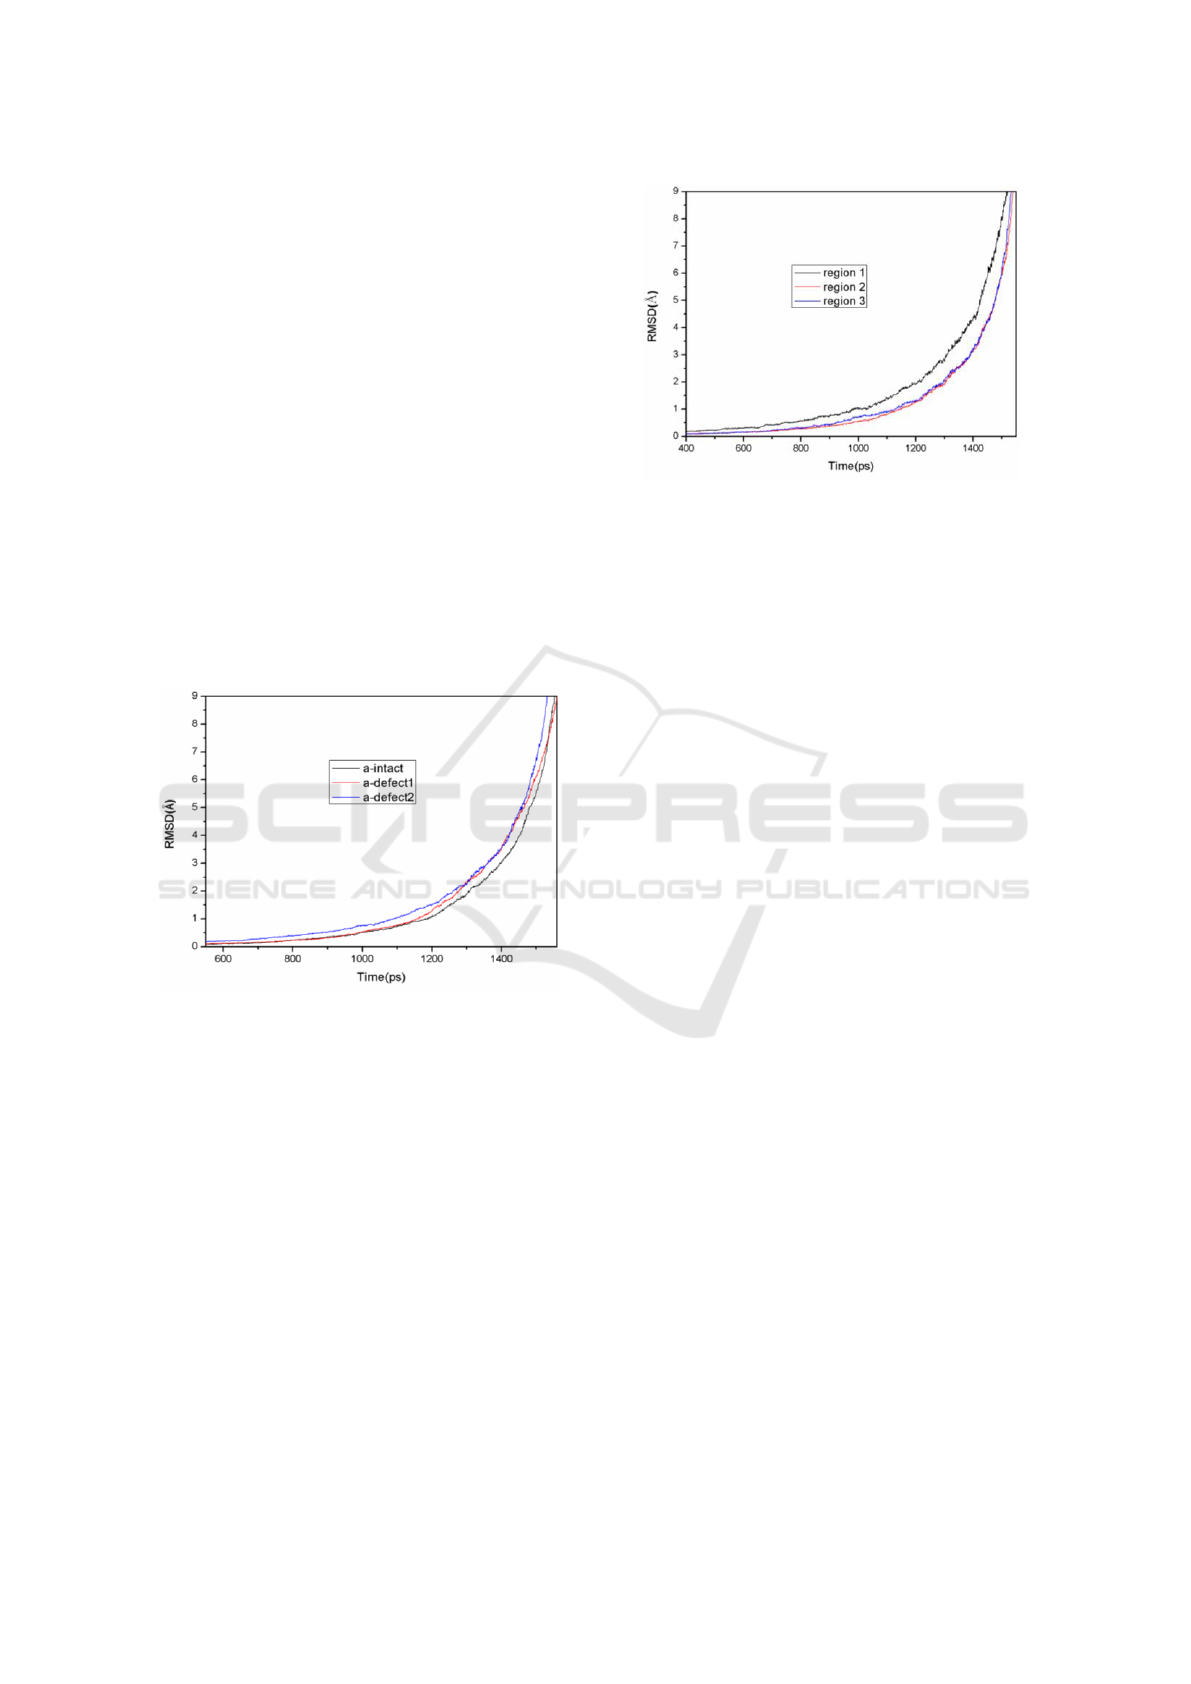
3.3 The RMSD
The calculated RMSDs for the defected and
undefected models are shown in Figure 5.
Obviously, there are noticeable differences in the
shape of RMSD curves for a-intact, a-defect1 and
a-defect2. Obviously, the different defect
concentrations can lead to various growth rate in the
RMSD of amorphous silica models. There is a
higher growth rate in the RMSDs of a-defect1 and
a-defect2. For example, the RMSDs of a-intact,
a-defect1and a-defect2 reaches 1 Å at the time of
1179 ps, 1154 ps, 1089 ps, respectively. The RMSD
of a-defect2 increases more quickly than that of
a-intact and a-defect1. It indicates that RMSD
changes faster with the increase of defect
concentration. We can speculate that it is more easier
to be destroyed, when there is higher defect
concentrations.
According to the Lindemann criterion
(Lindemann et al., 1910), melting occurs when the
RMSD of the atoms reaches a critical fraction of the
interatomic distance. And it has been used to study
the melting temperature in the normal
thermodynamic melting (Gilvarry et al., 1988;
Ubbelohda, 1978). At the same time, Jin et al. (Jin et
al., 2001) pointed out that the RMSD value at the
glass transition temperature is about ~ 0.22 times of
the interatomic distance. On basis of this, the glass
MEEP 2018 - The Second International Conference on Materials Chemistry and Environmental Protection
196
transition temperature of amorphous silica is
predicted. The bond length statistics shows that the
average Si−O bond length in the intial intact
amorphous silica is 1.60 Å, as well as the defected
models. Therefore, for amorphous silica, the RMSD
of the atoms at the glass transition temperature is ~
0.352 Å. Therefore, the progress of structural
melting can be obtained by observing the RMSD.
All of the RMSDs for a-intact, a-defect1and
a-defect2 reach 0.353 Å, at the time of 908 ps, 925
ps, 776 ps, respectively. Combining with the
calculated temperature, the glass transition
temperature is estimated to be 1812.6 K, 1846.4 K
and 1587.8 K, for the intact amorphous silica,
a-defect1 and a-defect2, respectively. Comparing
with the value of the other two amorphous silica
models, when the defect concentration is 1.47%, the
glass transition temperature can be significantly
decreased, which is reduced by about 12.4%. It
explains that the glass transition temperature can be
effectively reduced, when the defects meet certain
concentration.
Figure 5: RMSD for the defected and undefected system.
From Figure 5, we can see that there are some
overlapping locations in a-intact and a-defect1. In
addition, the missing atomicity of a-defect1 is less,
comparing with a-defect2. The RMSDs for the three
regions of a-defect2, which has higher defect
concentration, are analyzed and compared as
illustrated in Figure 6.
Figure 6: RMSD for the three regions in the model of
a-defect2.
Figure 6 demonstrates that the RMSDs for the
three regions of a-defect2 have sudden changes at
different time. Apparently, the atoms in the defective
region (region 1) diffuse at first. When the system is
further heated, the atoms in the region 2 and region
3 start to diffuse. And the RMSD value for the
defected region also has a faster increase with the
time running. According to the Lindemann criterion,
we can speculate that the melting phenomenon of
a-defect2 begins at the defect center. At the same
time, the RMSD changes with time for region 2 and
region 3 is similar with each other. The reason
maybe that there is a relatively small number of
atoms in region 2 during the partitioning of
a-defect2.
4 SUMMARY AND
CONCLUSIONS
In our MD simulations, the force field parameters
expanded by Newsome et al. are used to study the
melting processes of amorphous silica materials. By
analyzing the Si–Si and O–O bonds evolution, we
find that the number of bond tends to increase with
the time running, when the Si–Si or O–O bond
appears as a newly formed bond. Comparing with
the bond evolution, it can be noticed that there are
some differences in the melting processes of the
amorphous silica models. Moreover, the analysis of
bond evolution gives an inspection for the
occurrence of structural defect in the melting
process. Our calculation results suggest that the
damage of the SiO
2
materials stems from the
migration of O or Si atom during the heating
process. And it also provides the melting mechanism,
i.e. the melting process is intimately related to the
formation of defect. Additionally, the sequence of
A Molecular Dynamics Simulation of the Influence of Defect on the Melting of Amorphous Silica
197

events demonstrates that the defects contribute to the
melting of SiO
2
materials.
Attribute to the presence of the void, there is a
higher potential energy for both of a-defect1 and
a-defect2. The glass transition temperature is
estimated to be 1812.6 K, 1846.4 K and 1587.8 K,
for a-intact, a-defect1 and a-defect2, respectively.
While the introduced of the defect concentration
1.47% makes the glass transition temperature reduce
by about 12.4%. From this calculated RMSD, we
can know that the vacancy cluster can reduce the
glass transition temperature of the material to a
certain extent.
ACKNOWLEDGEMENTS
We thank the financial support from the National
Natural Science Foundation of China (NSAF. Grant
No. 11176020 and NSFC. Grant No. 11374217).
REFERENCES
Afify, N.D., Mountjoy G., Haworth R., 2017. Comput.
Mater. Sci.128: 75.
An Q., Zheng L., Luo S. -N., 2006, J. Non-Cryst. Solids
352: 3320.
Assowe O., Politano O., Vignal V., Arnoux P., Diawara
B., Verners O., van Duin A. C. T., 2012. J. Phys.
Chem. A 116: 11796.
Bates, J. B., 1972. J. Chem. Phys. 57: 4042.
Berendsen, H. J. C., Postma, J. P. M., Van Gunsteren, W.
F., Dinola, A., Haak, J. R., 1984. J. Chem. Phys. 81:
3684.
Blöchl, P.E., 2000. Phys. Rev. B 62: 6158.
Chan, S. L., Elliott, S. R., 1991. Phys. Rev. B 43: 4423.
Chenoweth, K., Van Duin, A. C. T., Persson, P., Cheng,
M. J., Oxgaard, J., Goddard, W. A., III, 2008. J.
Chem. Phys. C 112: 14645.
Cowen, B. J., Ei-Genk, M. S., 2016. Comput. Mater. Sci.
111: 269.
El-Sayed, A., Watkins, M. B., Shluger, A. L., Afanas’ev
V. V., 2013. Microelectron. Eng. 109: 68.
Fowler, W. B., Edwards, A. H., 1997. J. Non-Cryst. Solids
222: 33.
Gilvarry, J. J., 1956. Phys. Rev. 102: 308; Voronel A.,
Rabinovitch S., Kisliuk A., Steinberg V., Sverbilova
T., 1988. Phys. Rev. Lett., 60: 2402.
Gubbels-Elzas, A., Thijsse, B. J., 2014. Comput. Mater.
Sci. 90: 196.
Gusev, E.P., 2000. in: G. Pacchioni, L. Skuja, D. Griscom
(Eds.), NATO Science Series, Kluwer Academic Press,
Dordrecht 557.
Hattori, S., Kalia, R. K., Nakano, A., Nomura, K.,
Vashishta, P., 2012. Appl. Phys. Lett. 101: 063106.
Hoang, V. V., 2007. J. Phys. Chem. B 111: 12649–12656.
Huff , N. T., Demiralp, E., Cagin, T., Goddard III, W. A.,
1999. J. Non-Cryst. Solids 253: 133.
Jin, Z. H., Gumbsch, P., Lu, K., Ma, E., 2001. Phys. Rev.
B 87: 055703-1.Kang J., Kim Y. -H., Bang J., Chang
K. J., 2008. Phys. Rev. B 77: 195321.
Kuo, C. -L., Hwang, G. S., 2006. Phys. Rev. Lett. 97:
066101.
Kurkjian, C. R., Krol, D. M., 2000. in: R.B. Devine, J.-P.
Duraud, E. Dooryheé (Eds.), John Wiley and Sons,
New York 449.
Lindemann, F. A., Phys Z., 1910. Physikalische Zeitschrift
der Sowjetunion 11: 609−612.
Luo, S. -N., Zheng, L., An, Q., Wu, H. -A., Xia, K., Ni, S.,
2007. Proc. SPIE 6403: 64030C-1.
Malavasi, G., Menziani, M. C., Pedone, A., Segre, U.,
2006. J. Non-Cryst. Solids 352: 285.
Mitra, S. K., Hockney, R. W., 1980. J. Phys. C: Sol. Stat.
Phys. 13: L739.
Mota, F., Molla, J., Caturla, M. -J., Ibarra, A., Perlado, J.
M., 2008. J. Phys.: Conf. Ser. 112: 032032.
Mukhopadhyay, S., Sushko, P. V., Stoneham, A. M.,
Shluger, A. L., 2004. Phys. Rev. B 70: 195203.
Newsome, D. A., Sengupta, D., Foroutan, H., Russo, M.
F., van Duin, A. C. T., 2012. J. Phys. Chem. C 116:
16111.
Peek, N.M., Jeffcoat, D.B., et al., 2018. J. Phys. Chem. C
122: 4349.
Plimpton, S., 1995. J. Comput. Phys. 117: 1.
Rimsza, J. M., Jones, R. E., Criscenti, L. J., 2018. J.
Colloid. Interface Sci. 516: 128.
Roder, A., Kob, W., Binder, K., 2001. J. Chem. Phys. 114:
7602.
Takada, A., Richet, P., Catlow, C.R.A., Price, G.D., 2004.
J. Non-Cryst. Solids 345−346: 224.
Ubbelohda, A. R., 1978. Wiley, Chichester.
van Duin, A. C. T., 2009.
http://www.wag.caltech.edu/home/duin/reax_um.pdf.
van Duin, A. C. T., Dasgupta, S., Lorant, F., Goddard, W.
A., III, 2001. J. Phys. Chem. A 105: 9396.
Vollmayr, K., Kob, W., Binder, K., 1996. Phys. Rev. B 54:
15808.
Weber, W. J. et al., 1998. J. Mater. Res. 13: 1434.
Wood, M. A., van Duin, A. C. T., Strachan, A., 2014. J.
Phys. Chem. A 118: 885.
Yu, Y., Wang, B., et al., 2016. J. Non-Cryst. Solids 443:
148.
Zachariasen, W.H., 1932. J. Am. Chem. Soc. 54: 3841.
Zhang, G., Li, X., Tung, C. -H., Pey, K. -L., Lo, G. -Q.,
2008. Appl. Phys. Lett. 93: 022901.
Zhang, J., Liebermann, R. C., Gasparik T., et al., 1993. J.
Geophys. Res. Solid Earth 98: 19785.
Zheng, L., An, Q., Fu, R., Ni, S., Luo, S. -N., 2006. J.
Chem. Phys. 125: 154511.
MEEP 2018 - The Second International Conference on Materials Chemistry and Environmental Protection
198
