
Study on Recrystallization Softening Behaviour of 23Cr-2.1Ni-10Mn-
1.3Mo Economical Duplex Stainless Steels
Chaobo Pu, Yinhui Yang
*
, Yahui Deng, Ke Ni, Xiaoyu Pan and Zeyao Zeng
School of Materials Science and Engineering, Kunming University of Science and Technology, Kunming, China
Keywords: duplex stainless steel, dynamic recrystallization, deformation softening, critical strain
Abstract: In the temperature range of 1073-1423K and strain rates of 0.01-10s
-1
, single-pass compression tests were
performed on a Gleeble-3800 thermo-mechanical simulator to study the dynamic softening behaviour of
23Cr-2.1Ni-10Mn-1.3Mo low nickel type duplex stainless steel. The flow curves and microstructure showed
that the thermal deformation softening was mainly caused by dynamic recovery (DRV) under the condition
of high strain rate and low temperature, while Dynamic recrystallization (DRX) softening was mainly
occurred at low strain rate. The austenite phase softening changed from DRX to DRV with increasing strain
rate at the same temperature. The deformation activation energy Q and stress exponent n are calculated as
478.83kJ/mol and 5.43, respectively. Combined with Z parameter analysis, DRX was easily to occur under
the condition of low Z (1323K, 0.01s
-1
). The critical strain (stress) and peak strain (stress) obeyed a linear
relationship, and the critical strain (stress) decreased with increasing deformation temperature. The linear
equations of critical stress (strain) and Z value were obtained by regression analysis.
1 INTRODUCTION
Economical Duplex Stainless Steels (DSS)
composing of two phases have an advantageous
combination of austenitic and ferritic stainless steel,
presenting excellent corrosion resistance and
mechanical properties. Therefore, DSS is widely
used as a structural material in petrochemicals,
marine engineering and energy industries (Charles
and Chemelle, 2012; Wan et al., 2014; Mishra et al.,
2017). Due to high cost of nickel, the reduction of
nickel content in stainless steel under the premise of
ensuring material properties is the main way to
expand their application. The austenite phase of DSS
stabilized by adding low-cost manganese and
nitrogen elements to substitute nickel, and
maintaining high mechanical properties (Du et al.,
2010). It is difficult to add nitrogen in the smelting
process of DSS production, but the addition of Mn
can effectively stabilize the austenite phase and
increase the solid solubility of nitrogen to obtain a
two-phase equilibrium structure.
Dynamic recrystallization (DRX) and dynamic
recovery (DRV) are significant mechanisms for flow
softening during hot processing of metal, which play
an important role to control mechanical properties
during industrial processing (Frommert and
Gottstein, 2009; Meysami and Mousavi, 2011; Chen
et al., 2014). In the hot forming processes of DSS,
the microstructure evolution is more complicated
than a single structure. On account of the difference
in two-phase crystal structure and stacking fault
energy (SFE) in DSS, the softening mechanism is
different during hot deformation. Furthermore, due
to different thermal expansion coefficients of ferrite
and austenite phases, the stress and strain are
unevenly distributed in two phases during the hot
forming processes (Siegmund et al., 1995), which
easily forms edge and surface cracks (Iza-Mendia et
al., 1998). Therefore, optimizing the hot deformation
parameters is important for improving hot
workability of metals.
As a result, it is important to explore the hot
deformation softening behaviour of economical DSS
caused by two-phase DRX. The influence of hot
deformation parameters on DRX behaviour of high
manganese content DSS and the critical
characteristic parameters of thermal deformation
were studied in this paper. The purpose of this study
is to obtain ideal thermal processing parameters, and
provide a theoretical reference for development of
new nickel type DSS research and actual large
production.
184
Pu, C., Yang, Y., Deng, Y., Ni, K., Pan, X. and Zeng, Z.
Study on Recrystallization Softening Behaviour of 23Cr-2.1Ni-10Mn-1.3Mo Economical Duplex Stainless Steels.
DOI: 10.5220/0008187401840192
In The Second International Conference on Materials Chemistry and Environmental Protection (MEEP 2018), pages 184-192
ISBN: 978-989-758-360-5
Copyright
c
2019 by SCITEPRESS – Science and Technology Publications, Lda. All rights reserved
2 TESTED PROCEDURE
The chemical compositions of 23Cr-2.1Ni-10Mn-
1.3Mo DSS were presented as following (mass%): C
0.0348, Cr 23.388, Mn 10.2748, Ni 2.1279, Si 0.225,
S 0.0035, P 0.0063, Mo 1.3527, N 0.2808, Cu
0.1419, Fe(balanced). The tested steel was smelted
by vacuum melting furnace, then forged at 1100 ~
1150 into 130 mm wide and 25 mm thick
rectangular blocks, finally rolled into 12 mm thick
plates. These plates were solution treated at 1050
for 30 min, and then processed into 815 mm
compression specimens along the rolling direction.
Hot deformation experiments were carried out in
Gleeble-3800 thermal-mechanical simulator. The
specimens were heated at heating rate of 10 /s to
deformation temperature, and held for 3 min to keep
microstructure homogenization. The deformation
temperatures were performed at 1073, 1173, 1323
and 1423K, respectively, and the deformation strain
rates were in the range of 0.01 to 10s
-1
. In order to
keep deformation microstructure, the specimens
were taken out quickly and quenched into cold
water after each stage of compression. The
compressed microstructures were electrolytic etched
in concentration HNO
3
with a voltage of 1.5V. The
characteristic parameters related to DRX were
obtained from the flow curves. The critical strain ε
c
,
for DRX was calculated from the downward
inflection point in the θ (dσ/dε)–σ experimental
curves.
3 RESULT AND DISCUSSION
3.1 Flow Behaviour
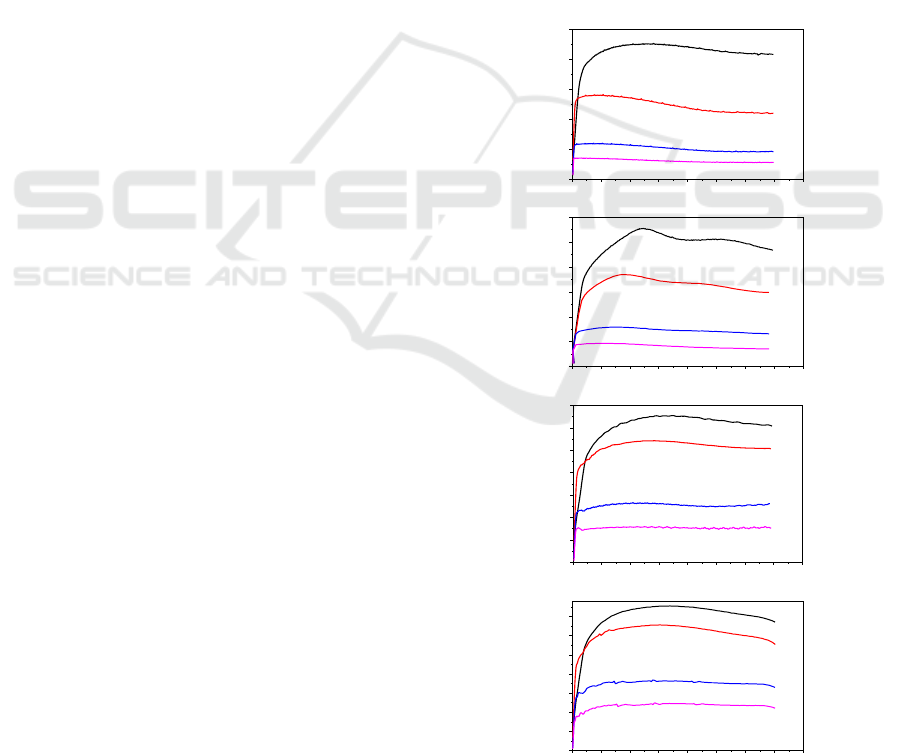
Figure 1 showed the flow curves under different
deformation conditions. It can be found that the flow
stress curve transferred from the work hardening
stage to the dynamic softening stage under different
thermal deformation parameters. The DRX
characteristics of flow curves obviously presented
with the deformation condition of 0.01-1s
-1
/1173-
1323K, the flow stress falls to the stable value and
then becomes flat after reaching the peak value with
the increasing of deformation degree (Figure1a-c).
The DRX occurred is attributed to higher grain
boundary migration rate and DRX nucleation rate.
Deformation at the lower temperature of 1073K,
the steady-state flow zone after stress peak
decreased and disappeared as the strain rate
increased from 0.1 to 10s
-1
, indicating the
deformation softening was mainly caused by DRV.
The main reason is that the lower deformation
temperature can easily increase the hardening rate of
tested DSS. The larger the flow stress, the larger the
strain required reaching the peak stress, and the less
DRX would occur. In the case of deformation at
different strain rates of 1423K, the fluctuation of
flow stress with strain after the peak stress is small,
which exhibit DRV softening characteristics. The
flow curve did not show flow softening feature of
DRX at high strain rate of 10s
-1
(Figure 1d). This is
due to the high deformation rate, which leads to
insufficient nucleation time and grain growth,
thereby inhibiting dynamic recrystallization (Iza-
Mendia et al., 1998). Therefore, DRV softening was
dominant at high strain rates and low deformation
temperatures. But at low strain rates and high
temperatures, thermal deformation softening is
dominated by DRX.
0.0 0.1 0.2 0.3 0.4 0.5 0.6 0.7 0.8
0
50
100
150
200
250
True strain
True stress / MPa
1073K
1173K
1323K
1423K
(a)
0.01s
-1
0.0 0.1 0.2 0.3 0.4 0.5 0.6 0.7 0.8
0
50
100
150
200
250
300
1423K
1323K
1173K
1073K
True strain
True stress / MPa
(b)
0.1s
-1
0.0 0.1 0.2 0.3 0.4 0.5 0.6 0.7 0.8
0
50
100
150
200
250
300
350
True strain
True stress / MPa
1073K
1173K
1323K
1423K
(c)
1s
-1
0.0 0.1 0.2 0.3 0.4 0.5 0.6 0.7 0.8
0
50
100
150
200
250
300
350
True stress / MPa
True strain
1423K
1323K
1173K
1073K
(d)
10s
-1
Figure 1: True stress-strain curves of tested steel. (a)0.01s
-
1
; (b)0.1s
-1
;(c) 1s
-1
;(d)10s
-1
.
Study on Recrystallization Softening Behaviour of 23Cr-2.1Ni-10Mn-1.3Mo Economical Duplex Stainless Steels
185
3.2 Microstructure Evolution
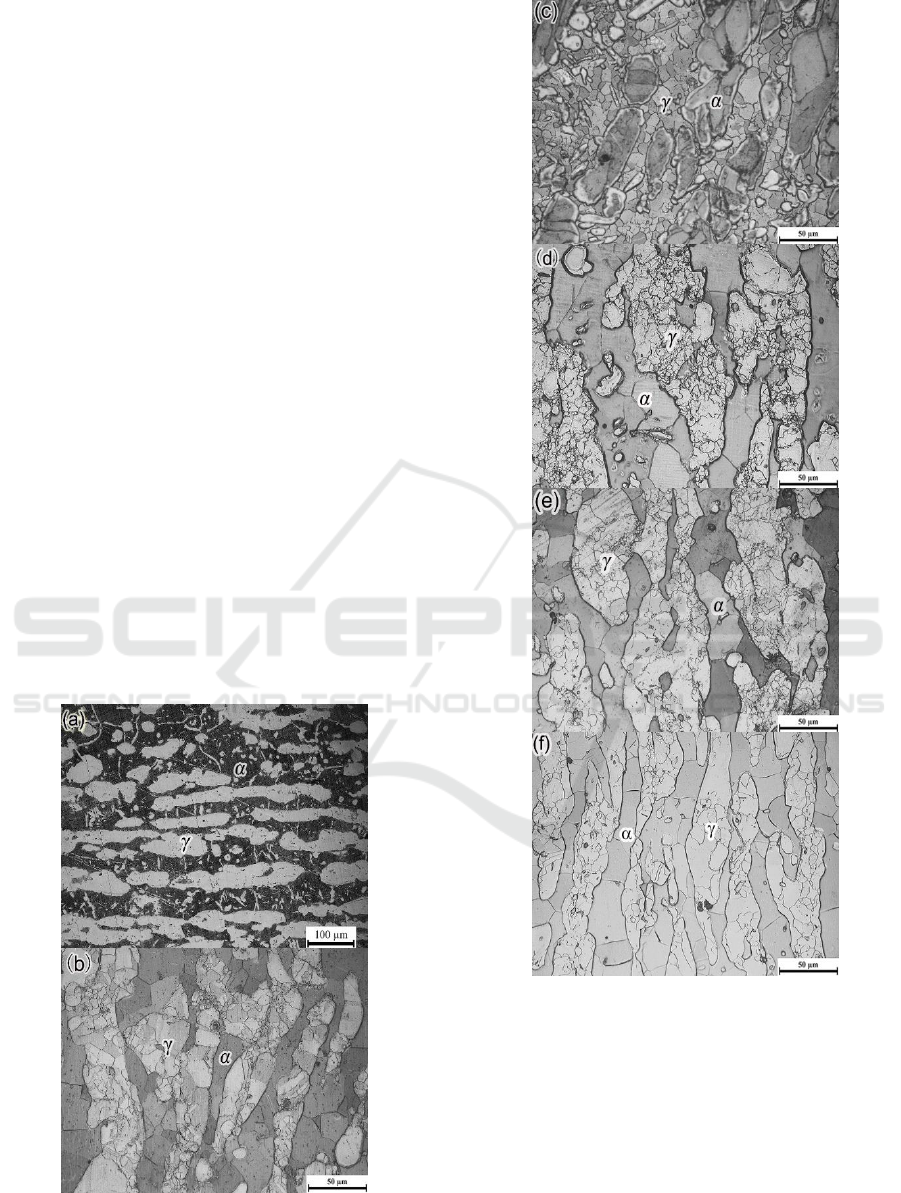
Compared with solution treated microstructure
(Figure 2a), it is observed that the compression
deformed microstructure has been refined to
different degree. The ferrite phase exhibits coarse
grained structure at different deformation strain rate
and temperature, which mainly caused by DRV due
to relatively higher SFE in two phases, while
dislocations climbing and cross slipping easily
occurred at high deformation temperature. Under the
deformation condition of 1s
-1
/1173K (Figure 2b), the
stripped austenite grain boundary was naturally
curved and fine recrystallized sprouting structure
appeared, growing gradually with the increasing of
deformation temperature (Figure 2c). At higher
temperature of 1323K and strain rates of 0.01-1s
-1
,
there were a large number of dynamically
recrystallized grains that are not sufficiently grown
in the austenite (Figure 2d, e), and the grain size of
recrystallization increases with increasing strain rate.
For sample deformed at strain rate of 10s
-1
(Figure
2f), the grain boundaries of austenite phases
gradually became flat and stable, and enlarged grain
size distribution difference due to the occurrence
between DRV and partial DRX. Therefore, the
austenitic phase deformation changed from DRX to
DRV with increasing strain rate at the same
temperature, which is consistent with the analysis of
true stress-strain curves.
Figure 2: Typical OM images of tested steel under
different deformation conditions. (a) Solution treated
sample; (b) T=1173K,
=1s
-1
; (c) T=1323K,
=1s
-1
; (d)
T=1323K,
=0.01s
-1
; (e) T=1323K,
=0.1s
-1
; (f)
T=1323K,
=10s
-1
.
3.3 Constitutive Equations for Flow
Behaviour
The activation energy Q is an important parameter
reflecting hot deformation difficulty for metal
MEEP 2018 - The Second International Conference on Materials Chemistry and Environmental Protection
186
material, which determines the critical condition of
DRX. The relation between the flow stress,
deformation temperature and strain rate of hot
deformation can be analyzed and described by the
mathematical model, named the Arrhenius equation
characterized by the zener-hollomon parameter (Z)
(Xu et al., 2013).
(1)
(2)
Where Z is the temperature compensated strain
rate, is the strain rate, A is the tested constant, Q is
the apparent deformation activation energy, R is the
gas constant, T is the thermodynamic temperature.
While F () is a function of flow stress with the
following equations (Haghdadi et al., 2016; Wang et
al., 2013):
0.8 (3)
1.2 (4)
(5)
,
, n and n
1
are material constants and
= β / n
1
.
Considering that in a certain temperature, when
Q is independent of T, thus the Eqs. (6) and (7) can
be obtained by substituting Eq. (3) and (4) to Eq. (1)
respectively:
(6)
(7)
Where B and C are material constants,
independent of temperature. Taking the natural
logarithm of both sides of Eqs. (6) and (7), it can be
obtained as following equations:
(8)
(9)
It is easy to obtain the value of n
1
,
from the
slop of the plots shown in Figure3 (a) and (b) (ln
versus ln and versus ln) based on Eqs. (8) and
(9). The value of constant parameters are showed as:
n
1
= 8.2432,
= 0.0536,
=
/ n
1
= 0.0065.
Substituting Eq. (5) into the Eq. (1) yields Eq. (10),
then taking the natural logarithm, the Eqs. (11) and
(12) were obtained.
(10)
ln
ln+
(11)
ln
ln (12)
The hot deformation constant n and active
energy Q can be derived from the Arrhenius plots of
Figure3 (c) and (d) (ln[sinh()] versus ln() and
ln[sinh()] versus (1/T)). Thus, the Q and n values
of tested steel are calculated as 418.83 kJ / mol and
5.4357, respectively.
-5 -4 -3 -2 -1 0 1 2 3
3.5
4.0
4.5
5.0
5.5
6.0
(a)
ln
ln
1073K
1173K
1323K
1423K
-5 -4 -3 -2 -1 0 1 2 3
0
50
100
150
200
250
300
350
400
ln
(b)
1073K
1173K
1323K
1423K
-5 -4 -3 -2 -1 0 1 2 3
-1.5
-1.0
-0.5
0.0
0.5
1.0
1.5
2.0
ln
ln
[
sinh
(
α
σ
)
]
(c)
1073K
1173K
1323K
1423K
Equation y = a + b*x
Plot 800 900 1050
Weight No Weighting
Intercept 1.41992 0.97282 -0.05547
Slope 0.14833 0.20579 0.19786
Residual Sum of Squares 1.09359E-4 0.01344 0.01589
Pearson's r 0.99991 0.99407 0.99243
R-Square(COD) 0.99981 0.98817 0.98492
Adj. R-Square 0.99972 0.98226 0.97738
7.0x10
-4
7.5x10
-4
8.0x10
-4
8.5x10
-4
9.0x10
-4
9.5x10
-4
-1.5
-1.0
-0.5
0.0
0.5
1.0
1.5
2.0
(d)
1 / T
ln
[
sinh
(
α
σ
)
]
0.01s
-1
0.1s
-1
1s
-1
10s
-1
Figure 3: Relationship between peak stress and
deformation rate with temperature. (a) ln versus ln; (b)
versus ln; (c) ln[sinh()] versus ln; (d) ln[sinh()]
versus 1/T.
Study on Recrystallization Softening Behaviour of 23Cr-2.1Ni-10Mn-1.3Mo Economical Duplex Stainless Steels
187
The expression of the Z parameter of the
deformation process of the tested steel can be
obtained by the acquired activation energy Q,
combined with the Eqs. (1), (2) and (5):
(13)
Taking the natural logarithms on both sides of Eq.
(13), then Eq. (14) can be obtained.
ln
(14)
According to the relationship curves of
ln[sinh()] and ln (Figure 4), the average value of
A can be estimated to be 3.185610
16
for the tested
steel. The Eq. (14) can be expressed as follow by the
nature of the hyperbolic sine function:
(15)
The peak stress constitutive equation can be
solved as the follow expression:
(16)
As a result, the hot deformation equation of
tested steel is shown as Eq. (17), and the flow stress
constitutive equation are expressed as Eq. (18).
(17)
(18)
-1.5 -1.0 -0.5 0.0 0.5 1.0 1.5 2.0
30
35
40
45
50
Fiting result
lnZ
ln[sinh()]
Figure 4: Relationship between lnZ and ln[sinh()].
Z parameters were introduced comprehensively
to describe the flow behaviour of tested steel at a
certain deformation temperature and strain rate. The
smaller the Z value is, the smaller deformation
resistance and the higher mobility of dislocations
and grain boundaries are, as well as the greater
tendency for DRX is during deformation. Some fine
grains sprouted from the austenite phase (Figure 2d)
at a small Z value (such as 1323K, 0.01s
-1
),
indicating the occurrence of DRX. On the contrary,
the larger Z value is, the higher deformation
resistance is, the smaller driving force is for
recrystallization, so the smaller tendency to
recrystallize is. It can be seen from Figure 2b that
under the condition of the maximum Z value (such
as 1173K, 1s
-1
), DRV is main softening behaviour.
3.4 Critical Condition Model for DRX
The critical strain (
c
) of material is the prerequisite
for the research on DRX, which usually was
activated before the peak stress (Imbert and
Mcqueen, 2001). The inflections in the plot of strain
hardening rate (θ=∂σ/∂ε) versus flow stress (σ) are
attributed to DRX, which not only characterizes the
microstructure evolution during the deformation
processing, but also determines the characteristic
values of the deformation resistance accurately
(Chen et al., 2016).
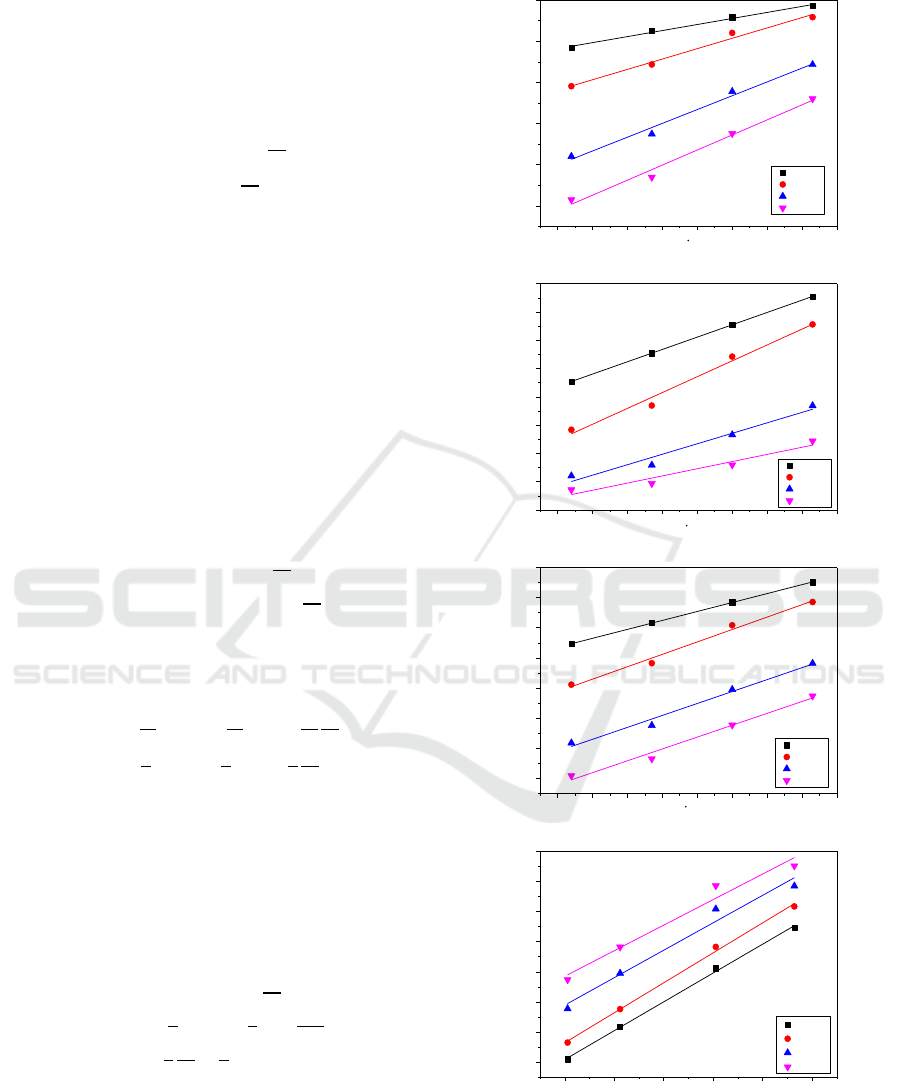
The strain hardening rate decreases sharply with
increasing of temperature at a low strain rate of 0.1s
-
1
(Figure 5a), which is because that the low
dislocation energy at low temperature region
increases work hardening. In the high temperature
region, with the increasing of dislocation energy, the
stress relaxation due to more dislocations migration
greatly reduced strain hardening rate. At high strain
rate of 10s
-1
(Figure 5c), the strain hardening rate in
the high temperature zone was higher than that
deformed at 0.1s
-1
, indicating that the work
hardening was dominant in the flow process under
the high strain rate. The strain hardening rate
increased with the increasing of deformation rate at
a lower deformation temperature of 1073K (Figure
5d). However, the strain hardening rate increases
first and then decreases with the increasing of strain
rate at a higher temperature of 1323K (Figure 5f).
MEEP 2018 - The Second International Conference on Materials Chemistry and Environmental Protection
188
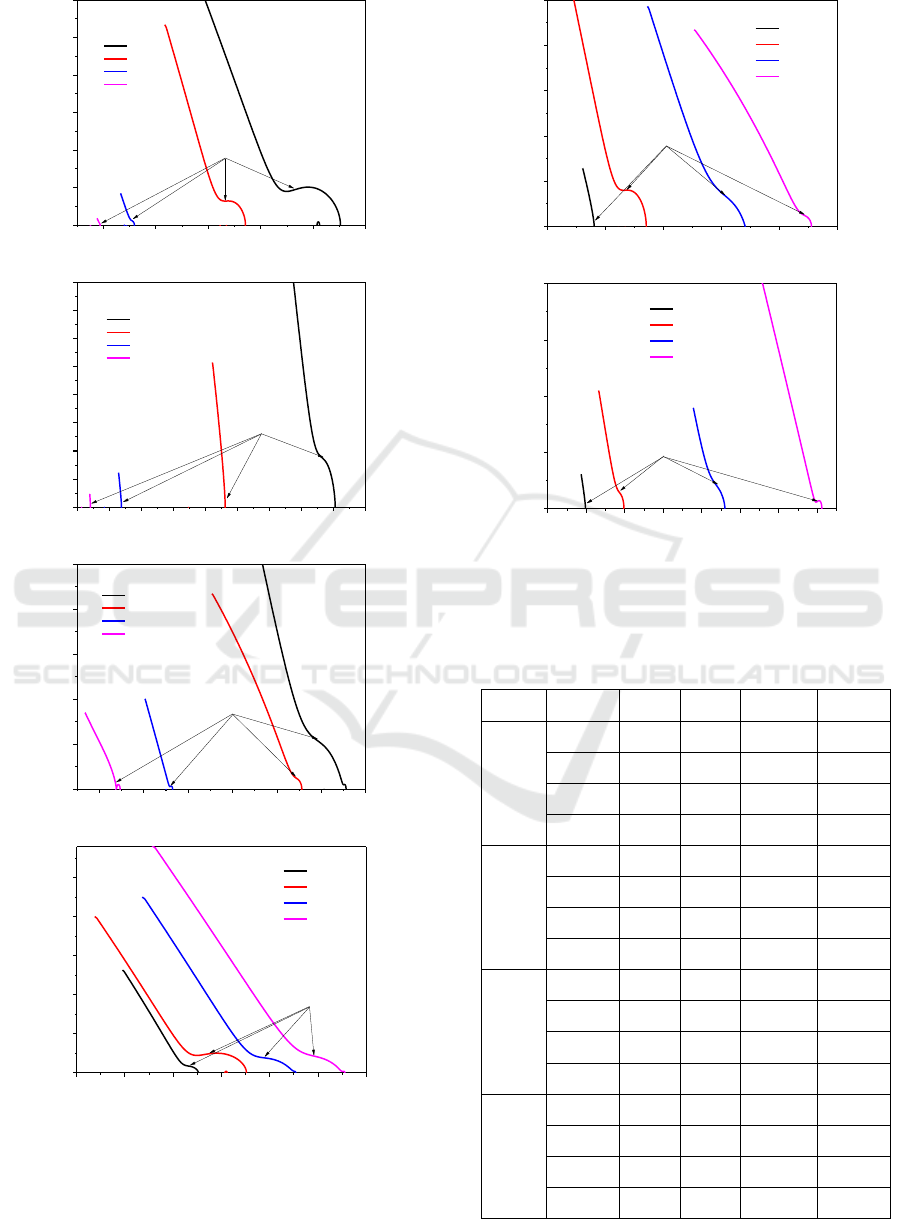
50 100 150 200 250 300
0
500
1000
1500
2000
2500
3000
Strain hardening rate
True stress /MPa
1073K
1173K
1323K
1423K
0.1s
-1
(a)
c
25 50 75 100 125 150 175 200 225 250
0
100
200
300
400
500
600
700
800
Strain hardening rate
True stress /MPa
1073K
1173K
1323K
1423K
1s
-1
(b)
c
100 150 200 250 300 350 400
0
400
800
1200
1600
2000
Strain hardening rate
True strain /MPa
1073K
1173K
1323K
1423K
10s
-1
(c)
c
100 150 200 250 300 350 400
0
1000
2000
3000
4000
5000
Strain hardening rate
True stress /MPa
0.01s
-1
0.1s
-1
1s
-1
10s
-1
1073K
(d)
c
100 150 200 250 300 350
0
400
800
1200
1600
2000
Strain hardening rate
True stress /MPa
0.01s
-1
0.1s
-1
1s
-1
10s
-1
1173K
(e)
c
40 60 80 100 120 140 160 180
0
200
400
600
800
Strain hardening rate
True stress /MPa
0.01s
-1
0.1s
-1
1s
-1
10s
-1
1323K
(f)
c
Figure 5: Strain hardening rate versus flow stress under
different deformation conditions. (a) 0.1s
-1
; (b) 1s
-1
; (c)
10s
-1
; (d) 1073K; (e) 1173K; (f) 1323K.
Table 1: The data of characteristic points in flow curves
under different conditions.
Strain
rate
Tempera
ture/K
c
p
c
/MPa
p
/MPa
0.01s
-1
1073
0.110
0.235
215.14
226.13
1173
-
0.109
-
140.38
1323
-
0.087
-
59.612
1423
-
0.063
-
35.622
0.1s
-1
1073
0.128
0.228
238.65
276.17
1173
0.098
0.178
168.55
184.79
1323
0.076
0.143
76.463
79.396
1423
0.066
0.121
46.36
46.826
1s
-1
1073
0.128
0.288
296.13
327.02
1173
0.115
0.240
255.48
270.59
1323
0.105
0.184
125.87
132.42
1423
0.101
0.176
76.416
78.911
10s
-1
1073
0.146
0.322
354.202
377.572
1173
0.122
0.273
312.05
327.79
1323
0.113
0.247
117.42
181.72
1423
0.091
0.175
114.56
119.38
Study on Recrystallization Softening Behaviour of 23Cr-2.1Ni-10Mn-1.3Mo Economical Duplex Stainless Steels
189
The characteristic points of the flow curves
under different deformation conditions are shown in
Table 1. It can be seen that under the condition of
0.1 -10s
-1
, the peak stress and the critical stress
decreased with increasing temperature at the same
strain rate, which is caused by the increasing of the
energy provided by the increasing of temperature.
The critical strain also decreased with increasing of
deformation temperature. In the low temperature
region of 1073 - 1173K, the critical strain increased
with the increasing of deformation rate. This is
because the deformation energy storage of the
material increases with increasing strain rate, and the
energy consumption increases. The critical strain
increased first and then decreased with the
increasing of strain rate at 1423K, indicating that the
strain rate of 1s
-1
is the turning point of the hot
processing.
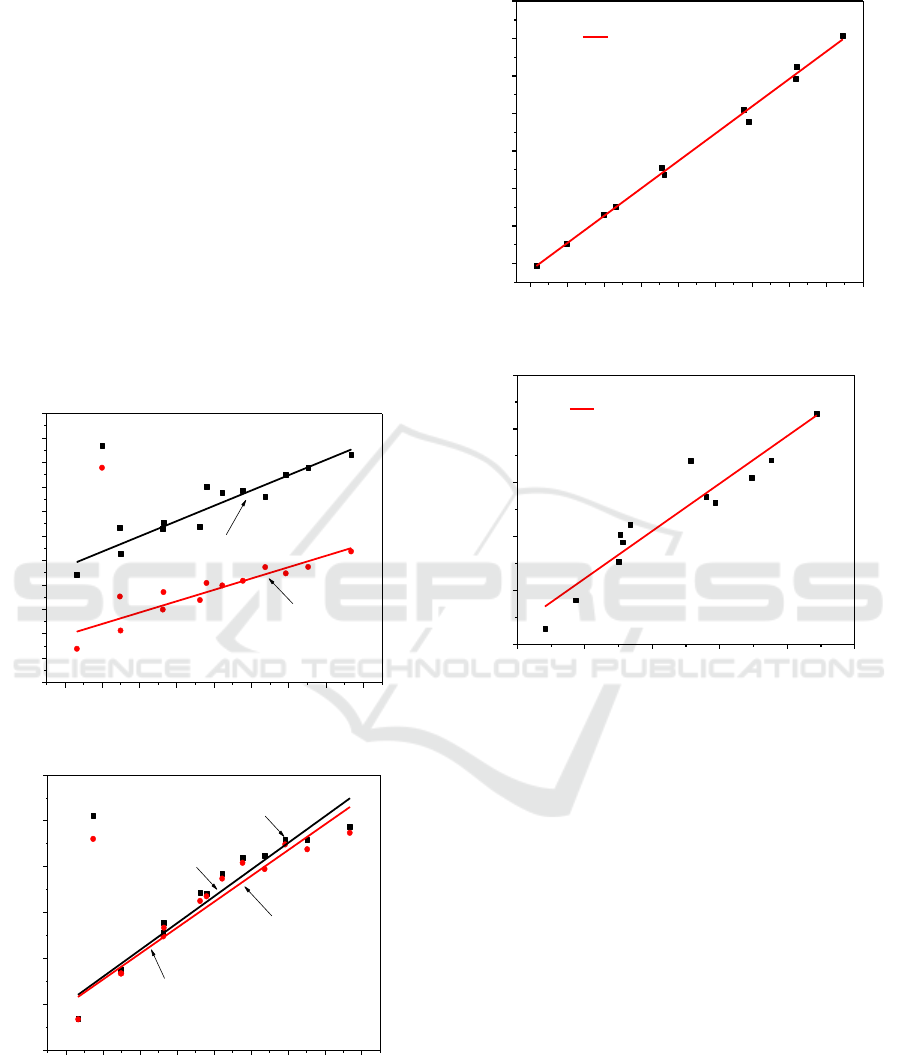
28 30 32 34 36 38 40 42 44
-3.0
-2.8
-2.6
-2.4
-2.2
-2.0
-1.8
-1.6
-1.4
-1.2
-1.0
-0.8
ln
p
ln
c
ln
lnZ
(a)
ln
p
=0.06253lnZ-3.80363
ln
c
=0.04641lnZ-3.91084
R
2
=0.88807
R
2
=0.82643
28 30 32 34 36 38 40 42 44
3.5
4.0
4.5
5.0
5.5
6.0
6.5
ln
p
ln
c
ln
lnZ
(b)
ln
p
=0.14562lnZ-0.06626
ln
C
=0.14074lnZ-0.05046
R
2
=0.93202
R
2
=0.93334
Figure 6: Relationship between (a) ln
p
, ln
c
and Z; (b)
ln
p
, ln
c
and lnZ.
40 80 120 160 200 240 280 320 360 400
50
100
150
200
250
300
350
400
Fiting result
c
σ
p
(a)
c
=0.91
p
R
2
=0.99479
0.10 0.15 0.20 0.25 0.30 0.35
0.06
0.08
0.10
0.12
0.14
0.16
Fiting result
c
p
(b)
c
=0.35
p
R
2
=0.88592
Figure 7: Relationship between (a)
p
and
c
; (b)
p
and
c.
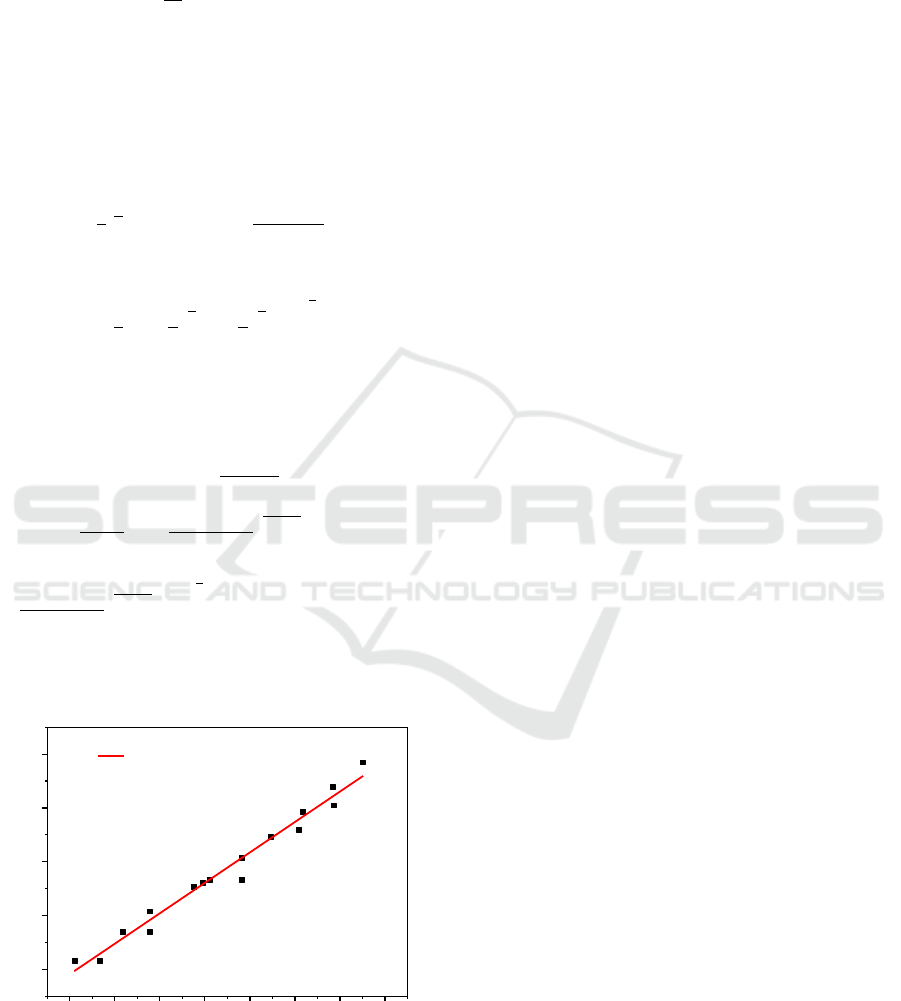
As shown in Figure 6, it can be seen that the
critical strain (stress) and peak strain (stress)
increase with the increasing of Z value, showing a
better linear relationship. Regression analysis of
these curves resulted in the following equation:
ln
p
=0.06253lnZ-3.80363 (19)
ln
c
=0.04641lnZ-3.91084 (20)
ln
p
=0.14562lnZ-0.06626 (21)
ln
c
=0.14074lnZ-0.05046 (22)
The relationship between
c
(
c
) and
p
(
p
) is
plotted in Figure 7. It can be observed that the
dependence of
c
(
c
) on
p
(
p
) obeys a linear
equation and the following equations are obtained.
MEEP 2018 - The Second International Conference on Materials Chemistry and Environmental Protection
190

c
= 0.91
p
(23)
c
= 0.35
p
(24)
The ratio of
c
to
p
has been reported to be 0.43
for austenitic stainless steel, the general range
reported for steels is between 0.3 and 0.9, (Chen et
al., 2016) the ratio of
c
to
p
often takes values
between 0.83 (Wang et al., 2013) and 0.90 (Zhao et
al., 2014). So the values 0.35 and 0.91 are in
reasonable.
4 CONCLUSIONS
In this paper, the compression recrystallization
softening behaviour of 23Cr-2.1Ni-10Mn-1.3Mo
economical duplex stainless steel was investigated.
The main results can be summarized as follow:
(1) The austenite phase changes from dynamic
recrystallization to dynamic recovery with the
increasing of strain rate at the same
deformation temperature.
(2) The relationship between peak stress (strain)
and critical stress (strain) is:
c
=0.91
p
and
c
=0.35
p
. The critical strain in the low
temperature zone increases with the
increasing of deformation temperature and
strain rate, which increases first and then
decreases in the high temperature zone.
Combing with the Z parameter, DRX was
prone to occur under low Z conditions and
DRV occurred easily under high Z conditions.
(3) The thermal deformation and constitutive
equation of tested steel are shown as follow
respectively :
(4) The relationship between characteristic points
and flow stress on Z was obtained as ln
p
=
0.06253 lnZ-3.80363, ln
c
= 0.04641 lnZ-
3.91084, ln
p
= 0.14562 lnZ-0.06626 and
ln
c
= 0.14074 lnZ-0.05046.
ACKNOWLEDGEMENTS
This study was financially supported by the National
Natural Science Foundation of China (NSFC Project
no. 51461024).
REFERENCES
Charles, J., Chemelle, P., 2012. The history of duplex
developments, nowadays DSS properties and duplex
market future trends [J]. World. Iron. Steel., 144(2):
477.
Chen, L., Zhang, Y., Li, F. et al., 2016. Modeling of
dynamic recrystallization behavior of 21Cr-11Ni-N-
RE lean austenitic heat-resistant steel during hot
deformation [J]. Mater. Sci. Eng., A, 663: 141-150.
Chen, X. M., Lin, Y. C., Wen, D. X. et al., 2014. Dynamic
recrystallization behavior of a typical nickel-based
superalloy during hot deformation [J]. Mater. Des.,
2014, 57(5): 568-577.
Du, C. F., Zhan, F., Yang, Y. H. et al., 2010. Research
progress and application of double phase stainless
steel [J]. Met. Funct. Mater., 17(05): 63.
Frommert, M., Gottstein, G., 2009. Mechanical behavior
and microstructure evolution during steady-state
dynamic recrystallization in the austenitic steel 800H
[J]. Mater. Sci. Eng. A., 506(1): 101-110
Haghdadi, N., Martin, D., Hodgson, P., 2016. Physically-
based constitutive modelling of hot deformation
behavior in a LDX 2101 duplex stainless steel ☆ [J].
Mater. Des., 106: 420 - 427.
Imbert, C. A. C., Mcqueen, H. J., 2001. Peak strength,
strain hardening and dynamic restoration of A2 and
M2 tool steels in hot deformation [J]. Mater. Sci. Eng.
A., 313(1): 88-103.
Iza-Mendia, A., Piñol-Juez, A., Urcola, J. J. et al., 1998.
Microstructural and mechanical behavior of a duplex
stainless steel under hot working conditions [J].
Metall. Mater. Trans. A., 29(12): 2975-2986.
Meysami, M., Mousavi, S. A. A. A., 2011. Study on the
behavior of medium carbon vanadium microalloyed
steel by hot compression test [J]. Mater. Sci. Eng.
A., 528(7): 3049-3055.
Mishra, M. K., Balasundar, I., Rao, A. G. et al., 2017. On
the High Temperature Deformation Behaviour of 2507
Super Duplex Stainless Steel [J]. J. Mater. Eng.
Perform., 26(2): 1- 11.
Siegmund, T., Werner, E., Fischer, F. D., 1995. On the
thermomechanical deformation behavior of duplex-
type materials [J]. J. Mech. Phys. Solids., 43(4): 495-
532.
Wan, J., Ran, Q., Li, J. et al., 2014. A new resource-
saving, low chromium and low nickel duplex stainless
steel 15Cr– x Al–2Ni– y Mn [J]. Mater. Des., 53(1):
43-50.
Wang, M. H., Li, Y. F., Wang, W. H. et al., 2013.
Quantitative analysis of work hardening and dynamic
Study on Recrystallization Softening Behaviour of 23Cr-2.1Ni-10Mn-1.3Mo Economical Duplex Stainless Steels
191

softening behavior of low carbon alloy steel based on
the flow stress [J]. Mater. Des., 45: 384-392.
Xu, D., Zhu, M., Tang, Z. et al., 2013. Determination of
the dynamic recrystallization kinetics model for
SCM435 steel [J]. Journal of Wuhan University of
Technology (Materials Science Edition), 28(4): 819-
824
Zhao, B., Zhao, T., Li, G., et al., 2014. The kinetics of
dynamic recrystallization of a low carbon vanadium-
nitride microalloyed steel [J]. Mater. Sci. Eng., A, 604:
117-121.
MEEP 2018 - The Second International Conference on Materials Chemistry and Environmental Protection
192
