
Study of Moisture Transfer in Transverse Directions of Timber
Members of Anhui Fir
Kongyang Chen
1
, Menglin Sun
2
and Hongxing Qiu
1*
1
Key laboratory of Concrete and Prestressed Concrete Structures of Ministry of Education, School of Civil Engineering,
Southeast University, Nanjing, China
2
Architecture Design Institute, China Railway Liuyuan Group Co. Ltd., Tianjin, China
Keywords: Timber members, Moisture transfer, Diffusion coefficient, Surface emission coefficient, Finite element
method.
Abstract: Anhui fir is a common building material in southeast China. As the basement of the research for shrinkage
cracks and durability of timber structures in natural environment, this paper investigates the moisture
content distribution and moisture transfer process in transverse cross-section of timber members made of
Anhui fir. Now, the mostly used equations for calculating diffusion coefficient and surface emission are
based on Norway spruce, which is actually not suitable for Anhui fir due to their different kinds of trees.
Firstly, based on Fick’s second law, the diffusion parameters and boundary conditions in humidity field and
temperature field were analogized. Then, experiment in constant temperature and relative humidity was
done. Experimental result showed the polynomial moisture content distribution in transverse direction, and
exponential change with time, which was used for deriving new formulas for calculating diffusion
coefficient and surface emission coefficient of Anhui fir. Finally, the Abaqus heat transfer analysis was used
to simulate the moisture transfer process by substituting corresponding parameters successfully, and the
results agreed well with experiment.
1 INTRODUCTION
Anhui fir is a common wood material used in
Chinese timber structures, especially in southeast
China. As an important building material, the
physical and mechanical properties of wood are
highly affected by its own moisture content (MC),
including shrinkage/swelling, deformation, elastic
modulus, and strength (Toratti, 1994, Ranta-
Maunus, 2003, Hoyle Jr et al., 2007). Besides, wood
is a hygroscopic material which absorbs or desorbs
moisture to maintain equilibrium moisture content
(EMC) corresponding to relative humidity (RH) and
temperature in ambient environment (OBE, 2002).
Compared to RH, the effect of temperature on MC is
much weaker (Mirianon et al., 2008, Dietsch et al.,
2015a), so the influence of temperature is neglected
in this study.
The moisture transfer process will induce MC
gradient in the wood sections when the outside RH
and temperature are variable or its corresponding
EMC is different from the initial MC of timber
members. Moreover, the anisotropy of swelling and
shrinkage ratio and the existence of MC gradient in
wood sections may result in cracks, especially in the
transverse directions (Dietsch et al., 2015b, Bonarski
et al., 2015). Thus, the study of the MC distribution
and change of MC in transverse cross-section with
time is essential, which is the basis for the
subsequent study of the moisture-induced stress and
shrinkage cracks.
Because moisture transport in wood is an
unsteady-state process, a diffusion model based on
Fick’s second law has been developed to describe it
(Skaar, 1958). In this model, diffusion coefficient D
describes the internal moisture transfer rate in the
materials and surface emission coefficient S
characterizes the resistance when the water
molecules are moving through the material surface.
And this model has been accepted by many scholars
(Time, 2002, Kadem et al., 2011, Zítek et al., 2015).
D and S are influenced by wood type, MC and
temperature (Jia and Afzal, 2007). And D in radial
direction and tangential direction are assumed to be
equal in the following discussion (Fortino et al.,
2009). Now, many scholars (Fragiacomo et al.,
Chen, K., Sun, M. and Qiu, H.
Study of Moisture Transfer in Transverse Directions of Timber Members of Anhui Fir.
DOI: 10.5220/0008186901430150
In The Second International Conference on Materials Chemistry and Environmental Protection (MEEP 2018), pages 143-150
ISBN: 978-989-758-360-5
Copyright
c
2019 by SCITEPRESS – Science and Technology Publications, Lda. All rights reserved
143

2011, Qiu, 2015) use the same formulas to calculate
D in radial and tangential directions, and S.
However, the equation for D is obtained by fitting
the experimental results presented in Jönsson’s
thesis (Jönsson, 2005), and equation for S is from
Hoffmeyer’s research (Hoffmeyer and Davidson,
1989). Both of above experiments were conducted
on Norway spruce. Therefore, it is not accurate to
use these formulas directly for different kind wood.
To research the moisture transport in different
climate conditions and further mechanical analysis,
considering wood is nonlinear material, it is
essential to use numerical simulations by the finite
element method (FEM). Many authors (Younsi et
al., 2007, Fortino et al., 2009, Konopka et al., 2017)
used numerical method to analyze moisture transport
in wood samples, and DC2D4, a four-node linear
heat transfer quadrilateral has been proved to be
possible to analyze the process. What’s more, the
influence of climate on the mechanical properties
should also be taken into account for further
mechanical analysis, such as crack propagation and
capacity of timber member.
The purpose of this study is to evaluate the
diffusion coefficient and surface emission
coefficient of Anhui fir and use Abaqus heat transfer
analysis to simulate the moisture transfer process. In
section 2, the analogy between humidity field and
temperature field is done to realize the substitution
of related parameters, and deriving equations of D
and S. In section 3, specific data and phenomenon
are acquired by experiment, and specific formulas
of D and S will be proposed. In section 4, finite
element model is established to realize the moisture
transfer process in Abaqus and will be proved valid
by comparing the results with experiment.
2 THEORY
2.1 Analogy between Humidity Field
and Temperature Field
Wood is assumed to follow Fick’s second law for
moisture transfer and heat transfer. The moisture
transfer in one dimension is modelled as:
uu
D
t x x
(1)
where u [%] is the MC of wood, and D [m
2
/s] is the
coefficient of moisture diffusion.
The differential equation of heat transfer in one
dimension can be described as:
TT
t x c x
(2)
here T [K] is the temperature, c [J/kg/K] is the
specific heat, ρ
[kg/m
3
] is the wood density and λ
[W/m/K] is the thermal conductivity.
The boundary condition of moisture transfer is
moisture flux across the surface Γ, which is
expressed as:
n air surf
q S u u
(3)
where q
n
[kg/m
2
/s] is the moisture flux across the
surface, ρ
[kg/m
3
] is the wood density in absolute
dry condition, S [m/s] is the surface emission
coefficient, u
surf
[%] is the MC of wood surface, and
u
air
[%] is the EMC corresponding to the air RH,
defined as equation (4) (Hoffmeyer and Davidson,
1989).
0.75
air
273.15
110
6.46
0.01
273.15 ln 1
0.13 1 273.15 / 647.1
T
u
T RH
T
(4)
For temperature field, the boundary condition is
expressed as:
T air surf
q h T T
(5)
in which q
T
[W/m
2
] is the heat flux across the
surface, h [W/m
2
/K] is the film coefficient, T
surf
[K]
is the temperature of wood surface, and T
air
[K] is
the temperature of around air.
When setting density ρ and specific heat c to 1,
D and u can replace λ and T respectively by
compared formula (1) with (2). Similarly, S can
replace h by comparing formula (3) and (5). The
analogy of parameters are shown in Table 1.
Table 1: The analogy between parameters of humidity
field and temperature field.
Humidity field
Temperature field
u
T
D
λ
S
h
u
air
T
air
u
surf
T
surf
MEEP 2018 - The Second International Conference on Materials Chemistry and Environmental Protection
144

2.2 Analysis of Diffusion Coefficient
and Surface Emission Coefficient
According to experimental results (referred to
experiment section), at certain time t0, the
polynomial distribution of MC around the cross-
section is obvious, which can be expressed as:
0 0 0
( ) ( )
2
u t ,r = m t +n t r
(6)
here m and n are constant when t = t
0
, and r [mm] is
the distance from pith. This distribution result agrees
with Jia’s conclusion (Jia and Afzal, 2007).
MC changes with time exponentially at certain
distance r
0
, which is expressed as:
0 0 0 air
, ( )exp( ( ) )u t r A r B r t u
(7)
where A and B are constant when r = r
0
, t [h] is time.
The specimens used are with circular cross-
section, based on two-dimension Fick’s second law,
equation (1) can be described as:
2
2
u u u
D
t r r
r
(8)
From equation (6) and (7), there are
0
0
,
2 ( )
u t r
n t r
r
(9)
2
0
0
2
,
2 ( )
u t r
nt
r
(10)
0
0 0 0
( , )
( ) ( )exp( ( ) )
u t r
A r B r B r t
t
(11)
Substituting equation (9), (10) and (11) to
equation (8), there is
0 0 0 0
0
( ) ( )exp( ( ) )
4 ( )
A r B r B r t
D
nt
(12)
Equation (3) can also change to:
n 0 0
0
==
=
uu
q S r S r
rr
u
D
r
(13)
Therefore, the boundary condition of moisture
transfer can also be described as:
air surf
uS
uu
rD
(14)
Substituting equation (9) to equation (14), there
is
0
0
air surf
2 ( )
-=
t
n t r
uu
S
D
(15)
And surface emission coefficient at certain time
t
0
can be expressed as:
0
0
air surf
( ) ( )exp( ( ) )
=-
2
t
rA r B r B r
u
S
t
u
(16)
3 EXPERIMENT
3.1 Materials and Methods
Three specimens [100 (Diameter) × 800 (Length)
mm] made of Anhui fir, a kind of Cunninghamia
lanceolate were used in this experiment, named
CA1, CA2, and CA3 respectively. Wood materials
were selected from the same batch, trunks with
similar features (size, ring width and so on), and free
from decay and insects. All specimens were surface
polished and their pith should be in the middle of the
cross section. Both longitudinal ends of each
specimen were sealed with PE plastic film, ensuring
that moisture only exchanged with the outside from
transverse directions.
The chamber’s temperature was set constant at
40 ℃ to accelerate the procedure during the whole
experiment. And RH was set 30% for 10 days. MC
distribution of each specimen was measured at 0h,
24h, 48h, 96h, 144h, 192h, and 240h. Before each
measurement, the end of each specimen was cut by
10mm with a reciprocating saw to eliminate end
interference and then cut off a 20 mm-thick disk in
longitudinal direction. After that, remaining part of
Study of Moisture Transfer in Transverse Directions of Timber Members of Anhui Fir
145
the specimens were sealed with plastic film again
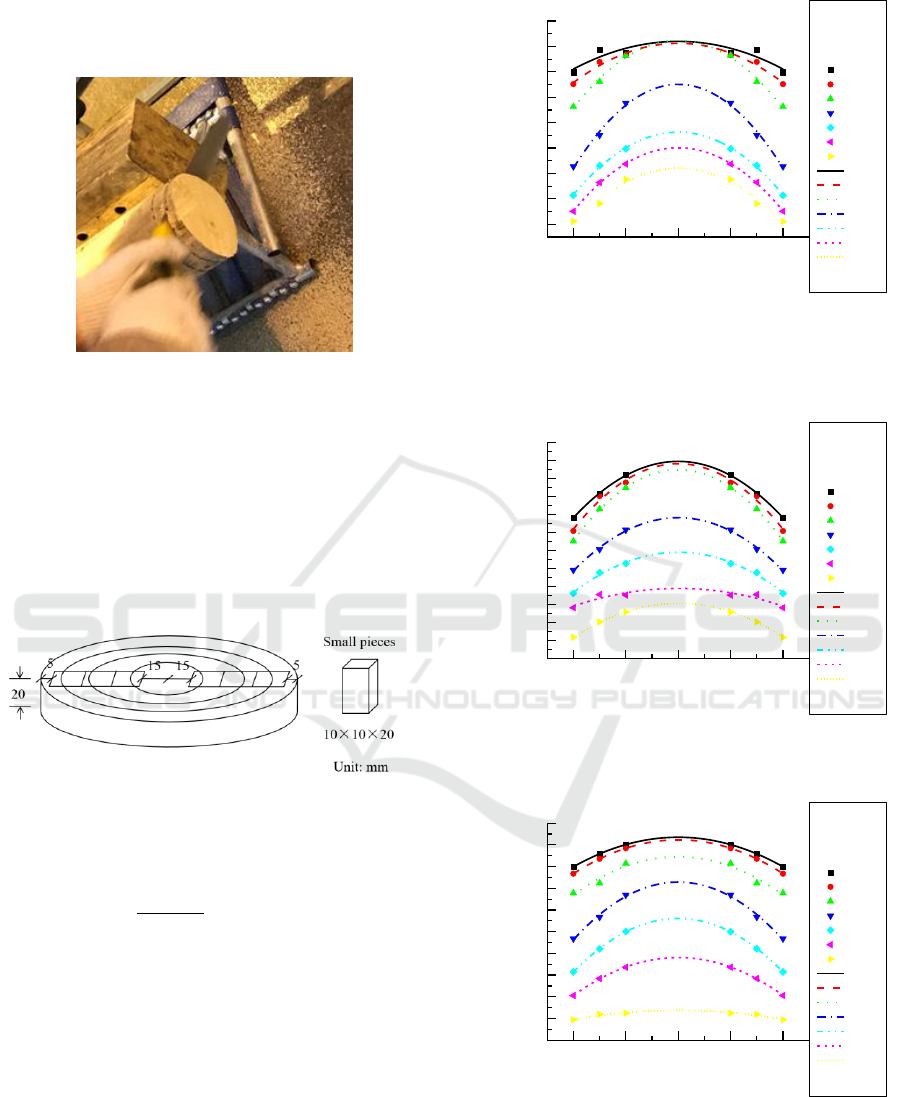
and returned into the chamber. The cutting process is
shown in Figure 1.
Figure 1: Disk cutting.
Then six small pieces [10 (R) × 10 (T) × 20 (L)
mm] were cut symmetrically along the radial
direction (as shown in Figure 2). The small pieces
were numbered as first circle [small piece 1, 6],
second circle [small piece 2, 5], third circle [small
piece 3, 4] from outside to inside. Actually, during
the experiment, shrinkage cracks occurred and in
order to eliminate the influence from cracks, the
choice of small pieces were away from cracks.
Figure 2: Diagram of cutting small pieces.
MC is calculated by equation (17) (Siau, 1995).
10
0
100%
mm
u
m
(17)
where m
1
[g] is the weight tested immediately after
cutting and m
0
[g] is the weight in absolute dry
condition, dried in oven at 103±2℃.
3.2 Results of Experiment
Figure 3, 4, and 5 show MC distribution versus
distance of CA1, CA2, CA3 respectively. It is
apparent the MC distribution in transverse cross-
section follows the polynomial distribution at any
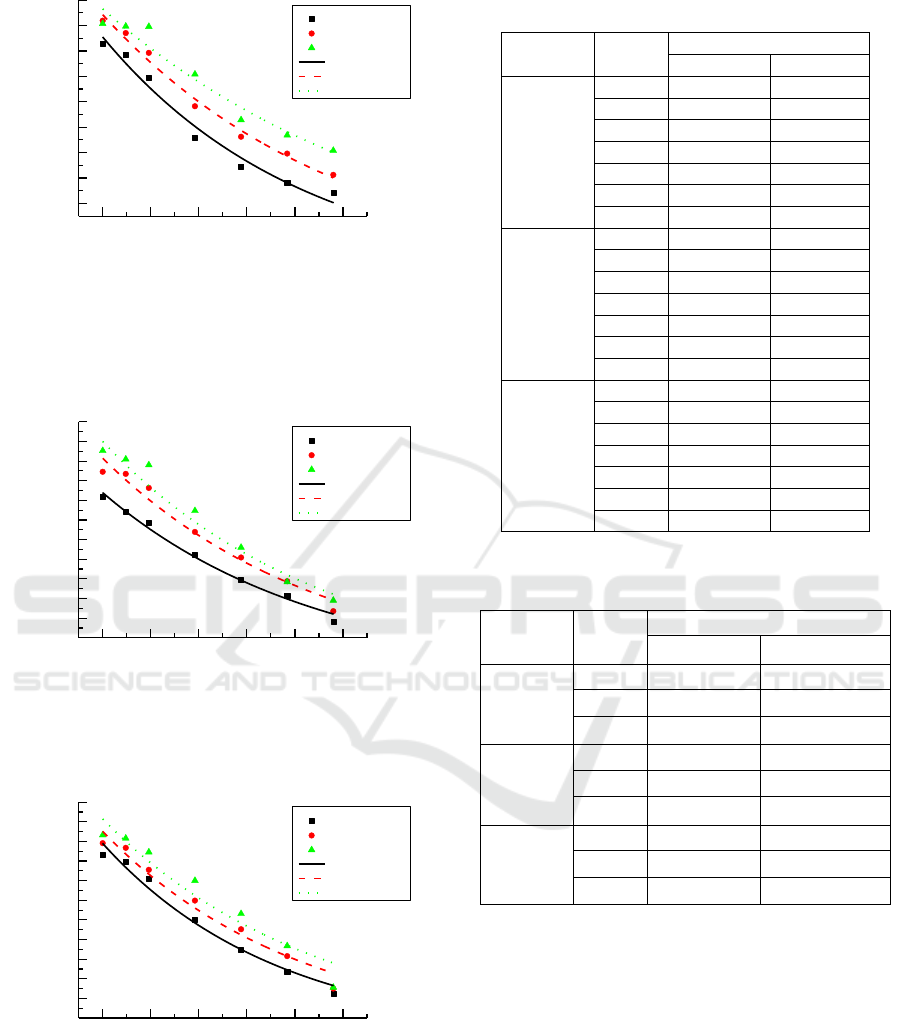
time. Figure 6, 7, and 8 show MC in each circle
reduces exponentially versus time.
-40 -20 0 20 40 60
12
14
16
18
20
22
24
26
28
0h-E
24h-E
48h-E
96h-E
144hE
192h-E
240h-E
0h-F
24h-F
48h-F
96h-F
144h-F
192h-F
240h-F
Moisture Content (%)
Distance (mm)
Figure 3: MC distribution of CA1 versus the distance from
pith in 0h, 24h, 48h, 96h, 144h, 192h, 240h, dots with
letter E are experimental results and lines with letter F are
fitting curves based on the results.
-40 -20 0 20 40 60
8
10
12
14
16
18
20
22
24
26
28
30
32
0h-E
24h-E
48h-E
96h-E
144hE
192h-E
240h-E
0h-F
24h-F
48h-F
96h-F
144h-F
192h-F
240h-F
Moisture Content (%)
Distance (mm)
Figure 4: MC distribution of CA2 versus the distance from
pith in 0h, 24h, 48h, 96h, 144h, 192h, 240h.
-40 -20 0 20 40 60
8
10
12
14
16
18
20
22
24
26
28
0h-E
24h-E
48h-E
96h-E
144hE
192h-E
240h-E
0h-F
24h-F
48h-F
96h-F
144h-F
192h-F
240h-F
Moisture Content (%)
Distance (mm)
Figure 5: MC distribution of CA3 versus the distance from
pith in 0h, 24h, 48h, 96h, 144h, 192h, 240h.
MEEP 2018 - The Second International Conference on Materials Chemistry and Environmental Protection
146
0 50 100 150 200 250
6
8
10
12
14
16
18
20
22
First Circle-E
Second Circle-E
Third Circle-E
First Circle-F
Second Circle-F
Third Circle-F
Moisture Content (%)
Time (h)
Figure 6: Difference value between MC of each circle in
CA1 and EMC corresponding around air versus time (First
Circle (r = 40 mm), Second Circle (r = 30 mm) and Third
Circle (r = 20 mm)).
0 50 100 150 200 250
4
6
8
10
12
14
16
18
20
22
24
26
First Circle-E
Second Circle-E
Third Circle-E
First Circle-F
Second Circle-F
Third Circle-F
Moisture Content (%)
Time (h)
Figure 7: Difference value between MC of each circle in
CA2 and EMC corresponding around air versus time.
0 50 100 150 200 250
2
4
6
8
10
12
14
16
18
20
22
24
First Circle-E
Second Circle-E
Third Circle-E
First Circle-F
Second Circle-F
Third Circle-F
Moisture Content (%)
Time (h)
Figure 8: Difference value between MC of each circle in
CA3 and EMC corresponding around air versus time.
Table 2 and Table 3 show the fitting results of m,
n, A, B for each specimen.
Table 2: Values of m and n from fitting curves of each
specimen
Specimen
Time/h
Parameter
m
n/×1E-3
CA1
0
26.40
-1.36
24
26.25
-1.94
48
26.46
-3.32
96
23.02
-4.13
144
19.25
-3.08
192
18.02
-3.11
240
16.41
-2.71
CA2
0
29.93
-3.92
24
29.67
-4.55
48
29.01
-4.94
96
23.67
-3.70
144
19.83
-2.80
192
15.80
-1.23
240
14.15
-2.35
CA3
0
26.70
-1.70
24
26.46
-1.95
48
24.90
-2.20
96
22.57
-3.33
144
19.22
-3.09
192
15.61
-2.18
240
10.75
-0.52
Table 3: Values of A and B from fitting curves of each
specimen.
Specimen
Circle
Parameter
A
B/×1E-3
CA1
1
st
18.62
-5.01
2
nd
20.37
-4.15
3
rd
20.81
-3.26
CA2
1
st
18.29
-4.68
2
nd
21.80
-4.51
3
rd
24.06
-4.54
CA3
1
st
19.30
-5.73
2
nd
20.52
-5.03
3
rd
21.78
-4.64
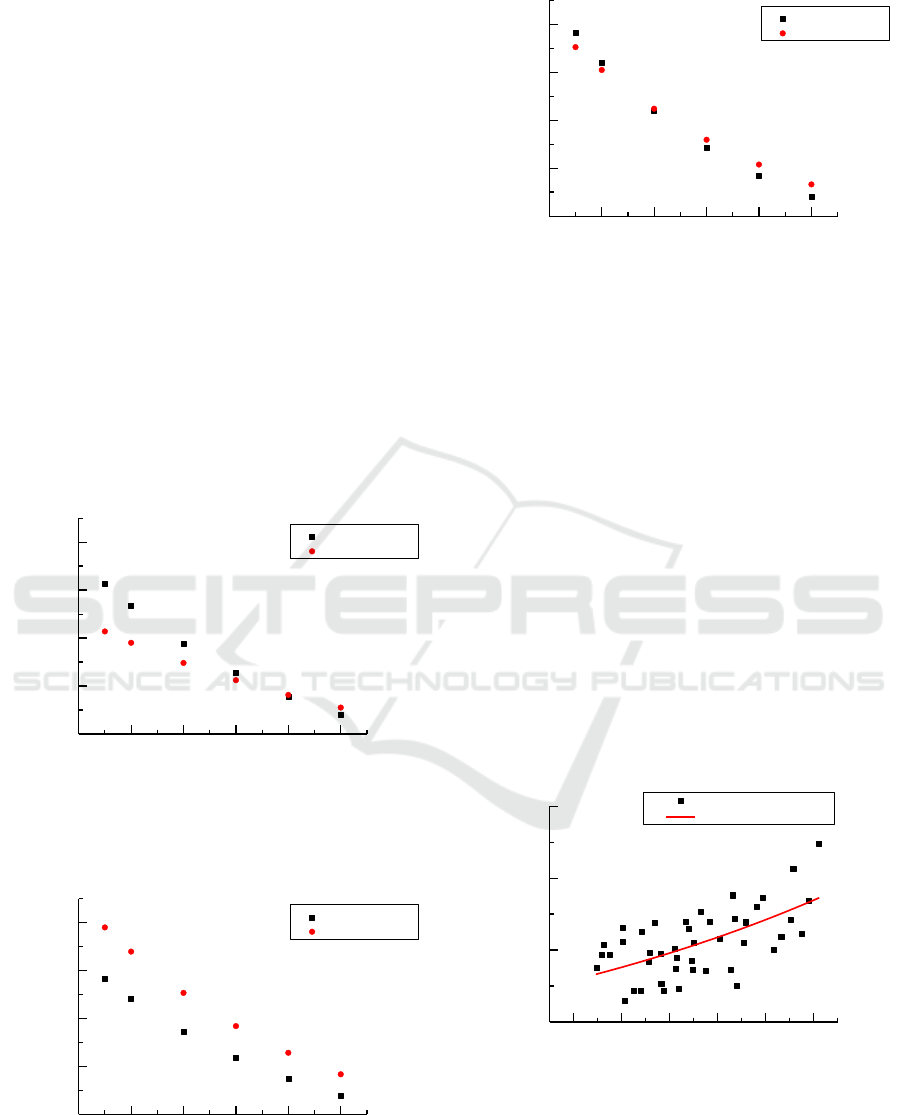
Figure 9, 10 and 11 show MC changing speed of
outside and inner circle of CA1, CA2 and CA3. It is
apparent that MC changing speed in every circle is
decreasing with time.
In CA1 and CA3, the changing speed of MC in
outside circle is quicker than the speed in inner
circle at the early period and then becoming slower.
The surface of timber member exchanges moisture
with ambient air directly, which induces the MC in
outside circle changes immediately. Then the
moisture in inner circle changed influenced by the
existence of MC gradient in different circles, but the
response of inner circle is late, which can be defined
Study of Moisture Transfer in Transverse Directions of Timber Members of Anhui Fir
147
as lag. During early period, due to the high MC
gradient, the MC changing speed is quick. With time
going, MC in outside circle is gradually close to
EMC of air, which reduces MC gradient in outside
circle and so the MC changing speed becomes much
slower at that position, while MC in inner circle
keeps changing quickly due to the high overall MC
gradient. This indicates that MC gradient has a great
influence in MC changing speed, the bigger the MC
gradient is, the quicker the speed will be.
But in CA2, the changing rate of MC in inner
circle keeps higher than that in outside circle. It can
be found from Figure 4 that the initial overall MC
gradient of CA2 is much larger than others, so the
MC in inner circle changes quicker than the outside
at the beginning. Apart from that, although the ring
width in each specimens are similar, the ring width
of CA2 is a little bit narrower than the others, which
means that the density of CA2 should also be larger.
With high density, it can be easier for CA2 to
translate moisture in inner circle, which is perhaps
the reason of such different speed happened in CA2.
0 48 96 144 192 240
2
4
6
8
10
CA1-First Circle
CA1-Third Circle
MC Changing Speed (×1E-2/%·h
-1
)
Time (h)
Figure 9: Comparing MC changing speed of inner and
outside circle in CA1.
0 48 96 144 192 240
2
4
6
8
10
CA2-First Circle
CA2-Third Circle
MC Changing Speed (×1E-2/%·h
-1
)
Time (h)
Figure 10: Comparing MC changing speed of inner and
outside circle in CA2.
0 48 96 144 192 240
2
4
6
8
10
CA3-First Circle
CA3-Third Circle
MC Changing Speed (×1E-2/%·h
-1
)
Time (h)
Figure 11: Comparing MC changing speed of inner and
outside circle in CA3.
Based on Table 2 and Table 3, D and S can be
calculated by equation (12), (16). And the fitting
curve of D versus MC is shown in Figure 12. The
relationship between diffusion coefficient and MC at
40 ℃ can be expresses as below:
2.66 2
RT
( ) ( ) 2.56 (mm / h)
u
D u D u e
(18)
where DR is diffusion coefficient in radial direction
and DT is diffusion coefficient in tangential
direction.
The value of S/D is approximately constant at
0.05/mm during the whole drying stage, so surface
emission coefficient of CA can be expressed as:
2.66
0.128 (mm/h)
u
Se
(19)
8 12 16 20 24 28
2
4
6
8
Difussion Coefficient-E
Diffusion Coefficient-F
Difussion Coefficient (mm
2
/h)
Moisture Content (%)
Figure 12: Diffusion coefficient data and fitting curve
versus MC.
MEEP 2018 - The Second International Conference on Materials Chemistry and Environmental Protection
148
4 NUMERICAL ANALYSIS
4.1 Finite Element Model (FEM)
According to the corresponding relationship shown
in table 1, DC2D4 (a 4 node-linear heat transfer
quadrilateral) was used in Abaqus to allow the
calculation of moisture transfer. All the geometric
and humidity field parameters set in FEM were the
same as experiment.
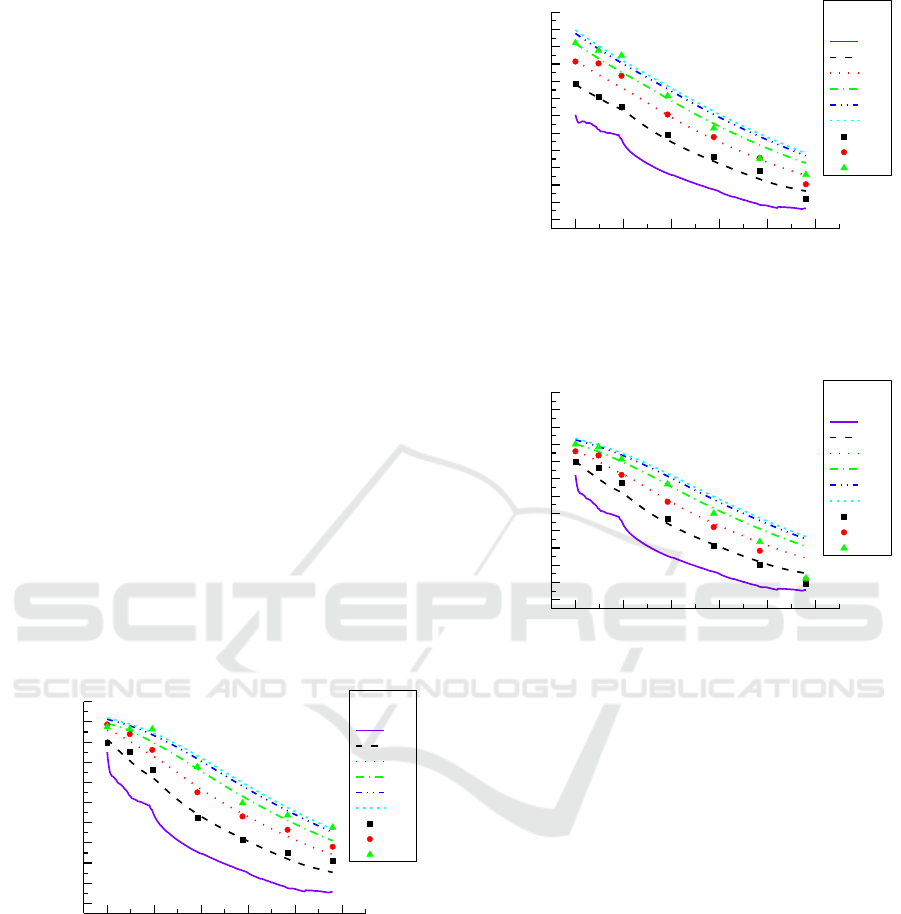
4.2 Results and Discussion
Figure 13, 14, and 15 compare MC of different
circles between experimental results and FEM
results, and plot MC in pith and surface calculated
by Abaqus as well. There is a good agreement
between experimental results and FEM results, and
the average relative error is less than 5%, which
proves the validity of this FEM and the correctness
of equation (18) and (19).
The FEM results show that the MC gradient
between surface and first circle increases during
early period, and then decreases, which is the same
trend as experiment shows. Additionally, the biggest
MC gradient occurs in out circle as well. This
explains the initial occurrence of shrinkage crack in
out circle of timber members, and the quick response
of outer circle to the environment.
0 50 100 150 200 250
8
10
12
14
16
18
20
22
24
26
28
Moisture Content (%)
Time (h)
50-A
40-A
30-A
20-A
10-A
0-A
40-E
30-E
20-E
Figure 13: Experimental results versus numerical FEM
calculations of CA1.
0 50 100 150 200 250
8
10
12
14
16
18
20
22
24
26
28
30
32
Moisture Content (%)
Time (h)
50-A
40-A
30-A
20-A
10-A
0-A
40-E
30-E
20-E
Figure 14: Experimental results versus numerical FEM
calculations of CA2.
0 50 100 150 200 250
8
10
12
14
16
18
20
22
24
26
28
30
32
Moisture Content (%)
Time (h)
50-A
40-A
30-A
20-A
10-A
0-A
40-E
30-E
20-E
Figure 15: Experimental results versus numerical FEM
calculations of CA3.
5 CONCLUSIONS
This paper describes a study of moisture transfer
perpendicular to grain in timber members made of
Anhui fir. Three cylindrical specimens were used to
test the essential parameters for calculating diffusion
coefficient and surface emission coefficient. Then a
Finite model method was used to analyse the
moisture transfer process. And the FEM results
agree well with the experiment. Fick’s second law of
moisture transfer in wood was used in all theoretical
derivation and numerical simulations. The primary
investigated results are listed below:
(1) The type of wood cannot be ignored when
calculating diffusion coefficient and surface
emission coefficient. It is not accurate to calculate
two coefficient by formula from other wood. And
authors analysed the D and S suitable for Anhui fir.
Study of Moisture Transfer in Transverse Directions of Timber Members of Anhui Fir
149

(2) MC in transverse cross-section of Anhui fir
shows polynomial distribution at any time, and
changes exponentially with time in drying
environment.
(3) MC gradient has a great influence in MC
changing speed, the larger the MC gradient is, the
quicker the speed will be.
(4) The method of substituting corresponding
variables in heat transfer in Abaqus to simulate
moisture transfer is valid.
Further research related to moisture transfer of
timber members in changing climate is still required.
Different initial MC distribution should also be
taken into consideration. Moreover, moisture-
induced stress and shrinkage cracks of timber
members are also essential research aspects for
timber buildings.
ACKNOWLEDGEMENTS
The authors would like to express their gratitude to
the whole staff in Key laboratory of concrete and
pre-stressed concrete structure of Ministry of
Education, Southeast University and Laboratory of
Modern Wood Structure, Nanjing University of
Technology for their technical support. And this
study was funded by the Thirteenth Five-Year
National Key Research and Development Program
(2017YFC0703503).
REFERENCES
Bonarski, J. T., Kifetew, G. & Olek, W. 2015, "Effects of
cell wall ultrastructure on the transverse shrinkage
anisotropy of Scots pine wood", Holzforschung, Vol.
69 No. 4, pp. 501-507.
Dietsch, P., Gamper, A., Merk, M. & Winter, S. 2015a,
"Monitoring building climate and timber moisture
gradient in large-span timber structures", Journal of
Civil Structural Health Monitoring, Vol. 5 No. 2, pp.
153-165.
Dietsch, P., Franke, S., Franke, B., Gamper, A. & Winter,
S. 2015b, "Methods to determine wood moisture
content and their applicability in monitoring
concepts", Journal of Civil Structural Health
Monitoring, Vol. 5 No. 2, pp. 115-127.
Fragiacomo, M., Fortino, S., Tononi, D., Usardi, I. &
Toratti, T. 2011, "Moisture-induced stresses
perpendicular to grain in cross-sections of timber
members exposed to different climates", Engineering
Structures, Vol. 33 No. 11, pp. 3071-3078.
Fortino, S., Mirianon, F. & Toratti, T. 2009, "A 3D
moisture-stress FEM analysis for time dependent
problems in timber structures", Mechanics of time-
dependent materials, Vol. 13 No. 4, pp. 333.
Hoyle Jr, R. J., Itani, R. Y. & Eckard, J. J. 2007, "Creep of
Douglas Fir Beams Due to Cyclic Humidity
Fluctuations", Wood and Fiber Science, Vol. 18 No. 3,
pp. 490-497.
Hoffmeyer, P. & Davidson, R. W. 1989, "Mechano-
sorptive creep mechanism of wood in compression and
bending", Wood Science and Technology, Vol. 23 No.
3, pp. 215-227.
Jia, D. & Afzal, M. T. 2007, "Modeling of moisture
diffusion in microwave drying of hardwood", Drying
technology, Vol. 25 No. 3, pp. 449-454.
Jönsson, J. 2005, "Moisture induced stresses in timber
structures". Lund, Lund Institute of Technology.
Kadem, S., Lachemet, A., Younsi, R. & Kocaefe, D. 2011,
"3d-Transient modeling of heat and mass transfer
during heat treatment of wood", International
Communications in Heat and Mass Transfer, Vol. 38
No. 6, pp. 717-722.
Konopka, D., Gebhardt, C. & Kaliske, M. 2017,
"Numerical modelling of wooden structures", Journal
of Cultural Heritage, Vol. 27, pp. 93-S102.
Mirianon, F., Fortino, S. & Toratti, T. 2008, "A method to
model wood by using ABAQUS finite element
software", Fire Safety Journal, Vol. 43.
Obe, J. D. 2002, Timber: its nature and behaviour, CRC
Press.
Qiu, L. 2015, "Performance of curved glulam beams under
load and moisture variations". Harbin, Harbin Institute
of Technology.
Ranta-Maunus, A. 2003, "Effects of climate and climate
variations on strength", Timber engineering, 153-167.
Skaar, C. 1958, "Moisture movement in beech below the
fiber saturation point", Forest Products Journal, No. 8,
pp. 352-357.
Siau, J. F. 1995, Wood: Influence of moisture on physical
properties, Dept. of Wood Science and Forest
Products, Virginia Polytechnic Institute and State
University.
Toratti, T. 1994, "Creep of timber beams in a variable
environment". Espoo, Teknillinen korkeakoulu.
Time, B. 2002, "Studies on hygroscopic moisture transport
in Norway spruce (Picea abies) Part 1: Sorption
measurements of spruce exposed to cyclic step
changes in relative humidity", Holz als Roh-und
Werkstoff, Vol. 60 No. 4, pp. 271-276.
Younsi, R., Kocaefe, D., Poncsak, S. & Kocaefe, Y. 2007,
"Computational modelling of heat and mass transfer
during the high-temperature heat treatment of wood",
Applied Thermal Engineering, Vol. 27 No. 8-9, pp.
1424-1431.
Zítek, P., Vyhlídal, T., Fišer, J., Tornari, V., Bernikola, E.
& Tsigarida, N. 2015, "Diffusion-model-based risk
assessment of moisture originated wood deterioration
in historic buildings", Building and Environment, Vol.
94, 218-230.
MEEP 2018 - The Second International Conference on Materials Chemistry and Environmental Protection
150
