
Establishment of a Rapid and Sensitive Chemiluminescence Enzyme
Immunoasay for Aflatoxin M
1
: Verified by HPLC
Min Li, Renrong Liu
*
, Lixin Zhu and Yu Jin
School of Life Science, Jiangxi Science & Technology Normal University, Jiangxi, Nanchang, 330013, China
Keywords: Aflatoxin M
1
, chemiluminescence enzyme immunoassay, high performance liquid chromatography
Abstract: A rapid and sensitive chemiluminescence enzyme immunoassay method (CLEIA) was established to detect
Aflatoxin M
1
(AFM
1
) in milk, which was Verified by high performance liquid chromatography (HPLC). It
only takes 30 minutes. Optimized conditions included antibody dilution ratio and enzyme conjugate, ionic
strength, pH value and organic solvent. Results: The 50% inhibitory concentration(IC
50
) and the detection
limit of the CLEIA were 0.08ng/mL and 0.024ng/mL, the recovery ranged from 86.94% to 114.49% in
dairy products. The correlation was 99.7% between this method and HPLC .
1 INTRODUCTION
AFM
1
is produced by hydroxylation when mammals
ingesting crops contaminated with Aflatoxin B1. It
has a destructive effect on liver tissue, with Strong
carcinogenicity and mutagenicity. At present, a lack
of effective method for prevention and
detoxification, so the monitoring of AFM
1
is an
important means to prevent and control.
At present, the analytical method mainly include:
high performance liquid chromatography (Shuib et
al., 2017) time-resolved fluorescence (Gao et al.,
2017), quantum dot immunoassay (Bailey et al.,
2004) and enzyme-linked immunosorbent assay
(Radoi et al., 2008) etc. Instrument method are
expensive, laborious, time-consuming, and sample
pretreatment cumbersome. In recent years, the
limited standard of AFM
1
is decreasing (eg:
Commission regulation EU No 165, 2010; GB
2761-2017 limits on mycotoxins in food, 2017), so it
is necessary to establish simple, rapid and high
sensitivity detection method to quantify and confirm
the AFM
1
in dairy products. However,
chemiluminescence enzyme immunoassay is
combination of ELISA and chemiluminescence, the
detection sensitivity is 10 ~ 102 orders of magnitude
than conventional ELISA (Zhao et al., 2009).
2 MATERI ALS AND METHODS
Instruments: Luminoskan Ascent and its software (
Thermo, USA), 96-well white polystyrene plates
(Costar), AFM
1
immunoaffinity column (Own
laboratory), High performance liquid
chromatography.
Reagents: AFM
1
standard solutionantigen and
anti-AFM
1
monoclonal antibody were got from our
own laboratory. IgG-HRP was purchased from
Sigma, Luminol chemiluminescent substrate was
purchased from Helisence (Shanghai, China)
2.1 CLEIA Operation
Chemiluminescent plate were coated with 120μL of
AFM
1
antigen per well for the night at 4℃ washed 4
times with PBS, added 320μL5% skim milk per
well, which incubated for 2h at 37℃, after washing 4
times, added 50μLstandard solution or sample
solution, 50μL antibody diluotin and 100μL
IgG-HRP per well at 37°C for 30min then washed 4
times, at last added 100μL Luminol
chemiluminescent substrate per well and get the
relative light unit (RLU).
2.2 Sample Preparation
Weighing 1g milk powder in centrifugal tube, adding
standard, adding 5ml acetonitrile (liquid milk take
3ml, add 3ml acetonitrile), vortex 5min and
Li, M., Liu, R., Zhu, L. and Jin, Y.
Establishment of a Rapid and Sensitive Chemiluminescence Enzyme Immunoasay for Aflatoxin M1: Verified by HPLC.
DOI: 10.5220/0008185300510054
In The Second International Conference on Materials Chemistry and Environmental Protection (MEEP 2018), pages 51-54
ISBN: 978-989-758-360-5
Copyright
c
2019 by SCITEPRESS – Science and Technology Publications, Lda. All rights reserved
51
centrifugal 15 minute for 4500r/min, remove the
underlying liquid and dry it with a nitrogen blower ,
then dissolve the residue with 5% skimmed milk for
test.
Sample pretreatment for liquid chromatography
is referred to 2016 National Food Safety Standard
determination of Aflatoxin M in Food (GB, 2016) .
3 RESULTS AND DISCUSSION
3.1 Optimization of the AFM
1
CLEIA
Reaction System
The concentration of the coating antigen was
optimized by the checkerboard titration, the coated
concentration between 0.25μg/mL to 2μg/mL. The
results show that 0.5μg/ml is the best coated
concentration. When antibody concentration was too
low, it led to a small RLUmax. Therefore, antibody
concentrations were selected from 1:2000 to 1:8000.
Finally, the best antibody dilution is 1: 2000.
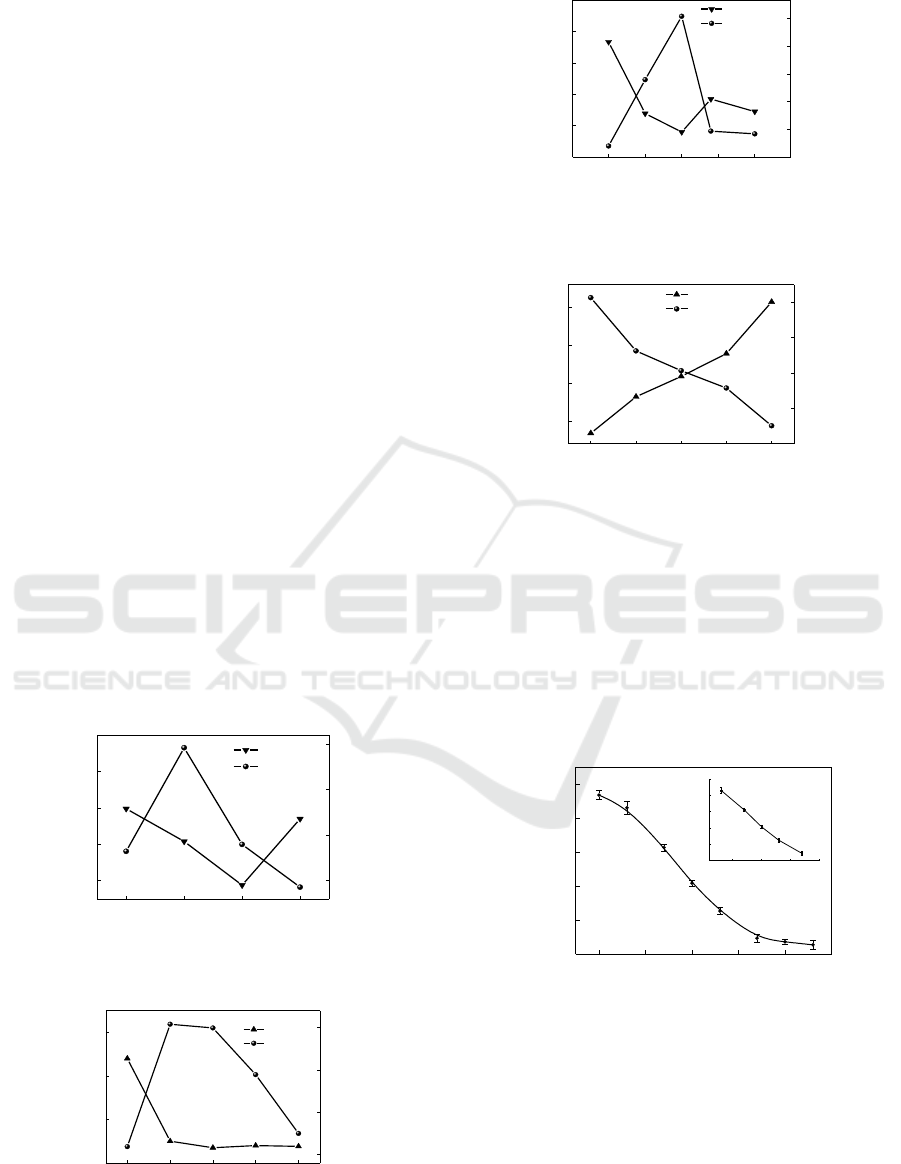
The RLUmax/IC50 ratio was used as a parameter
to judge the impact of factors. Research the effects
of enzyme dilution , ionic strength, pH value and
methyl alcohol on CLEIA. The results demonstrate
that optimum conditions when enzyme concentration
at 1: 500, ionic strength was 5mM , methyl alcohol
was 0 and pH was 7.0. As show in Figure 1-4. This
indicates that neutral buffer is beneficial to the
combination of AFM
1
antigen- antibody.
1:500 1:1000 1:2000 1:3000
0.05
0.06
0.07
0.08
0.09
IC
50
RLUmax/IC
50
ration of goat anti-mouse IgG -HRP
IC
50
20000
25000
30000
35000
RLUmax/IC
50
Figure 1: Effects of enzyme dilution on CLEIA.
0 5 10 15 20
0.06
0.08
0.10
0.12
IC
50
RLUmax/IC
50
PBS(mM)
IC
50
20000
25000
30000
35000
RLUmax/IC
50
Figure 2: Effects of ionic strength on CLEIA.
6.0 6.5 7.0 7.5 8.0
0.07
0.08
0.09
0.10
0.11
0.12
IC
50
RLUmax/IC
50
PH value
IC
50
27000
28500
30000
31500
33000
34500
RLUmax/IC
50
Figure 3: Effects of pH on CLEIA.
0 5 10 15 20
0.25
0.30
0.35
0.40
IC
50
RLUmax/IC
50
The concentration of methyl alcohol
IC
50
6000
8000
10000
12000
14000
RLUmax/IC
50
Figure 4: Effects of methyl alcohol on CLEIA.
3.2 Establishment of CLEIA Standard
Curve
Based on the optimization results, the standard curve
of AFM
1
immunoassay was established in Figure 5 .
The linear equation was Y = -55.228 +154.73 (R2 =
0.9916), The IC50 was 0.08ng/ml, the detection limit
was 0.024ng/ml.
1.0 1.5 2.0 2.5 3.0 3.5
0
20
40
60
80
100
1.5 2.0 2.5 3.0
0
20
40
60
80
100
B/B
0
(%)
Log(10 x AFM
1
)
y=-56.021x + 157.06
R
2
=0.9904
B/B
0
(%)
Log(10 x AFM
1
)
Figure 5: Competitive inhibition curve for AFM
1
by
CLEIA.
3.3 Verification by High Performance
Liquid Chromatography
A series of AFM
1
standard solutions (15, 10, 5, 2, 1,
0.5 and 0.1ng/mL) were prepared with 10%
MEEP 2018 - The Second International Conference on Materials Chemistry and Environmental Protection
52
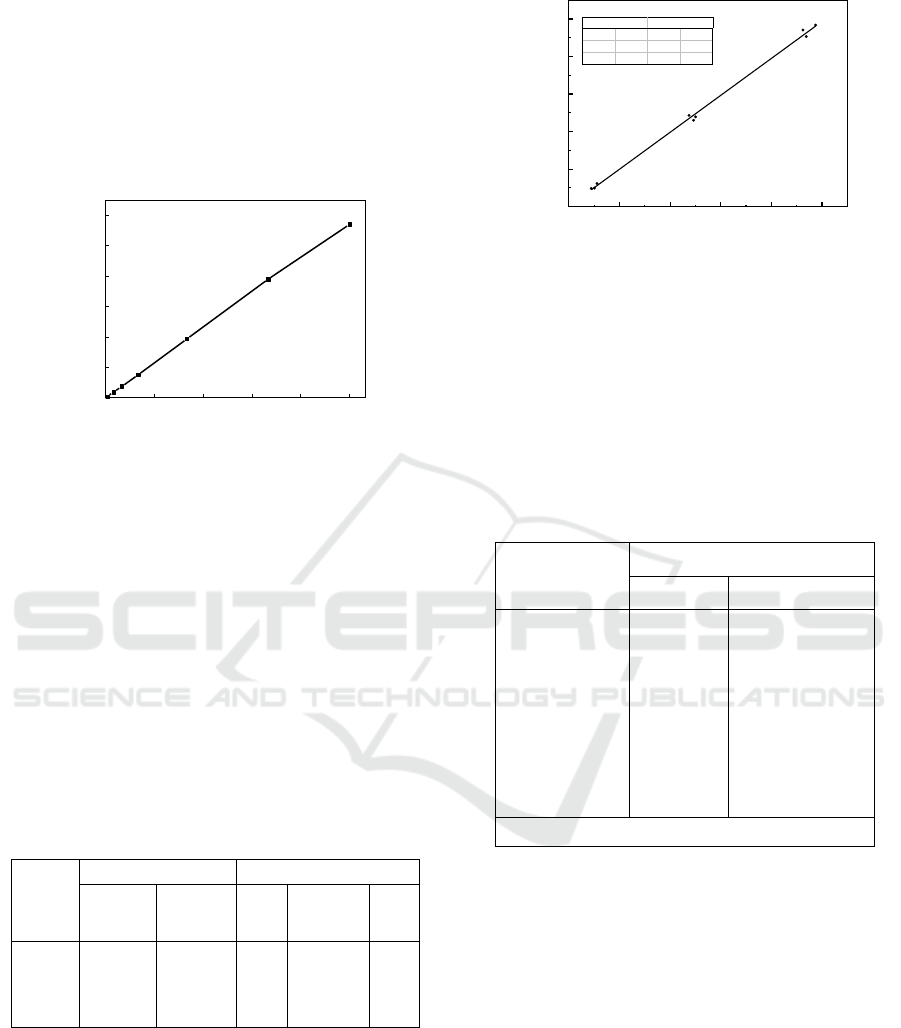
acetonitrile aqueous solution, chromatographic
conditions reference to GB of Aflatoxin M1. The
characteristic absorption peak of AFM
1
was obtained
and retention time was 8.993min in the set
chromatographic conditions. The SNR was 3:1 as the
minimumdetection limit, which was 0.075ng/mL and
the quantitative limit was 0.3ng/mL. As show in
Figure 6.
0 3 6 9 12 15
0
100
200
300
400
500
600
Peak area (m A u*S)
The concentration of AFM
1
(ng/ml)
Figure 6: HPLC stand curve for AFM
1
.
3.3.1 Recovery Test of Spiked Samples
To verify the accuracy and reliability of CLEIA, the
recovery experiments were carried out in different
dairy products, moreover it made a correlation with
HPLC. As shown in Table 1, the recovery ratio of
CLEIA was 86.94%-114.49, the coefficient of
variation was 0.81%-7.26%; the recovery by HPLC
was 85.25%-98.62%, and the coefficient of variation
was 0.72%-9.64%. Both methods have good
accuracy and Precision.
Table 1: Recoveries of AFM
1
in diferrent dairy products
(n=4).
Sample
number
CLEIA
HPLC
Spiked
value
(ng/ml)
Recovery
ratio (%)
CV
(%)
Recovery
ratio (%)
CV
(%)
1
2
0.1
0.5
0.1
0.5
90.78
109.08
114.49
86.94
5.15
0.81
7.26
3.74
92.76
98.62
96.14
85.25
9.64
0.72
2.95
3.37
3.3.2 Determination of AFM
1
in Naturally
Sample
Figure 7 shows in adding standard solution of AFM
1
(0.1ng/ml, 0.5ng/ml, 1ng/ml) in a milk sample ( The
milk sample used does not contain AFM
1
). Using
CLEIA and HPLC to test. The data show a high
degree of correlation between them (R2 = 0.997).
0.0 0.2 0.4 0.6 0.8 1.0
0.0
0.2
0.4
0.6
0.8
1.0
HPLC (ng/ml)
CLEIA (ng/ml)
Value Standa
B Interce 0.0019 0.0117
B Slope 0.9845 0.0189
Adj. R-Square 0.99704
Figure 7: Correlation between the CLEIA and HPLC.
From Table 2, it can conclude that the content of
AFM
1
in 10 samples detected by CLEIA and HPLC
was lower than the national limit. Besides AFM
1
was
not detected in ELISA in 10 samples, indicating that
the content of AFM
1
was lower than the minimum
detection line of this method, which is consistent
with the result of HPLC detection.
Table 2: AFM
1
detection in naturally sample.
Sample
number
Detected value(ng/mL)
CLEIA
HPLC
1
2
3
4
5
6
7
8
9
10
ND
ND
ND
ND
ND
ND
ND
ND
ND
ND
0.0089
ND
ND
ND
ND
ND
ND
0.0137
ND
ND
Note: “ ND ”(Not detected)
4 CONCLUSIONS
In the study, CLEIA reaction system has been
comprehensively optimized. Finally, the
immunoassay method of AFM
1
was established, and
the sensitivity was 0.024ng/ml. The recoveries
ranged from 86.94% to 114.49%, Meanwhile
correlation between the detection results of CLEIA
and high performance liquid chromatography was
99.7%, indicating that established method can be
applied to rapid determination of AFM
1
in milk.
y = 39.06x - 0.7854
R
2
= 0.9999
Establishment of a Rapid and Sensitive Chemiluminescence Enzyme Immunoasay for Aflatoxin M1: Verified by HPLC
53

REFERENCES
Bailey, R. E., Smith, A. M., Nie, S., 2004. Quantumdots in
biology and medicine. Physica E: Low-dimensional
Systems and Nanostructures, 25(1): 1-12.
European Economic Community Council., 2010.
Commission regulation (EU) No 165/2010. Official
Journal of European Communities, L50 : 8-12.
Gao, M. M., Zhou B. et al., 2017. A New Method for
Determination of Alfoxin M1 in Milk by
Ultrasensitive Time-Resolved fluoroimmunoassay.
food Anal. Methods, 3(2):1-8.
National Health and Family Planning Commission, State
Food and Drug Administration., 2016. GB 5009.
24-2016 National Food Safety Standard Determination
of Aflatoxin M in Food [S]. Beijing: China Standard
Press, 2016.
Radoi, A., Targa, M., Prieto-Simon, B. et al., 2008.
Enzyme-linked immunosorbent assay (ELISA) based
on superparamagnetic nanoparticles for aflatoxin M1
detection. Talanta, 77(1):138-143.
Shuib, N. S., Makahleh, A., Salhimi, S. M. et al., 2017.
Determination of aflatoxin M1 in milk and dairy
products using high performance liquid
chromatography-fluorescence with post column
photochemical derivazation. Journal of
Chromatography A, 15(10): 51-56.
The ministry of health of the People's Republic of China.,
2017. GB 2761-2017 limits on mycotoxins in food [S].
Beijing: China standard press, 2017.
Zhao, L. X., Sun, L., Chu, X. G., 2009.
Chemiluminescence immunoassay. Trends in
Analytical Chemistry, 28(4): 404-415.
MEEP 2018 - The Second International Conference on Materials Chemistry and Environmental Protection
54
