
Comparison of Minimal Inhibitory Concentration Level in Vitro of
Itraconazole and Fluconazole against Malassezia furfur in Patients
with Pityriasis Vesicolor in Makasar
Dian Anggraeni, Olivia Wibisono, Safruddin Amin, Andi Muhammad Adam, Khairuddin Djawad
Department of Dermatology and Venereology, Hasanuddin University Faculty of Medicine, Makassar, Indonesia.
Keywords: Fluconazole, Itraconazole, Minimal Inhibitory Concentration, MIC, Malassezia furfur, Pityriasis vesicolor
Abstract: Pityriasis Versicolor (PV), the second most common dermatomycosis in Indonesia, is a superficial fungal
infection that is frequently reported in the tropics with warm temperatures and high humidity, as in Makassar.
Recurrence and long course of disease in PV is most often caused by M. furfur species. Hence, oral antifungal
is commonly used in extensive, recalcitrant and recurrent infections. The aim of this study is to assess the
MIC of Itraconazole (ITC) and Fluconazole (FLC) against M. furfur of PV patients in Makassar. This is a
multi-center cross sectional observational study with consecutive sampling of 21 isolates from PV patients in
Makassar, with the identification of M. furfur from morphological (culture using modified Dixon agar) and
biochemical criteria (catalase test and lipid assimilation test using Tween-20, 40, 60, 80, Cremophor El). Our
study shows MIC for ITC and FLC against M. furfur ranged from <0.03-0.25 μg/mL and <0.03-2 μg/mL,
respectively with MIC of ITC is lower than FLC. The regimen of ITC as systemic antifungal therapy for PV
patients in Makassar, particularly caused by M. furfur might be a more effective option.
1 INTRODUCTION
Pityriasis Versicolor or tinea versicolor is a
superficial fungal infection characterized by changes
in skin pigment caused by colonization of lipophilic
dimorphic fungi from the normal skin flora of the
stratum corneum (Moniri et al, 2009). This disease is
spread throughout the world but more often in the
tropics with warm temperatures and high humidity, as
in Makassar(Muhammad et al, 2009). In the tropics
the prevalence is 30-40% and the frequency becomes
higher in summer. Pityriasis Versicolor is the second
most common dermatomycosis after dermatophytosis
in Indonesia(Krisanty et al, 2009) Malassezia is a
lipophilic dimorphic fungus belonging to normal
flora and can be isolated from skin scrapings that
originate from almost all areas of the body, especially
in areas rich in sebaceous glands such as the chest,
back and head area (Krisanty et al, 2009). Identifies
Malassezia species in 98 PV patients based on
morphological observation and biochemical
evaluation in which M. furfur (42.9%) was the most
prevalent species.
Pityriasis Versicolor does not affect health
significantly but has psychological and social
implications. The optimal treatment of PV should
consider the effectiveness of the drug, safety, cost,
and patient complaints. Topical antifungal is the first
line of therapy, but in some patients complain of
unsatisfactory response, short-term success, and
regular application or longer treatment periods
especially for large lesions, prompt the consideration
of systemic antifungal (Silva et al, 1998). Antifungal
has its breakthrough since the discovery of azole
group, which has been shown to be safer than
previous antifungal agents. The azole agents exert its
antifungal property by inhibiting the cytochrome
P450, 14-alpha-demethylase enzyme. In addition
topical therapy has a high recurrence rate up to 60%
in the first year and 80% increase in the second year
(Hu and Bigby, 2010). Oral antifungal is commonly
used in extensive, recalcitrant and recurrent
infections, as it can penetrate keratin, while M. furfur
thrive at the base of the keratin layer (Pantazidou and
Tebruegge, 2007). Several studies have suggested
that ketoconazole (KTC), itraconazole (ITC), and
fluconazole (FLC) have been shown to produce high
clinical and mycological cure rates in patients with
PV.
ITC is a triazole group antifungal which is a
powerful keratophilic and lipophilic agent, having a
Anggraeni, D., Wibisono, O., Amin, S., Adam, A. and Djawad, K.
Comparison of Minimal Inhibitory Concentration Level in Vitro of Itraconazole and Fluconazole against Malassezia furfur in Patients with Pityriasis vesicolor in Makasar.
DOI: 10.5220/0008153101630166
In Proceedings of the 23rd Regional Conference of Dermatology (RCD 2018), pages 163-166
ISBN: 978-989-758-494-7
Copyright
c
2021 by SCITEPRESS – Science and Technology Publications, Lda. All rights reserved
163

similar mechanism by inhibiting 14-alpha-
demethylase resulting in disruption of sterol synthesis
in the cell wall of the fungus. In vitro ITC is not only
active against Malassezia species and Candida
species but is also active against dermatophyte and
nondermatophyte fungi. The dose of ITC used for PV
is 200 mg/day for 7 days, with a minimum
accumulative dose of 1000 mg for effective therapy.
Four weeks after initial therapy, a cure rate of 80-90%
has been reported (Faergemann et al, 2002). FLC is
another antifungal class of azole with a high
absorption rate, in which optimum concentrations can
be found in the skin several hours after being
consumed in small doses. Benefits of FLC includes
rare side effects, mostly available, and preferred as it
requires only two or three weekly doses, compared
with a 7-day regimen for ITC (200 mg/day) (Silva et
al, 1998). In vitro susceptibility tests of the
Malassezia species to KTC, Voriconazole (VRC),
ITC and FLC were performed by Miranda et al. which
reported that the Malassezia species are highly
susceptible to the four azole preparations, but the
susceptibility to KTC and ITC appears higher
(Miranda et al, 2007).
This study was conducted to assess the minimal
inhibitory concentration (MIC) antifungal ITC and
FLC against M. furfur as the causative agent of PV in
Makassar in vitro. Previous in vitro research in
Makassar has not been done even though ITC and
FLC are one of the most effective modes of PV
therapy for recurrent cases after treatment with
topical antifungal, safer than other antifungal, and
readily available.
2 METHODS
This study is a multi-center cross sectional
observational study with consecutive sampling that
was performed in microbiology laboratory of
Hasanuddin University Faculty of Medicine in 2013.
Specimen of 21 samples were collected by skin
scraping from the back or shoulder, upper arm, chest,
face and neck of PV patients from Dr. Wahidin
Sudirohusodo Hospital and Hasanuddin University
Dermatovenereology Department’s networking
hospital in Makassar, of whom the diagnosis of PV
was confirmed by Wood’ s lamp, direct microscopic
KOH preparation, culture and signed the informed
consent. Then the specimen was planted on the
modified Dixon agar plate, incubated at 32-34°C and
was regularly assessed to confirm the growth of yeast
until the 3
rd
week. Furthermore, the yeast was
identified by their morphology, catalase test and lipid
assimilation test (growth of yeast in the presence of
Tween-20, 40, 60, 80 and Cremophor El).
The in vitro susceptibility test by determining
MIC value of both antifungals was conducted using
broth microdilution that was performed in accordance
with the NCCLS guidelines in document M27-A2.
The inoculum suspension was prepared by the
spectrophotometric method obtaining a final
inoculum of (0.5-2.5)x10
3
cells/mL. The final
concentrations of the antifungal agents (ITC and
FLC) were 128µg/mL which then diluted half in
series and was inoculated to suspension hence
obtaining concentrations of 128 µg/mL, 64 µg/mL, 32
µg/mL, 16 µg/mL, 8 µg/mL, 4 µg/mL, 2 µg/mL, 1
µg/mL, 0.5 µg/mL, 0.25 µg/mL, 0.125 µg/mL, 0.06
µg/mL, and 0.03 µg/mL with false positive and false
negative control prepared. Growth of each various
concentrations of all two drugs was recorded every 24
h for 5 days of incubation at 32 ◦C. Cell growth was
compared with growth in a drug-free control. The
MIC was defined as the lowest concentration of agent
that produced none or 90% growth in comparison
with the control. Data analysis was performed using
SPSS. The Fisher Exact test was used to analyze the
mean and distribution frequency of each drug with P
value <0.05 is considered significant.
3 RESULT
Based on the morphological and biochemical
characteristics, the 21 isolates were identified as M.
furfur. MIC showed apparent differences in
antifungal susceptibility against M. furfur. For all 21
isolates, the MIC for ITC ranged from <0.03–
0.25µg/mL and <0.03–2µg/mL for FLC. The MIC
ranged, MIC90 values and MIC percentage for M.
furfur are presented in Table 1 and Figure 1.
RCD 2018 - The 23rd Regional Conference of Dermatology 2018
164
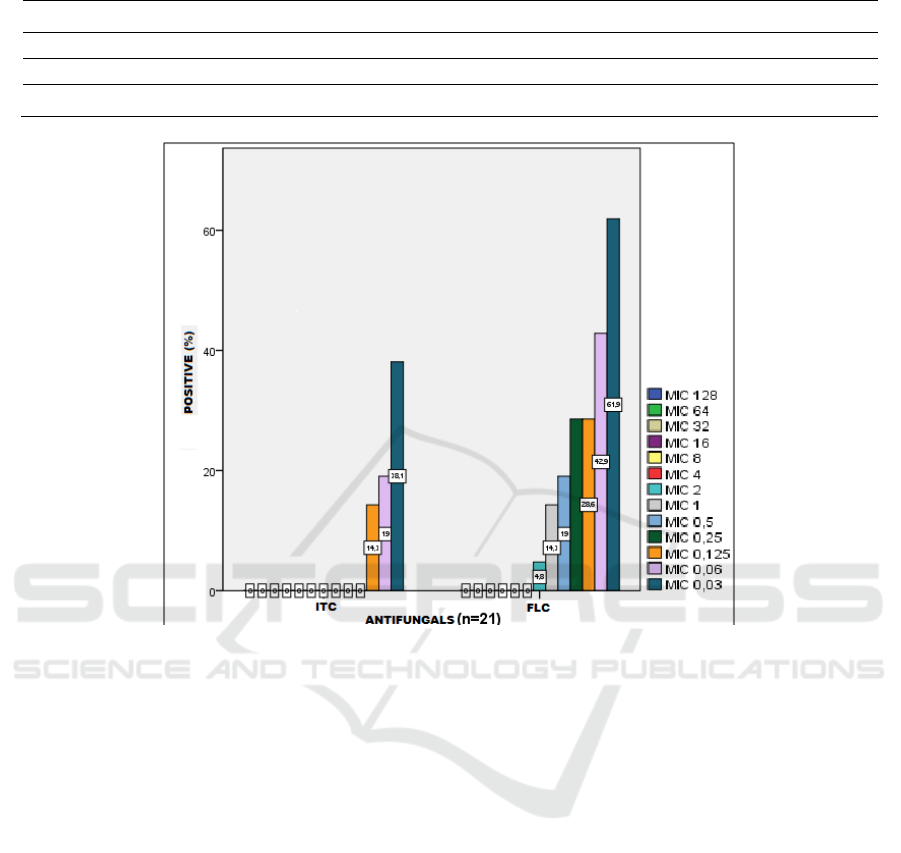
Table 1. MIC comparison of ITC and FLC against M. furfur isolates
Antifun
g
als
MIC cumulative
p
ercenta
g
e (%) of 21 isolates M. furfur
128 64 32 16 8 4 2 1 0.5 0.25 0.125 0.06 0.03 <0.03 MIC90
ITC 0 0 0 0 0 0 0 0 0 0 14.3 19 38.1 61.9 0.25
FLC 0 0 0 0 0 0 4.8 14.3 19 28.6 28.6 42.9 61.9 33.3 2
Figure 1. MIC comparison of ITC and FLC against M. furfur isolates.
4 CONCLUSION
In summary, our study shows MIC for ITC and FLC against
M. furfur ranged from <0.03-0.25 μg/mL with MIC90 0.25
μg/mL and <0.03-2 μg/mL with MIC90 2 μg/mL,
respectively. M. furfur isolates of our PV patients in
Makassar are still sensitive to both antifungals, with MIC
of ITC is lower than FLC. Thus, the regimen of ITC as
systemic antifungal therapy for PV patients in Makassar,
particularly caused by M. furfur might be a more effective
option although further studies based on clinical trials are
needed to confirm this
.
ACKNOWLEDGEMENT
We would like to express our gratitude to our
supervisors in Hasanuddin University Department of
Dermatology and Venereology for their guidance,
encouragement and useful critiques of this research.
REFERENCES
Faergemann, J., Gupta, a K., Al Mofadi, a, Abanami, a,
Shareaah, a A., Marynissen, G., 2002. Efficacy of
itraconazole in the prophylactic treatment of pityriasis
(tinea) versicolor. Archives of dermatology 138, 69–73.
doi:dst10021 [pii]
Guého-Kellermann, E., Boekhout, T., Begerow, D., 2010.
Biodiversity, Phylogeny and Ultrastructure, in:
Malassezia and the Skin: Science and Clinical Practice.
Springer Berlin Heidelberg, pp. 17–63.
doi:10.1007/978-3-642-03616-3_2
Gupta, A.K., Kohli, Y., Li, A., Faergemann, J.,
Summerbell, R.C., 2000. In vitro susceptibility of the
seven Malassezia species to ketoconazole,
voriconazole, itraconazole and terbinafine. British
Journal of Dermatology 142, 758–765.
doi:10.1046/j.1365-2133.2000.03294.x
Hu, S.W., Bigby, M., 2010. Pityriasis versicolor: a
systematic review of interventions. Archives of
Dermatology 146, 1132–1140.
doi:10.1001/archdermatol.2010.259
Machowinski, A., Krämer, H.J., Hort, W., Mayser, P.,
2006. Pityriacitrin - A potent UV filter produced by
Comparison of Minimal Inhibitory Concentration Level in Vitro of Itraconazole and Fluconazole against Malassezia furfur in Patients with
Pityriasis vesicolor in Makasar
165

Malassezia furfur and its effect on human skin
microflora. Mycoses 49, 388–392. doi:10.1111/j.1439-
0507.2006.01265.x
Miranda, K.C., de Araujo, C.R., Costa, C.R., Passos, X.S.,
de Fátima Lisboa Fernandes, O., do Rosário Rodrigues
Silva, M., 2007. Antifungal activities of azole agents
against the Malassezia species. International Journal of
Antimicrobial Agents 29, 281–284.
doi:10.1016/j.ijantimicag.2006.09.016
Moniri, R., Nazeri, M., Amiri, S., Asghari, B., 2009.
Isolation and identification of malassezia spp. in
Pytiriasis versicolor in Kashan, Iran. Pakistan Journal
of Medical Sciences 25, 837–840.
Muhammad, N., Kamal, M., Islam, T., Islam, N.,
Shafiquzzaman, M., 2009. A study to evaluate the
efficacy and safety of oral fluconazole in the
treatment of tinea versicolor. Mymensingh medical
journal : MMJ 18, 31–35.
Ochoa de Quinzada MM. 2006. Estudio de las especies de
Malassezia, relacionadas con la patología cutánea,
Pitiriasis Versicolor en Panama.
Pantazidou, A., Tebruegge, M., 2007. Recurrent tinea
versicolor: Treatment with itraconazole or fluconazole?
Archives of Disease in Childhood.
doi:10.1136/adc.2007.124958
Krisanty, R.I.A., Bramono, K., Made Wisnu, I., 2009.
Identification of Malassezia species from pityriasis
versicolor in Indonesia and its relationship with clinical
characteristics. Mycoses 52, 257–262.
doi:10.1111/j.1439-0507.2008.01593.
Rex, J.H.H., Pfaller, M. a. a, Walsh, T.J.J., Chaturvedi, V.,
Espinel-Ingroff, D., Ghannoum, M. a. a, Gosey, L.L.L.,
Odds, F.C.C., Rinaldi, M.G.G., Sheehan, D.J.J.,
Warnock, D.W.W., Espinel-Ingroff, a., 2001.
Antifungal susceptibility testing: practical aspects and
current challenges. Clin Microbiol Rev 14, 643–658.
doi:10.1128/CMR.14.4.643
Rincón, S., Cepero De García, M.C., Espinel-Ingroff, A.,
2006. A modified Christensen’s urea and CLSI broth
microdilution method for testing susceptibilities of six
Malassezia species to voriconazole, itraconazole, and
ketoconazole. Journal of Clinical Microbiology 44,
3429–3431. doi:10.1128/JCM.00989-06
Velegraki, A., Alexopoulos, E.C., Kritikou, S., Gaitanis, G.,
2004. Use of fatty acid RPMI 1640 media for testing
susceptibilities of eight Malassezia species to the new
triazole posaconazole and to six established antifungal
agents by a modified NCCLS M27-A2 microdilution
method and Etest. Journal of Clinical Microbiology 42,
3589–3593. doi:10.1128/JCM.42.8.3589-3593.2004
RCD 2018 - The 23rd Regional Conference of Dermatology 2018
166
