
Prediction of Area Vulnerable to Gullying based on
Geomorphic Threshold Theory
W J Wang
1
and R X Deng
2,
*
1
College of Resources and Environment, Henan University of Economics and Law
450002, Zhengzhou, China
2
School of Resources and Environment, North China Institute of Water Resources
and Electric Power, 450011, Zhengzhou, China
Corresponding author and e-mail: R X Deng, rongxin-001@163.com
Abstract. Chosen type Black Soil Area of Northeast China which locates in the Wuyuer river
and Nemoer river basin as study area, taken SPOT5 imagery as data source, gully distribution
data in 2005 was get. At the same time, taken 1:50000 relief maps as data source, DEM was
obtained and then it extracted the slope and accumulation area of headcut. Based on the
geomorphic threshold theory S=aA
-b
, it acquire the geomorphic threshold model of study area
S=1.2482A
-0.0936
. By the model, the area vulnerable to gullying was predicted. It showed that
the percent of correct prediction gully pixels is 79.43%, and the percent of area vulnerable to
gullying is 51.79%.The prediction accuracy is 0.723%. The prediction of area vulnerable to
gullying has a acceptable accuracy. The model can discern the area vulnerable to gullying and
it can provide scientific suggestion for the erosion control.
1. Introduction
Gully erosion is the main research content in the soil erosion, and now geomorphic threshold theory
has much more application in the gully erosion research. Based on this theory, gully occurrence can
be predicted. Now there are many researches based on this theory in different countries and they get
different gully occurrence geomorphic threshold[1-3]. Based on the geomorphic threshold, the areas
vulnerable to gullying was predicted in their research area.
At present, for geomorphic threshold theory, the most research used the data slope(S) and
accumulation area(A) from the fieldwork, and only a few used the data S and A extracted by DEM.
Besides, these researches were often on the small scale to monitor 3 to 5, even decade gullies to
obtain the gully parameters using GPS in 3 to 5 years [4-6]. There are little researches on large scale.
In this paper, using SPOT5 image as basic data source, gully were obtained and the data S and A
extracted by DEM, then the geomorphic threshold model at the 10 thousand km2 were obtained.
Based on the model, the accuracy of model was evaluated and the area vulnerable to gullying was
predicted.
718
Wang, W. and Deng, R.
Prediction of Area Vulnerable to Gullying based on Geomorphic Threshold Theory.
In Proceedings of the International Workshop on Environmental Management, Science and Engineering (IWEMSE 2018), pages 718-722
ISBN: 978-989-758-344-5
Copyright © 2018 by SCITEPRESS – Science and Technology Publications, Lda. All rights reserved

2. Study area and data source
2.1. Study area
Chosen type Black Soil Area of Northeast China which locates in the Wuyuer river and Nemoer river
basin as study area, the study area is located in the middle of HeiLongJang Province in China and its
total area is about 23 thousands km
2
where the city of Wudalianchi in the north, and Mingshui county
in the South, and the city of Beian in the East ,and Fuyu County in the West. In geomorphology, it is
in the transition zone of lesser Hinggan Mountains and Songnen plain and the geomorphology
characteristic is Rolling Hilly. Slope is much more gentle, often lower 5°. The major agrotype is type
black soil, besides meadow soil and bog soils are mainly in the low-lying wetland plain. Black soil
has high organic matter, loose texture and big spacing and make it easy to accelerate erosion. The
altitude is 150-600m and the altitude in the northeast is 200-500m where is highland, and
corresponding, the southwest is rolling hilly plain. The study area falls into a temperate continental
monsoon climate. Its mean annual temperature is 0.2°C -1.5°C . Its mean annual rainfall is 550mm-
600mm and mean depth of runoff is about 75mm. Wuyuer river, Nemoer river,Shuangyang river,
Laolai river and Runjin river are the main rivers in this region. The vegetation has the characteristic
of interleaving of forest and meadow plain and it belongs the Mongolia vegetation zone.
2.2. Data source
Tweleve scenes cloud-free 2.5m resolution simulation true color SPOT5 images were as data source.
Then according to the image characteristic, such as tone and texture, with the help of expert
knowledge and about 20 days field survey, the gully interpretation signs were build. Then, taken
ArcView software as platform, combined with expert experience, reference to topographic maps and
other related information, the gully distribution data in 2005 were acquired. Then validation work
was undertaken from 12 November 2008 to 15 November 2008. At last, according validation results,
the gully data were modified, and the final results were get. It suggests that the gully interpretation
precision is greater than 95%.
For DEM data: First, contour and elevation spot were obtained by digiting the scale of 1:50
thousands topographic maps. Then with the digital contour and elevation spot, using TOPGRID
arithmetic, it created the 5m resolution DEM. Then the S and A were extracted.
3. Method
3.1. Model conception
Geomorphic threshold model is as follows:
S=aA
-b
(1)
Where S is slope of headcut; A is accumulation area; a,b are coefficient which are no units.
It can confirm the geomorphic threshold model by extracted the S and A .There are two important
application. One is that a parallel line below the lower limit of the scatter of the data defines the limit
below which valley floors are stable. Another is that the line of best fit through the data represents
the mean topographic threshold conditions for gullying. The first application is mainly used to gully
prediction and the other is used to the analysis of dominant gully process.
3.2. Model application
By the gully data and DEM , it get the S and A of the headcut. Then, it used the parallel line below
the lower limit of the scatter of the data to get the geomorphic threshold model (Figure 1). The model
was as follows:
S
=1.2482A
-0.0936
(2)
Prediction of Area Vulnerable to Gullying based on Geomorphic Threshold Theory
719
By the above model, it counted the critical slope (S
a
), then let critical slope (S
a
) compare with the
slope(S) of study area. If S-S
a
>=0, it shows the possibility of gully occurrence and the area
vulnerable to gullying. Vice versa, the result is opposite. Then it used the model and the geomorphic
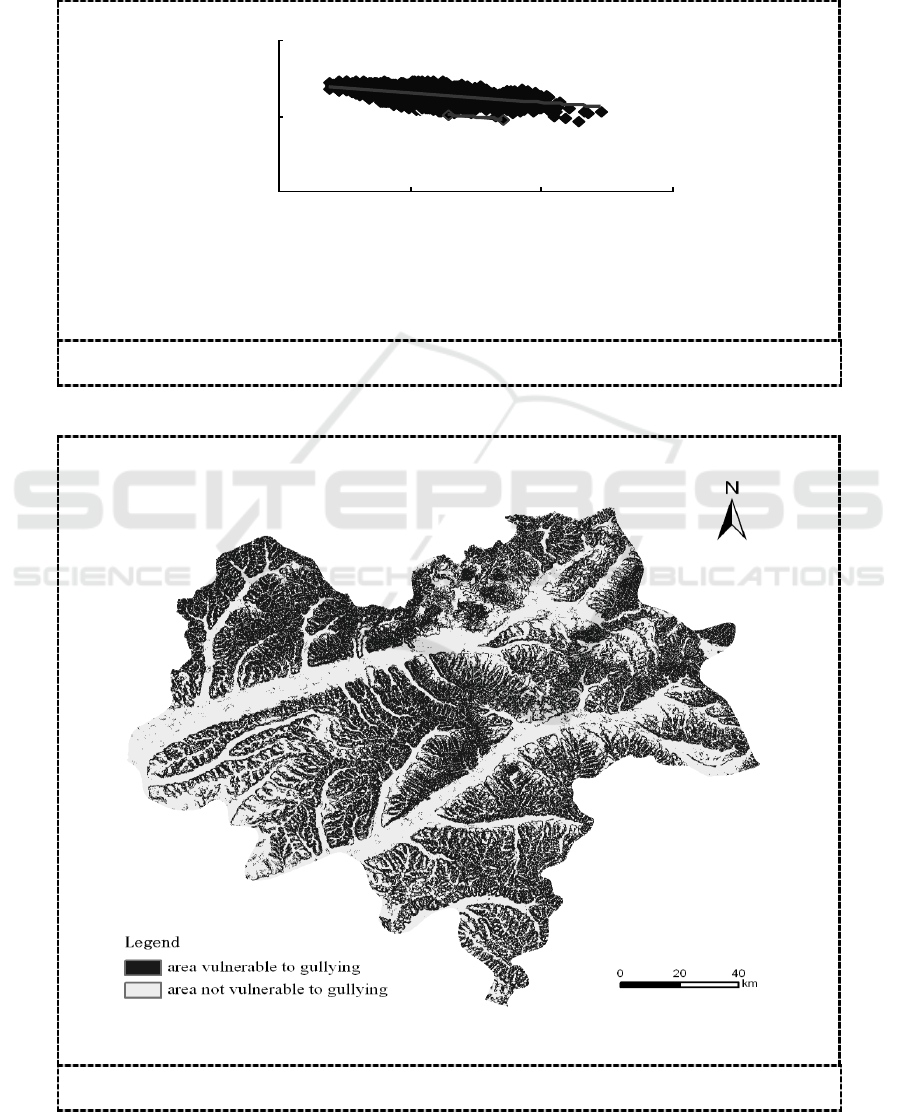
map, it get the prediction map of area vulnerable to gullying in the study area (Figure 2).
0
1
100
0 1 1000 1000000
accumulation area(ha)
local slope(m/m)
Figure 1. The geomorphic threshold model map.
Figure 2. The prediction of area vulnerable to gullying in the study area.
IWEMSE 2018 - International Workshop on Environmental Management, Science and Engineering
720

4. Results and analysis
4.1. Spatial distribution of area vulnerable to gullying
According to the figure 2, the area not vulnerable to gullying was mainly in the water, alluvial flat
and ridge, but the area vulnerable to gullying was located in all the part of the study area. In a word,
the prediction is much more better. Most of gully formed in the area vulnerable to gullying, but there
were little region not correct. The main reason was that the seasonal river was mistook by gully, so it
brought the mistake. Otherwise, for some gully, it existed in the area not vulnerable to gullying, and
it maybe cause by the headward erosion and gullywall extension.
4.2. Accuracy analysis
From the table1, the percent of correct prediction gully pixels is 79.43%, and the percent of area
vulnerable to gullying is 51.79%.The prediction accuracy is 0.723%. It can conclude that the percent
of correct prediction gully pixels is very high, but the prediction accuracy is low. However the low
prediction accuracy caused not by the model, and the main reason is that most of the region is no
gully at present. For the geomorphic threshold model, it predicts all the area vulnerable to gullying,
so it is only a conservative evaluation and its prediction is maximum. Otherwise, the mode of land
use and the environment condition do not reach the threshold value. As a whole, with the geomorphic
threshold model, the prediction of area vulnerable to gullying has a acceptable accuracy. By the
conservative evaluation, it can help the land managers to better understand the area vulnerable to
gullying and make the appropriate soil protect strategy.
Table 1. Gully prediction accuracy.
total pixels
in study area
186346602
pixels of gully
in study area
879035
prediction
equation
total
prediction
gully
pixels
correct
prediction
gully
pixels
percent of
prediction pixels
in the study area
(%)
percent of correct
prediction
gully pixels
(%)
prediction
accuracy
(%)
S=1.2482A
-0.0936
96507467
698183
51.79
79.43
0.723
Remark: prediction accuracy = correct prediction gully pixels/ pixels of gully in study area
5. Conclusions
Based on the geomorphic threshold theory, with the gully data, it build the geomorphic threshold
model fit for the study area and by this model the area vulnerable to gullying was predicted. In a
word, the prediction of area vulnerable to gullying has a acceptable accuracy. The model can discern
the area vulnerable to gullying and it can provide scientific suggestion for the erosion control.
Besides, this is only a conservative evaluation, the area vulnerable to gullying is not the region which
must form gully. Because vegetation, landuse and other natural and human factors all affect the gully
form beside of the terrain. So how to combine with above factors, then further analyze the area
vulnerable to gullying, such high danger region, much high region is very critical.
Acknowledgement
This work was supported by the National Natural Science Foundation of China under Grant number
41601458 and the Key Technologies Research and Development Program of Henan Province under
Grant number 142102110147.
Prediction of Area Vulnerable to Gullying based on Geomorphic Threshold Theory
721

References
[1] Vandekerckhove L, Poesen J and Oostwoud Wijdenes D 2000 Characteristics and Controlling
Factors of Bank Gullies in Two Semi-arid Mediterranean Environments Geomorphology
v33 pp7-58
[2] Cheng H, Zou X, Wu Y, Zhang C, Zheng Q and Z Jiang 2007 Morphology Parameters of
Ephemeral Gully in Characteristics Hillslopes on the Loess Plateau of China Soil & Tillage
Research v94 pp4-14
[3] Claudio Z and Raniero Della Peruta A C 2006 Effects of Land Use and Landscape on Spatial
Distribution and Morphological Features of Gullies in an Agropastoral Area in Sardinia
(Italy) Catena v68 pp87-95
[4] Vandaele K, Poesen J, Govers G and B Wesemael 1996 Geomorphic Threshold Conditions
for Ephemeral Gully Incision Geomorphology v16 pp161-173
[5] Begin Z B and Schumm S A 1979 Instability of Alluvial vValley Floors: A Method for Its
Assessment Transactions of the American Society of Agricultural Engineers v22 pp347-
350
[6] Vandekerckhove L B M, Poesen J and DeWeerdt B 2000 A Method for Dendrochronological
Assessment of Medium-term Gully Erosion Catena v45 pp123-161
IWEMSE 2018 - International Workshop on Environmental Management, Science and Engineering
722
