
An Evaluation System for Mathematical Models of Reservoir
Sedimentation along the Yellow River
M Ye
1,*
, H H Hu
2
, R L Xia
3
and Y Liu
4
1
China Institute of Water Resources and Hydropower Research, Beijing, China;
2
China Institute of Water Resources and Hydropower Research, Beijing, China;
3
Yellow River Institute of Hydraulic Research, Zhengzhou, China;
4
China Institute of Water Resources and Hydropower Research, Beijing, China;
Corresponding author and e-mail: M Ye,yemao@iwhr.com
Abstract. Based on theoretical research and measured data analysis, a multi-target and
quantifiable assessment system for mathematical models of reservoir sedimentation was
established. In this system, both typical physical model tested data and prototype materials
were used to form a case database. The indexes were selected individually. Both analytic
hierarchy process and structural equation models were adopted. The system can conduct
quantitative assessments of numerical simulations for sediment levels within sediment laden
river-reservoir systems.
1. Research objective
Mathematical models for reservoir sediment are commonly used to predict sediment transport and its
accumulation within reservoirs. These models also provide important tools to study corresponding
fundamental theories[1]. When assessing the suitability of mathematical models to real-world cases,
expert consultation and review systems are traditionally used. However, subjectivity is virtually
unavoidable. Up to the present, only a few comparison studies between similar mathematical models
have been conducted. Many of these models are designed only for typical cases and have no
established standards of evaluation which are based on benchmark model libraries. Therefore, a need
exists for systematic research on how to assess the reliability, accuracy, and integrated performance
of reservoir sediment models. The construction of such an assessment system has been applied to
mathematical models used within the Yellow River reservoir network. This system promotes the
quantitative assessment of respective models and advances the pursuit of reservoir sediment control.
Thus, this research contributes to the overarching goal for sustainable utilization of the Yellow River
reservoir system.
2. Evaluation system overview
At present, there are no widely-accepted research results that codify multi-objective and quantitative
assessment systems for numerical simulations. To quantitatively assess the mathematical models, a
case library should be established to provide standard cases with which to test model integration
performance[2]. To fulfill this purpose, the key factors representing water-sediment transportation
and its accompanying mechanisms are selected as the single indices. After dimensional scaling and
Ye, M., Hu, H., Xia, R. and Liu, Y.
An Evaluation System for Mathematical Models of Reservoir Sedimentation along the Yellow River.
In Proceedings of the International Workshop on Environmental Management, Science and Engineering (IWEMSE 2018), pages 125-132
ISBN: 978-989-758-344-5
Copyright © 2018 by SCITEPRESS – Science and Technology Publications, Lda. All rights reserved
125
weight assignment, the multi-objective and quantitative assessment system is established.
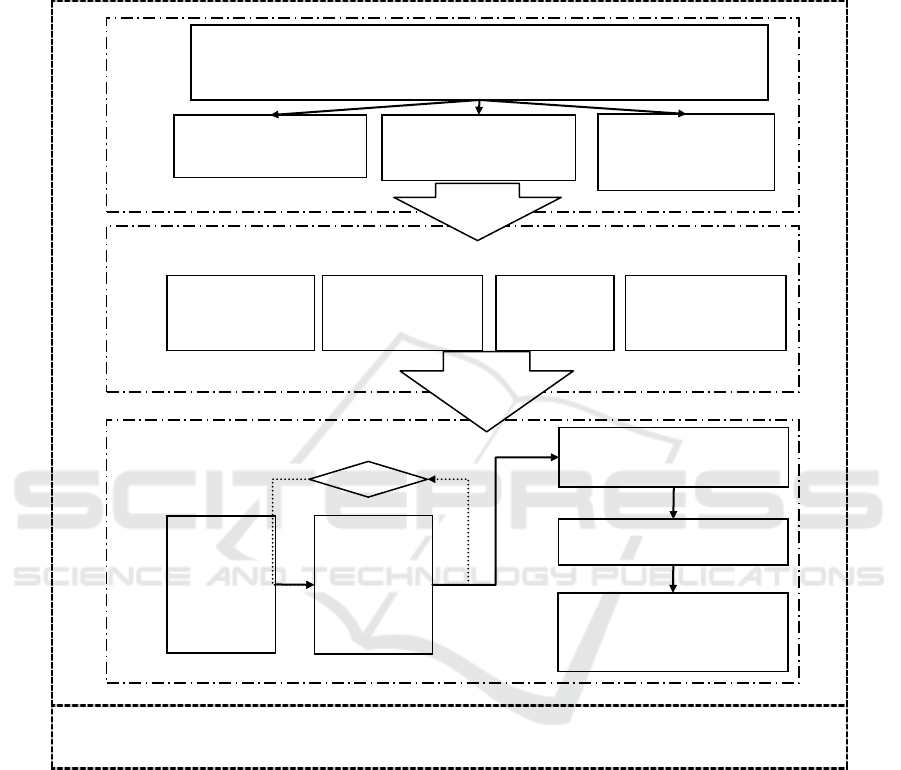
The assessment system for mathematical models used in sediment simulations of Yellow River
reservoirs consisted of three parts: case library construction, indices selection, and quantitative
assessment. The details are shown in Figure.1.
Figure.1 Evaluation system for mathematical model of reservoir sediment in the
Yellow River.
Establishing a case database denotes the compiling and selection of cases which either have
analytical solutions or are representative of laboratory and prototype data. After this procedure comes
index selection. When selecting indices and conducting dimensional analysis, assessment points
should be established according to model characteristics. Indices should be able to properly assess
the accuracy of the model in simulating water-sediment transportation and its accompanying
processes. The final step is selecting the multi-target and quantitative assessment method. Based on
the quantitative criterion of the individual index, an appropriate assessment method is selected to
carry on the weighted coupling processing. Following processing, the assessment system is complete.
In this study, both analytic hierarchy processing and structural equation modelling were used to
optimize the coupling process of the model index. In this way the optimal multi-objective assessment
method for reservoir sediment mathematical models was established.
Quantitative assessment system for numerical simulation of water
and sediment
Case database
Data
analysis
Case
database
establish
ment
Contents
Methods
Implementation
Indices selection
Multi-objective
and quantitative
assessment
Numerical
simulation
Theoretical
analysis
Programming
implementation
Model
selection
and
individual
index
evaluation
Single index quantitation
Multi-target evaluation
&Coupling method
selection
Index weighted
Reliability
IWEMSE 2018 - International Workshop on Environmental Management, Science and Engineering
126

3. Case database construction
Carefully filtered data was collected from established benchmark solutions, experimental results, and
field observations. Cluster and discriminant analysis methods were used to prepare the metadata for
model evaluation. Afterward, cases were categorized by data source, spatial scale, flow
characteristics, sediment, and calculation dimensions. Finally, a standard case database for reservoir
sediment numerical models was established. The database consists of more than 20 different field
tests of reservoirs in the Yellow River basin. In each case, both the boundary conditions and
measured data were copiously recorded. Thus, these cases can be easily applied to the calibration and
validating of 1D and 2D numerical models. The cases are listed in Table 1.
Table1. Cases for model evaluation.
Category
Case name
Description
Real regulation
case (1,2D)
Water and Sediment Regulation Test of the
Lower Yellow River (WSRT of LYR) in 2004
Can be used to calibrate or evaluate model
performance on flood routing, sediment transport,
concentration and the state of deposition and
erosion in natural river.
WSRT of LYR 2005
WSRT of LYR 2006
WSRT of LYR 2007
WSRT of LYR 2008
WSRT of LYR 2009
WSRT of LYR 2010
Flood in August, 1996
(Huayuankou~Jiahetan)
Flood in August, 1996 (Gaocun~Sunkou)
Laboratory
experiment
Gravity current experiment
Test models’ ability of simulating gravity
current
The backward erosion experiment for fine
sediment deposition in a flume
The changing process of bed and surface
in flume caused by backward erosion
Water and Sediment Regulation of
Xiaolangdi Project in 2009
Flood routing,Sediment scouring and deposition
process, gravity current, tributary backward flow
and sedimentation
Water and Sediment Regulation of
Xiaolangdi Project in 2010
Water and Sediment Regulation of
Xiaolangdi Project in 2011
Water and Sediment Regulation of
Xiaolangdi Project in 2012
Field observations at Sanmenxia 1964~1965
Sediment backward erosion and deposition
morphology in reservoirs
Field observations at Sanmenxia 1972~1973
Sediment backward erosion and deposition
morphology in reservoirs
Xiaolangdi Reservoir Operation in
2002~2010
Long-series calculation
Liujiaxia Reservoir Operation in 1996~2010
Sediment transportation and the deposition
morphology changing in mainstreams and
tributaries
An Evaluation System for Mathematical Models of Reservoir Sedimentation along the Yellow River
127

4. Index selection and quantitative evaluation model
Under the proposed evaluation framework for Yellow River reservoir sediment models, the selected
performance indices were: impoundment curve, reservoir sedimentation morphology, sediment
deposition volume, deposition thickness, reservoir sediment concentration, outflow sediment
concentration, gravity-current outflow sediment volume, and maximum gravity-current outflow
sediment concentration. Indexes either with very large compatibility factors or very small impact
factors were removed from consideration to obtain a more reasonable set of indexes. In this
framework, we first needed to obtain the dimensionless form of the individual index. Then, the
dimensionless index value for each set of observed data was determined. These observed index
values were compared with numerical model index values to calculate the relative difference. Finally,
each individual index was given a weighted value to scale its importance in model evaluation.
4.1. Individual index for model evaluation a subsection
The Delphi method is used to analyze the reliability of each index. First, more than 30 experts
individually ranked the primary indexes based on importance. Then, based on these scores, indexes
with very large compatibility factors or very small impact factors were removed. This process
optimized the selection of individual indexes. The selected primary indexes were: reservoir sediment
deposition, sediment flow patterns, backward erosion and tributary pouring. The evaluation system is
illustrated in Table 2.
Table 2. The evaluation index system for sediment mathematical model for reservoirs.
Targets
Primary Index
Secondary Index
The Evaluation System
For Mathematical
Models of Reservoir
Sedimentation.
Reservoir Sediment
Deposition
Impounding Curve
Sediment Deposition Volume
Deposition Thickness
Outflow Sediment Concentration
Sediment Flow Patterns
Gravity-Current Outflow Sediment Volume
Maximum Outflow Sediment Concentration By
Gravity-Current
Process Of Sand Group By Gravity-Current
Backward Erosion
Erosion
Tributary Pouring
Sediment Deposition By Tributary Pouring
4.2. Value of single index and its weight
After primary indexes were selected, the dimensionless index values were calculated based on field
experiments. These were compared with model outputs and ranked based on relative errors. Finally,
the overall weight of the index was calculated to quantify its importance in model evaluation. The
relative-error rankings and weights for each secondary index are shown in Table 3.
IWEMSE 2018 - International Workshop on Environmental Management, Science and Engineering
128

Table 3. Index Rank and Weight Allocation.
Category
Score
weight (1~10)
5
4
3
1
1D
2D
model
Reservoir
sedimentation
impounding curve
≤5%
5%~8%
8%~10%
10%~15%
8.79
8.61
reservoir
sedimentation
volume
Long-term series
(10
8
m
3
)
≤10%
10%~15%
15%~20%
20%~30%
8.72
8.53
grouping
sediment
≤20%
20%~25%
25%~30%
30%~50%
8.55
8.39
Reservoir
deposition
thickness
Flood events
(daily-averaged)
≤10%
10%~15%
15%~20%
20%~30%
7.37
7.22
multi-year
averaged
≤15%
15%~20%
20%~25%
25%~40%
7.18
6.94
Outflow sediment concentration
≤20%
20%~25%
25%~30%
30%~50%
7.63
7.46
Flow pattern
for sediment
transportation
Gravity-curre
nt and outfall
Outflow
sediment
concentration
(kg/m
3
)
≤20
%
20%~25%
25%~30%
30%~50%
6.81
6.65
Maximum
outflow
sediment
concentration
(kg/m
3
)
≤20
%
20%~25%
25%~30%
30%~50%
6.29
6.10
Grouping sand
≤20
%
20%~25%
25%~30%
30%~50%
5.77
5.53
backward
erosion
erosion volume (10
8
m
3
)
≤20
%
20%~25%
25%~30%
30%~50%
6.62
6.83
tributary
pouring
tributary pouring
Sediment deposition (10
8
m
3
)
≤20
%
20%~25%
25%~30%
30%~50%
6.33
6.57
Note:the value of % represents the relative errors between simulated results and real value (measured data); the
weight reflects the importance of index to the models’ evaluation.
An Evaluation System for Mathematical Models of Reservoir Sedimentation along the Yellow River
129

4.3. Multi-target evaluation coupling model
Once the indexes were ranked and weighted, a number of individual indexes were compiled into a
multi-target model. In this study, an analytic hierarchy process (AHP) and structural equation model
(SEM) were applied to compile the indexes[3].
4.3.1. Analytic hierarchy process. The overall objective of the AHP is to utilize the calculated
indexes to perform a comprehensive evaluation. The process is defined as follows: first, the research
objective is divided into several analysis criteria, i.e., reservoir sedimentation, sediment flow
transport, backward erosion and tributary backflow. Next, the importance of each individual criterion
was determined through use of the secondary indexes. Expert rankings were used to determine the
index weights, as mentioned in section 4.2. The corresponding evaluation system R
I
is acquired by
comparing simulation results using simulated results and measured data. Through corresponding
weight matrix, the second-level indexes are weighted statistically processed and A
I
is calculated:
A
I
=B
i
*R
I
(1)
Where R
I
is the expert scores of second-level indexes, B
i
is weight matrix of layer P
i
~ P
ij
. The
value of E can be acquired by coupling B and A. Based on the overall evaluation and the ranking of
different indexes, the evaluation result under different objectives can be acquired.
E=B*A (2)
This process combines statistical and error analysis theory with expert index rankings to create a
weighted index matrix. Once the weighted index matrix is established, the weighted treatment of
qualitative index fuzzy quantification method is used to establish the membership function to
describe the differences and connections of each index, which can better resolve the relevance and
ambiguity of comprehensive evaluation.
4.3.2. Structural equation modelling. Structural equation modelling is a recently developed statistical
modeling method. It is particularly suitable for factors that are more subjective and difficult to
quantify, such as model comprehensive performance, visualization effects, and evaluating
curve-fitting processes. First, the structural equation for the comprehensive model evaluation is
constructed. Applying the structural equation modelling method includes five main steps: model
construction, fitting, evaluation, correction and application. This model combines measurable flow
and sand observation variables with potential variables that are difficult to measure. Thus, a
multi-objective evaluation method for decision-making is constructed. Variables which are difficult
to directly measured are terms “latent variables”. In this assessment, parameters such as reservoir
siltation, sediment transport, backward erosion, and tributary backflow are used as the primary
assessment criteria. Currently, there are no direct methods to measure these criteria. Thus, observable
variables must be utilized to quantify them. In SEM, “observed variables” are variables that can be
quantified using measured data, such as mass of sediment released from the reservoir, deposition
thickness, etc[4].
The SEM evaluation is constructed with the following system of equations:
(3)
Where denotes the impact of the latent and observational variable matrices on the final evaluation.
The matrix elements were weighted and random error was minimized. The definition of equation
parameters and variable names are shown in Table 4.
IWEMSE 2018 - International Workshop on Environmental Management, Science and Engineering
130

Table 4. Structural Equation Modelling Variables.
Potential endogenous variables, refer to model comprehensive performance score
Potentially exogenous variables that characterize some unmeasured first-level indicators
in the model's overall performance evaluation, such as reservoir siltation, sediment
transport status, backward erosion, etc.
y
Observations of variable
, ultimately represent quantitative representations of these
unmeasurable secondary indicators, such as program visualization, result curve fitting,
and so on.
x
The observation value of the variable
, indicate the secondary indicators that can be
directly measured, such as the sedimentation thickness of the reservoir, the sediment
load of the reservoir, the maximum sediment concentration in the gravity flow, etc.
Random error of latent variable equation
Measurement error of y
Measurement error of x
B
Weight coefficient of
Weight coefficient of
y
Regression coefficients of
x
Regression coefficients of
Once model parameters are estimated, it is necessary to evaluate whether the model can be fit to
the data. The statistical evaluation indexes commonly used in the SEM equations include the
goodness-of-fit test
2
, the goodness-of-fit index, and the adjusted goodness-of-fit index.
The test of goodness of fit
2
can be calculated using the following equation:
2
= (n-1)F (4)
Where F is the fitting function and n is the size of the sample. If
2
has less than 2 degrees of
freedom, the goodness-of-fit is satisfactory. If there is not a satisfactory fit between the model and the
data, the model needs to be revised until the model passes the test.
The goodness-of-fit index and the adjusted goodness-of-fit index are formulated as follows:
(5)
(6)
Where F represents the fitting function, df represents the degree of freedom, S is the
variance-covariance matrix of the observed variable, Σ represents the variance-covariance matrix of
the model estimation, p represents the total number of endogenous variables, and q represents the
total number of exogenous variables.
From the GFI formula, it is observed that the value of GFI is <1. In practical applications, it is
generally considered that the model exhibits good fit when the value of GFI is greater than 0.90. The
AGFI index adjusts the GFI by the number of degrees of freedom and the number of parameters
within the model. The value of AGFI ranges between 0 and 1. The more degrees of freedom within
the model, the greater the value of AGFI. Generally, when the AGFI is greater than 0.90, the model
is considered to exhibit good fit with the data.
The sample data obtained in this survey were verified to meet the conditions required for normal
distribution and maximum likelihood estimation as a matter of experience. The maximum likelihood
estimation method produced in the statistical software AMOS 17.0 was used to analyze and test the
An Evaluation System for Mathematical Models of Reservoir Sedimentation along the Yellow River
131

input data. The calculation method of the structural equation model can compare and analyze the
degree of matching between the model and the collected sample data as a whole[5-6]. The SEM can
then determine the mutual influence of variables within the model by analyzing the fitted index
values. The results of the AMOS 17.0 fitted index output is shown in Table 5:
Table 5. Partial Fitting Indexes of Structural Equation Model.
Fitting index
GFI
AGFI
Judgement
standard
>0.9
>0.9
Index of model
0.958
0.987
Table 5 shows that the model GFI and AGFI values are between 1 and 0.9, indicating that the
model exhibits good fit with the data. The results show that this model does not need to be corrected.
5. Conclusions
In this paper, a basin-oriented evaluation system for mathematical models of reservoir sedimentation
is initially developed, and a case database for evaluating reservoir sediment models in the Yellow
River is established. In addition, both Delphi and reliability analysis methods were adopted to
propose an evaluation index of mathematical models of reservoir sedimentation and obtain
non-dimensionalization of individual indexes. An analytic hierarchy process and structural equation
model were used to establish weighted quantifications of evaluation criteria. Thus, the initial steps for
a comprehensive and quantifiable evaluation of Yellow River reservoir sediment models are
established.
Acknowledgement
This research was supported by Key Laboratory of Yellow River Sediment Research (MWR)Open
fund project(Grant No. 201702) and Special Research Fund of China Institute of Water Resources
and Hydropower Research (Grant NO. SE0145B362016) respectively.
References
[1] Yu X, Yang M, Liang G and et al 2011 M. Mathematical Simulation System Construction and
Application of the Yellow River Water and Sediment Zhengzhou: The Yellow River Water
Conservancy Press (in Chinese)
[2] Yu X, Kou H and Wang W 2012 Development of numerical modeling system for river basins
and critical techniques J. Hydro-science and Engineering (1): 5-12 (in Chinese)
[3] Qiu D 1991 M. Systematic Analysis of Multi-index Evaluation Methods Beijing: China
Statistics Press, (in Chinese)
[4] Han Q 2003 M. Reservoir Sedimentation Beijing: Science Press (in Chinese)
[5] Xie J, Wu B and X Liu 2013 Research progress of reservoir sedimentation management J.
Zhihuang Keji Xinxi (5): 1-3 (in Chinese)
[6] Hu C 2012 M. The Optimal Configuration of the Yellow River Sediment Beijing: Science Press
(in Chinese)
IWEMSE 2018 - International Workshop on Environmental Management, Science and Engineering
132
