
Analysis of Spatial Distribution and Temporal Trend of
Potential Evapotranspiration in Hexi Corridor
Y M Wang
1,*
, D F Peng
1
, X Y Guo
2
, H Huo
3
, O Cheng
1
, L L Tong
1
and D S Hu
1
1
Changsha Normal University, No. 9 Teli Road, Changsha, 410100, China;
2
Northwest Institute of Ecology and Environmental Resources, Chinese Academy of
Sciences, No. 320 West Dong Gang Road, Lanzhou, 730000, China;
3
Kunming University, No. 2 Puxin Road, Kunming, 650214, China
Corresponding author and E-mail: Y M Wang, wangyamin@lzb.ac.cn
Abstract. In this paper, the FAO Penman-Monteith (FAO-56 PM)model are evaluated to
estimate daily potential evapotranspiration (PET) values, at 14 meteorological stations during
1960-2011 in the Hexi Corridor in China are calculated. Using GIS spatial analysis
techniques and mathematical statistical theory to analyzed temporal and spatial characteristics
of potential evapotranspiration in Hexi Corridor. Their spatial distributions and temporal
variations are examined and the causes for the variations are discussed. The contributions of
various meteorological variables to the temporal trend detected in the PET is then determined.
The results show that: (i) The annual PET showed a mixed pattern of upward and downward
trend during 1960-2011 in Hexi Corridor. The trends in the seasonal changes were
particularly strong in summer and spring, whereas the increase is in summer. (ii) The
potential evapotranspiration was decreased from northwest to southeast in Hexi Corridor, the
minimum were in the Qilian Mountains. The potential evapotranspiration mainly
concentrated in the spring and summer, account for 30% and 40% in potential
evapotranspiration, respectively, autumn followed and winter was minimum. (iii) The main
factor effect potential evapotranspiration of Hexi Corridor was wind speed, which effect the
spring potential evapotranspiration was temperature.
1. Introduction
Potential evapotranspiration (PET) is a key hydrological variable quantifying a major water loss from
catchments, which can be used to calculate actual evapotranspiration (ETa), schedule irrigation and
prepare input data for hydrological models. The only factors affecting PET are climatic parameters as
water is abundantly available at the reference evapotranspiring surface [1]. According to the IPCC
(Intergovernmental Panel on Climate Change) Fourth Assessment Report (AR4), global mean surface
temperatures have raised by 0.74°C ± 0.18°C over the last 100 years. Besides the obvious increases
in temperature, atmospheric moisture, precipitation and atmospheric circulation also change and their
changes are more uncertain (IPCC, 2007). Potential evapotranspiration is the maximum possible
evaporation rate, which has been widely formulated using meteorological variables such as net
radiation, wind speed, relative humidity and air temperature [2]. In recent years, decreasing trends in
PET have been reported in several regions of the world in contrast of increasing air temperature; this
102
Wang, Y., Peng, D., Guo, X., Huo, H., Cheng, O., Tong, L. and Hu, D.
Analysis of Spatial Distribution and Temporal Trend of Potential Evapotranspiration in Hexi Corridor.
In Proceedings of the International Workshop on Environmental Management, Science and Engineering (IWEMSE 2018), pages 102-110
ISBN: 978-989-758-344-5
Copyright © 2018 by SCITEPRESS – Science and Technology Publications, Lda. All rights reserved

has been called the “evaporation paradox” [3-4]. Researchers describe this phenomenon in several
ways: complementary relationship between the actual evaporation and PET [5-6], reduction in
irradiance due to increase in cloud coverage and aerosol concentrations [3], decreasing levels of wind
speed [7-9], etc. In turn, changes of PET resulting from climate change can greatly influence
hydrological parameters such as soil water content, actual evaporation and runoff [10-11]. Therefore,
exploring the impacts of climate changes on PET will provide insights into novel water management
practices.
Under the background of climate and vegetation changes on the semiarid area, it is necessary to
understand the present changes and project the future changes of PET to provide useful information
for the vegetation construction and water management on the semiarid area. As a semiarid area, Hexi
Corridor which is lying in northwest in China was catching more attention by government in recent
years. In semiarid climates where water resources are limited and seriously endangered by
overexploitation, it is essential to estimate potential evapotranspiration with the greatest possible
precision. This way, good management and planning of available water resources is attained. This
type of study is very useful in the area where it was conducted, but also offers the possibility of
extrapolating results to other geographical areas of similar climatic conditions. It permits irrigation
advisory services and also allows technicians interested in the subject to know what the most precise
equation is for estimating PET values. This knowledge can mean significant water savings, as well as
a more efficient utilization. Potential evapotranspiration (PET) estimations require accurate
measurements of meteorological variables (solar radiation, air temperature, wind speed, and relative
humidity) which are available in China [12-16]. Thus, this study was carried out with the objective of
studying the temporal variation of PET on annual and seasonal basis over the semiarid climate of
northwest of China.
The objectives of this study are: (1) to analyze seasonal cycle and annual variation of PET series
in the Hexi Corridor from 1960–2011; (2) to quantify the trends of PET series of the Corridor and
those at stations, and present spatial structure of the trends at each station; (3) to detect abrupt
changes of PET series by two different methods, and give spatial distribution of abrupt changes at
each station. This study will also shed light on our understanding of climate change and the
accompanying effect on hydrology, as PET being not only a climatic variable but also an important
hydrological process.
2. Material and methods
2.1 Study area
The Hexi Corridor, which is the study area, lies in the north-west of the Gansu Province and to the
west of the Yellow River in China. It is a long corridor between the South Mountains (including
Qilian Mountains and Aerjin Mountains) and the North Mountains (including Mazong Mountains,
Heli Mountains and Longshou Mountains). It starts at Wushaoling Mountains in the east, and ends at
Yumenguan (an important col in ancientry) in the west. It ranges from 92°21′ to 104°45′ E and from
37°15′ to 41°30′N, with a total area of 27.6×10⁴ km
2
. The distance from north to south is 40–100 km
and the distance from east to west is about 1120 km. The Badain Jaran Desert and the Tengger Desert
lie in its northeast (Figure 1) [17]. The Hexi Corridor lies in the transition zone between the monsoon
and westerlies, and is an important location because of its ecological fragility and climatic sensitivity
[18].
Analysis of Spatial Distribution and Temporal Trend of Potential Evapotranspiration in Hexi Corridor
103
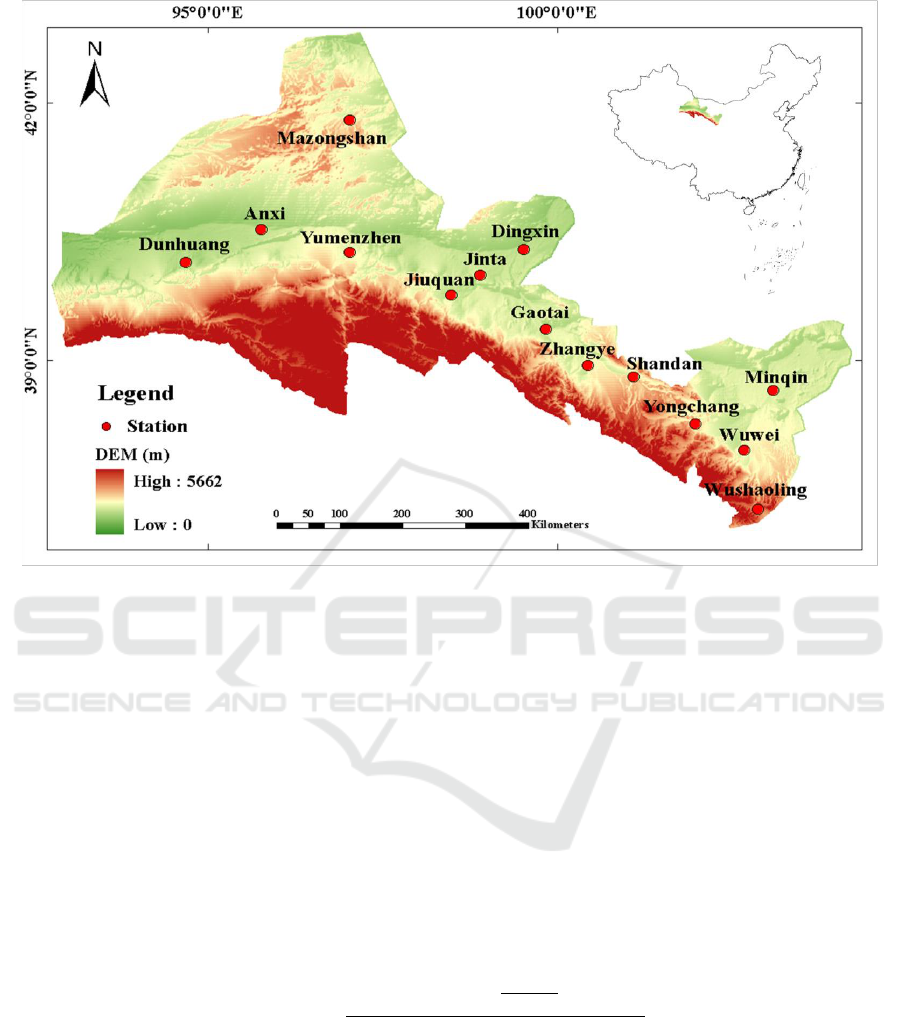
Figure 1.The spatial distribution of meteorological stations in study area.
2.2 Data
Data from 14 National Meteorological Observatory (NMO) stations including daily observations of
maximum, minimum and mean air temperature, wind speed, relative humidity, sunshine hours,
absolute vapour pressure, and precipitation for the period of 1960–2011 were used in this study
(Figure 1). They have been provided by the National Climatic Centre (NCC) of the China
Meteorological Administration (CMA) (http://www.nmic.gov.cn/).
2.3 Methods
The Penman-Monteith equation for calculation of the daily reference evapotranspiration assumes the
potential evapotranspiration (PET) as that from a hypothetical crop with an assumed height of 0.12 m
having a surface resistance of 70 s m
-1
and an albedo of 0.23, closely resembling the evaporation of
an extension surface of green grass of uniform height, actively growing and adequately watered,
which is given by Allen et al.[1]:
2 s a
2
900
0.408 Rn-G + U e -e
T+273
=
+ 1+0.34U
PET
(1)
where PET is the potential evapotranspiration (mm day
-1
), R
n
is the net radiation at the crop
surface (MJ m
-2
day
-1
), G is the soil heat flux density (MJ m
-2
day
-1
), T is the mean daily air
temperature at 2 m height (°C), U
2
is the wind speed at 2 m height (m s
-1
), e
s
is the saturation vapour
pressure (kPa), e
a
is the actual vapour pressure (kPa), e
s
-e
a
is the saturation vapour pressure deficit
(kPa),
is the slope of the vapour pressure curve (kPa °C
-1
) and
is the psychrometric constant
(kPa °C
-1
).
IWEMSE 2018 - International Workshop on Environmental Management, Science and Engineering
104
In order to obtain Rn, the Ångström-Prescott formula was used to calculate the global solar
radiation (R
s
)
[1]:
assS
R
N
n
baR
(2)
Where R
s
is solar or shortwave radiation (MJ m
-2
day
-1
), n is actual duration of sunshine (hour),
N is maximum possible duration of sunshine or daylight hours (hour), n/N is relative sunshine
duration (-), R
a
is extraterrestrial radiation (MJ m
-2
day
-1
), a
s
is
regression constant, expressing the
fraction of extraterrestrial radiation reaching the earth on overcast days (n = 0), a
s
+ b
s
is fraction of
extraterrestrial radiation reaching the earth on clear days (n = N). According to OU et al. [19], a and
b were set at 0.205 and 0.433 in the Hexi Corridor, respectively. The computation of all data required
for calculating ETo followed the method and procedure given in Chapter 3 of FAO-56[1]. Annual
PET was calculated by determining the total of the monthly data series of PET at individual stations.
3. Results and discussion
3.1 Trend analysis on temporal basis
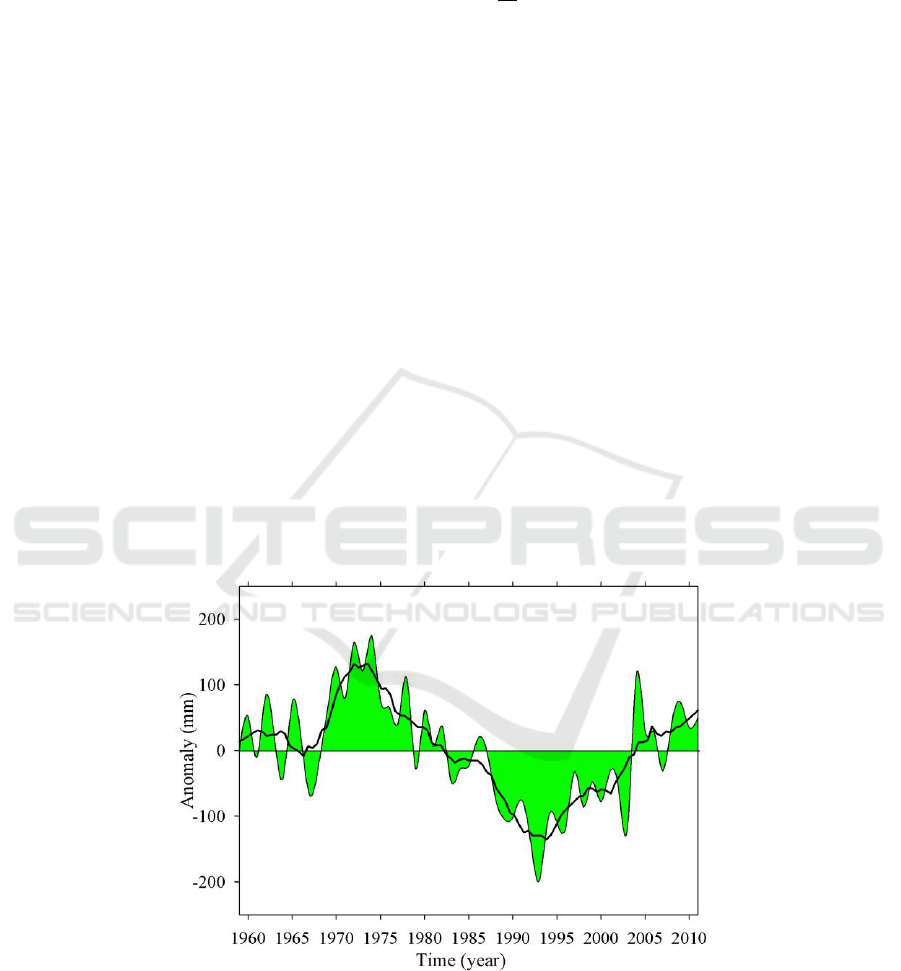
The annual mean potential evapotranspiration (PET) in Hexi Corridor displayed a statistically
significant decrease of 1.83 mm/a from 1960 to 2011. However, the annual PET showed a mixed
pattern of upward and downward trend. The PET time series was divided into three periods:
1960-1974, 1975-1993 and 1994-2011(Figure 2). It was observed that the PET exhibited an
increasing trend of 9.76 mm/a during 1960-1974. There was an acceleration of decreasing trend in
1975-1993 (12.48 mm/a, significant at the 0.05 level), but the 1994-2011 trend was a significant
increase (10.52 mm/a, significant at the 0.05 level). This is coherent with the similar slow down of
the decreasing trends of pan evaporation in China [13-16].
Figure 2.The change tendency curve of PET.
The temporal changes of seasonal PET are the same change as the annual PET, except for winter
with the non-significant trend, whereas the trends were higher in other seasons (Figure 3). The results
showed that: (i) During 1960-1974, positive values for PET were recorded in spring, summer and
autumn with a trend of 2.48 mm/a, 3.73 mm/a and 3.40 mm/a, respectively. (ii) During 1975-1993,
Analysis of Spatial Distribution and Temporal Trend of Potential Evapotranspiration in Hexi Corridor
105
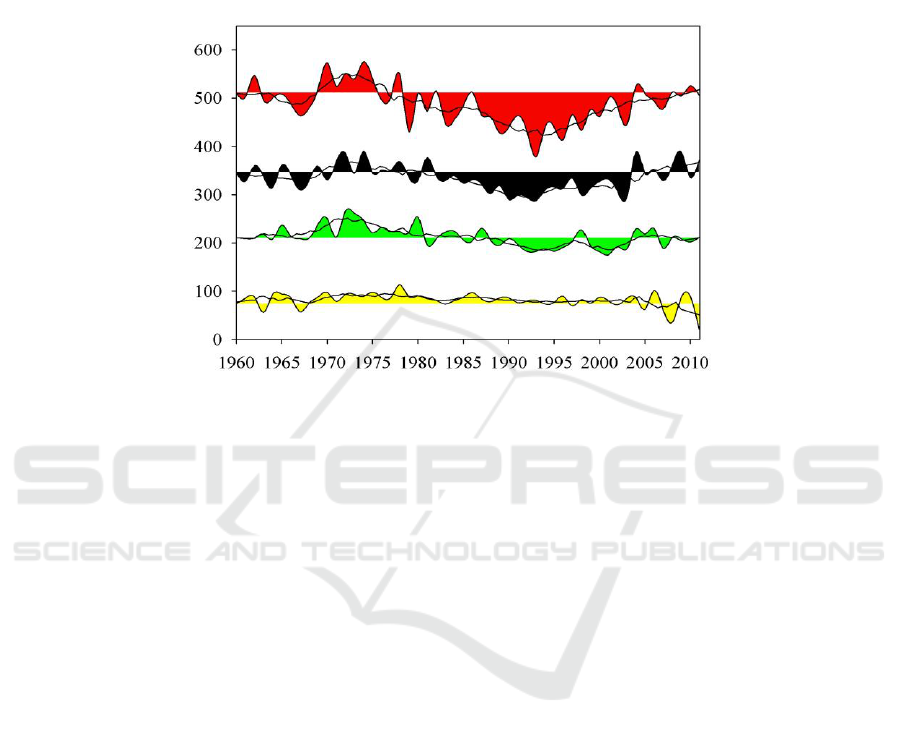
negative values for PET were recorded in spring, summer and autumn with a trend of -3.84 mm/a,
-5.46 mm/a and -2.23 mm/a, respectively. (iii) During 1993-2011, positive values for PET were
recorded in spring, summer and autumn with a trend of 3.50 mm/a, 5.704 mm/a and 1.29 mm/a,
respectively. (iv) The trends in the seasonal changes (mm/a) during 1960-2011 were -0.27 (spring),
-0.91 (summer), -0.60 (autumn) and -0.32 (winter). The weakening of decreasing was particularly
strong in summer and spring, whereas the increase is in summer.
Figure 3.Temporal variation of PET in different season.
3.2 Spatial distribution of seasonal and annual PET
These spatial distribution maps provide valuable information in water resources planning and
management in the Hexi Corridor, since spatial distribution of annual and seasonal values of PET is
an important driving force in the hydrological cycle. Combining the spatial distribution maps of PET
with the spatial distribution of meteorological variables will provide an important background and
physical interpolation for climate change studies in the region.
Using GIS spatial analysis techniques and mathematical statistical theory to analyzed temporal
and spatial characteristics of potential evaporation in Hexi Corridor. The spatial distributions of
annual PET during 1960-2011 are plotted in Figure 4. It shows large spatial variability at places. The
maximum and minimum were 1632.87 mm at Yumenzhen in the northwest of region and 655.58 mm
at Wushaoling in the southeast of region, respectively. PET is the largest (on average >1000 mm) to
the north of region, the area that is primarily covered by Gobi desert. On the boundary of the
southeast Qilian mountain region PET is smaller than the Gobi desert. This may imply a topographic
effect. The annual distribution has a rich spatial structure with a relatively low area in the central part
of the catchment and high areas in south- west and southeast.
It can also be seen that the seasonal and annual variations of the PET in different regions (see
Figure 5). The stations that is located in northwest of Hexi Corridor displayed a decreasing trend of
annual mean PET during 1960-2011, and the maxima trends were observed at Anxi station with an
average slope of 7.03 mm/a. The stations that is locate in mountains displayed a increasing trend, and
the maxima trends were observed at Jinta station with an average slope of 17.90 mm/a. The other
stations with non-significant trends were mainly at lower altitudes. Increasing trends were observed
at Jinta and Mazongshan in spring. Jiuquan displayed an increasing trend in summer. However,
decreasing trends were observed at Anxi and Yumenzhen in spring, summer and autumn. No
statistically significant trend in seasonal PET was observed at eight stations (Dunhuang, Dingxin,
Gaotai, Zhangye, Shandan, Yongchang, Wuwei, Minqin). The PET mainly concentrated in the spring
and summer, account for30% and 40% in potential evapotranspiration, respectively, autumn followed
IWEMSE 2018 - International Workshop on Environmental Management, Science and Engineering
106
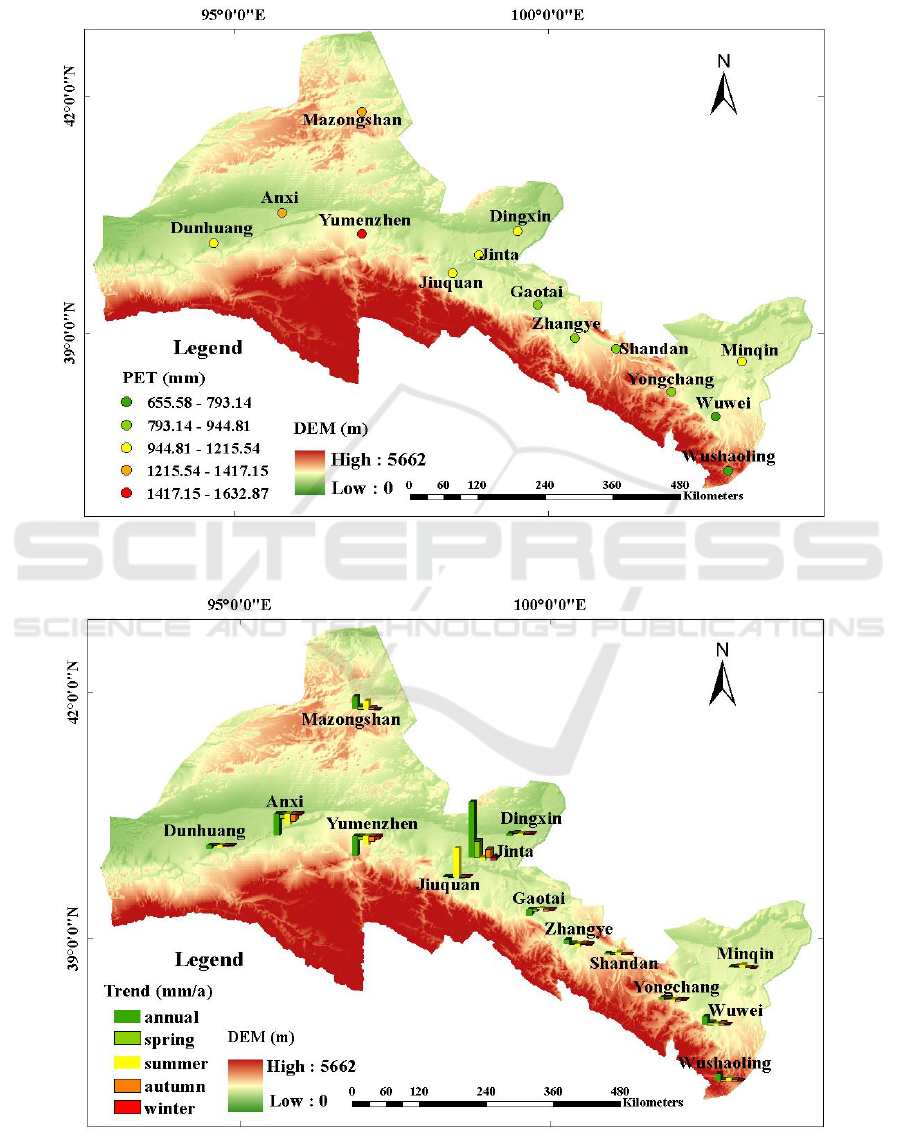
and winter was minimum. Stations with the highest significant trends were on the Gobi desert,
whereas stations with non-significant trends were in the southeast of Hexi Corridor.
Figure 4. Spatial distribution of the PET.
Figure 5.Spatial distribution of the PET trends.
Analysis of Spatial Distribution and Temporal Trend of Potential Evapotranspiration in Hexi Corridor
107

3.3 Attribution analysis of PET
The data obtained from attribution analysis of PET are shown in Table 1. Attribution analyses reveal
the contribution of different factors to the trends of PET observed over time. The attribution of
meteorological variables to PET can be obtained from partial derivatives and the annual average
trend of each variable [12]. The results are summarized below: (i) The annual average value of the
attribution coefficients for relative humidity (RH), wind speed (W) and precipitation (P) were -0.46,
0.58 and -0.33, respectively. This indicated that the PET is most contribution to relative humidity,
followed by wind speed and precipitation. (ii) Air temperature (T), precipitation (P) and wind speed
(W) are more contribution of the spring PET. The attribution coefficient was 0.61, -0.47 and 0.48,
respectively. The spring PET is most contribution to air temperature. (iii) The less sensitive to
summer PET was air temperature (T), while the most contribution to summer PET were sun hours
(S), net radiation (N) and wind speed (W). (iv) The attribution coefficients for autumn PET were sun
hours (S), air temperature (T), precipitation (P) and wind speed (W), with the most attribution
coefficient was sun hours. (v) The winter PET was only contribution to precipitation (P), the
attribution coefficient was -0.47.
Table 1. Attribution coefficients between meteorological variables and the PET of annual and season.
RH
S
T
R
P
W
annual
Spring
Summer
Autumn
Winter
-0.46
**
-0.21
-0.14
-0.27
-0.15
0.24
0.26
0.46
**
0.54
**
0.04
0.15
0.61
**
0.35
*
0.41
**
0.25
-0.07
0.23
0.61
**
0.21
-0.09
-0.33
*
-0.47
**
-0.05
-0.43
**
-0.47
**
0.58
**
0.48
**
-0.57
**
0.31
*
0.12
**
Denote statistically significant at the 1% level of significance;
*
Denote statistically significant at the 5% level of significance.
4. Conclusions
This study addressed the changes of PET in Hexi Corridor during 1960-2011 and the attribution of
different meteorological variables to the changes of PET. The present and future spatiotemporal
characteristics of potential evapotranspiration (PET) are examined in this paper to understand the
present and future changes in hydrology. After generating present PET by the Penman–Monteith
method with historical weather data and future PET through Hurst parameter, the spatial distribution
and temporal trend in PET is interpreted by Inverse Distance Weighted Interpolation. Some of the
key findings are:
The annual PET showed a mixed pattern of upward and downward trend during 1960-2011 in
Hexi Corridor. The trends in the seasonal changes during 1960-2011 were particularly strong in
summer and spring, whereas the increase is in summer. The PET mainly concentrated in the spring
and summer, account for30% and 40% in potential evapotranspiration, respectively, autumn followed
and winter was minimum.
The spatial distributions of annual PET is the largest (on average >1000 mm) to the north of
region, the area that is primarily covered by Gobi desert. On the boundary of the southeast Qilian
mountain region PET is smaller than the Gobi desert. This may imply a topographic effect. Stations
with the highest significant trends were on the Gobi desert, whereas stations with non-significant
trends were in the southeast of Hexi Corridor.
The results obtained show that changes of PET were determined by a combined contribution of
the different variables including net radiation, sun hours, wind speed, relative humidity, precipitation
IWEMSE 2018 - International Workshop on Environmental Management, Science and Engineering
108

and air temperature. The annual PET is most sensitive to relative humidity, followed by wind speed
and precipitation.
Acknowledgments
This study was supported by the National Natural Science Foundation of China (No. 41601029),
Natural Science Foundation of Hunan Province, China (No. 2016JJ6003), Natural Science
Foundation of Changsha Normal University, China (No. XXZD201501), the Think Tank Research
Project of Hunan Federation of Social Sciences, China (No.1622). We greatly appreciate suggestions
from anonymous referees for the improvement of our paper. Thanks also to the editorial staff.
References
[1] Allen R G, Pereira L S, Raes D and Smith M 1998 Crop evapotranspiration–Guidelines for
computing crop water requirements Irrigation and Drainage Paper 56 FAO Rome
[2] Shuttleworth W J 1993 Evaporation. In: D.R. Maidment (Editor) Handbook of Hydrology.
McGraw-Hill Sydney
[3] Roderick M L and Farquhar G D 2002 The cause of decreased pan evaporation over the past
50 years Science 298:1410-1
[4] Donald H B and Nicole M H Trends in evaporation for the Canadian Prairies Journal of
Hydrology 2007,336, 61~73. doi:10.1016/j.jhydrol.2006.12.011
[5] Hobbins M T, Ramírez J A and Brown T C 2004 Trends in pan evaporation and actual
evapotranspiration across the conterminous U.S: Paradoxical or complementary Geophys
Res Lett 31: L13503, doi:10.1029/2004GL019846
[6] Ramírez J A, Hobbins M T and Brown T C 2005 Observational evidence of the
complementary relationship in regional evaporation lends strong support for Bouchet's
hypothesis Geophys Res Lett 32: L15401, doi:15410.11029/12005GL023549
[7] Rayner D P 2007 Wind run changes: the dominant factor affecting pan evaporation trends in
Australia J Climate 20:3379-94. doi: 10.1175/JCLI4181.1
[8] Roderick M L, Hobbins M T and Farquhar G D 2009 a. Pan evaporation trends and the
terrestrial water balance. I. Principles and observations Geography Compass 3:746–60. doi:
10.1111/j.1749-8198.2008.00213.x
[9] Roderick M L, Hobbins M T and Farquhar G D 2009 b. Pan evaporation trends and the
terrestrial water balance. II. Energy balance and interpretation Geography Compass
3:761-80. doi: 10.1111/j.1749-8198.2008.00214.x
[10] Donohue R J, Roderick M L and McVicar T R 2007 On the importance of including vegetation
dynamics in Budyko’s hydrological model. Hydrol Earch Syst SCI 11:983–95.
doi:10.5194/hess-11-983-2007
[11] Donohue R J, McVicar T R and Roderick M L 2010 Assessing the ability of potential
evaporation formulations to capture the dynamics in evaporative demand within a changing
climate Journal of Hydrology 386: 186-197. Doi:10.1016/j.jhydrol.2010.03.020
[12] Xu C Y, Gong LB, Jiang T and Chen D L 2006 Analysis of spatial distribution and temporal
trend of reference evapotranspiration and pan evaporation in Changjiang (Yangtze River)
catchment Journal of Hydrology 327 81– 93. doi:10.1016/j.jhydrol.2005.11.029
[13] Jia W X., He Y Q, Wang X F and etal 2009 Temporal and spatial change of the potential
evaporation over Qilian mountains and Hexi corridor from1960 to 2006 J. Progress in
natural science 20(2): 259-167 (In Chinese)
[14] Liu M, Shen Y J, Zeng Y and etal 2009 Changing trend of pan evaporation and its cause over
the past 50 years in China J. Acta geographica sinica 64(3):259~269 (In Chinese)
[15] Liang L Q, Li L J and Liu Q 2009 Temporal variation of reference evapotranspiration during
1961–2005 in the Taoer River basin of Northeast China Agricultural and Forest
Analysis of Spatial Distribution and Temporal Trend of Potential Evapotranspiration in Hexi Corridor
109

Meteorology 150(2): 298–306. doi:10.1016/j.agrformet 2009.11.014
[16] Li Z, Zheng F L and Liu W Z 2012 Spatiotemporal characteristics of reference
evapotranspiration during 1961–2009 and its projected changes during 2011–2099 on the
Loess Plateau of China Agricultural and Forest Meteorology 154–155: 147–155.
doi:10.1016/j.agrformet.2011.10.019
[17] Bao C and Fang C L 2007 Water resources constraint force on urbanization in water deficient
regions: A case study of the Hexi Corridor, arid area of NW China Ecological Economics
62, 508-517. doi:10.1016/j.ecolecon.2006.07.013
[18] Wang N A, Zhao Q, Li J J, Hu G and Cheng HY 2003 The sand wedges of the last ice age in
the Hexi Corridor China: paleoclimatic interpretation. Geomorphology 51: 313–320.
doi:10.1016/S0169-555X(02)00243-X.
[19] Ou H Y,Tong H L and Li X H 1989 Study of evaporation in arid and semi-arid area in
China.Collection of arid meteorological 42~52. (In Chinese)
IWEMSE 2018 - International Workshop on Environmental Management, Science and Engineering
110
