
Spatio-temporal Patterns of Total Nitrogen Pollution Source
Composition in the Ru River Basin
C Y Z Yu
1, 2
, L Tan
1, 2
, R M He
1
, Z Y Zhao
2
and X Y Yang
1, 2,*
1
State Key Laboratory of Hydrology-Water Resources and Hydraulic Engineering,
Nanjing Hydraulic Research Institute, Nanjing 210029, China
2
Department of Environmental Science & Engineering, Fudan University, Shanghai
200433, China
Corresponding author and e-mail: X Y Yang, xiaoying@fudan.edu.cn
Abstract. Water pollution in China is usually caused by multiple pollution sources.
Understanding the contribution of each pollution source and its spatio-temporal patterns is
crucial to the development of effective watershed pollution control programs. In this study,
Soil and Water Assessment Tool (SWAT) was used to simulate the processes of nitrogen
discharge, migration, and transformation in the Ru River Basin. The SWAT simulation results
were used to estimate total nitrogen (TN) load contributions from different pollution sources
in each sub-basin. Clustering analysis results showed that TN loads were mainly from sewage
treatment plants and industries in the north and some areas in the middle, septic tanks and
crop production in the south and some regions in the middle, and crop production in the east
and west. The distinct spatial disparity in TN pollution source composition underlined the
necessity of formulating region-specific watershed pollution control measures.
1. Introduction
Nitrogen (N) is one of the most important biogenic elements that affects primary productivity and
species diversity in both aquatic and terrestrial ecosystems [1-2]. Nevertheless, excessive inputs of N
can cause the degradation of surface water quality [3]. Discharge of N contaminants into water
bodies driven by anthropogenic activities is a main issue at the river basin scale [4-5].
Located in the Upper Huai River Basin, Ru River is one of the most seriously polluted rivers in
China. Excessive N inputs have caused water quality deterioration in the Ru River. The N pollution
source composition of the Ru River Basin is complex with a mix of point and non-point sources.
Meanwhile, the climate of the region is highly seasonal. Disparity in seasonal rainfall may lead to
seasonal differences in water pollutant transport and transformation processes. Therefore,
understanding of the contribution of each pollution source and its spatio-temporal patterns is crucial
to the development of effective watershed pollution control programs in the region.
The Soil and Water Assessment Tool (SWAT) is a physically-based model that has been widely
used to simulate the hydrological and water quality processes of complex large basins [6-10].
However, past SWAT applications have mostly focused on simulating the discharge and transport of
pollutants from agricultural pollution [11-13]. Unlike previous studies, this study used SWAT to
simulate the discharge of N and its subsequent migration and transformation from all known
94
Yu, C., Tan, L., He, R., Zhao, Z. and Yang, X.
Spatio-temporal Patterns of Total Nitrogen Pollution Source Composition in the Ru River Basin.
In Proceedings of the International Workshop on Environmental Management, Science and Engineering (IWEMSE 2018), pages 94-101
ISBN: 978-989-758-344-5
Copyright © 2018 by SCITEPRESS – Science and Technology Publications, Lda. All rights reserved
anthropogenic sources including industries, municipal sewage treatment plants, concentrated animal
feedlot operations, crop production, scattered small-scale animal feedlot operations, and rural
households in the Ru River Basin. Through scenario analysis, SWAT simulation results were used to
estimate total nitrogen (TN) load contributions from each pollution source. K-means clustering
analysis was further conducted to study the spatio-temporal patterns of TN pollution source
composition in the four seasons. This study aims to provide a framework to understand the patterns
of regional pollution load attributions and inform the development of effective local watershed
pollution control programs.
2. Materials and methods
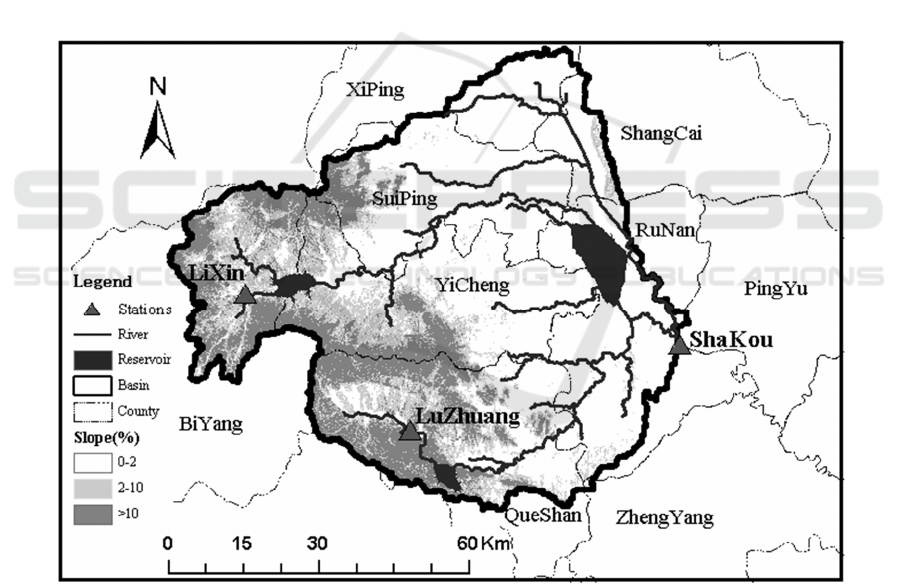
2.1. Study region
Ru River is one main tributary to the upper reaches of the Huai River. The study region is the
upstream contribution area (113°18'-114°28' E and 32°33'-33°26' N) of the Shakou hydrological
station with an area of 5803 km
2
(Figure1). The entire region is completely located in Zhumadian
City, Henan Province [14]. Located in the southern part of the warm temperate zone, the study region
is characterized by both subtropical and warm temperate climate. Its annual average temperature is
15 °C, and its annual rainfall is about 920 mm mainly concentrated in May to September.
Figure 1. The map of the study region.
2.2. SWAT model
Inputs to SWAT include DEM, land use, soil type, river network, weather, pollution data, and
agricultural management practices. Using a threshold area of 8000 ha, a total of 55 sub-basins and
394 hydrological response units (HRUs) were defined in the study region. Model calibration and
validation were performed using the Sequential Uncertainty Fitting Version-2 (SUFI-2) routine built
in Soil and Water Assessment Tool Calibration and Uncertainty Procedure (SWAT-CUP) [15].
Spatio-temporal Patterns of Total Nitrogen Pollution Source Composition in the Ru River Basin
95

After the warming-up period from 2001 to 2004, the SWAT model was calibrated from 2005 to
2007 and validated from 2008 to 2011 based on the daily streamflow records at the Lixin, Luzhuang,
and Shakou stations. In addition, the SWAT model was calibrated between 2006 and 2011 based on
monthly TN loads at the Shakou station. The SWAT model driven by hourly precipitation was able
to satisfactorily simulate the monthly streamflow and TN loads in the Ru River Basin with both
Nash–Sutcliffe efficiency (NSE) and coefficient of determination (R
2
) above 0.8 [16]. Detailed
descriptions of the SWAT models for the simulation of hydrological processes and N pollution
processes in the Ru River basin could be found in Yang et al. (2016a) [14] and Yang et al. (2016b)
[17].
2.3. Pollution source composition estimation
TN pollution source composition of each of the 55 sub-basins was estimated through scenario
analysis. As the baseline scenario, SWAT was first run without any pollution source except fertilizer
applications to estimate the TN load from crop production. For the other five pollution sources,
different scenario runs were then carried out to estimate the combined TN loads from crop
production and each individual source, whose difference from the baseline scenario was calculated as
the load from individual source. The percentage of TN load contribution by each pollution source
was then calculated.
2.4. Clustering analysis
Clustering analysis is the process of grouping a collection of objects into multiple classes of similar
objects. Clustering analysis has been previously widely used to characterize the spatio-temporal
patterns of water quality conditions based on the field pollutant concentration monitoring results [18-
20]. The k-means clustering algorithm divides a set of n samples into k disjoint clusters with samples
more similar within each cluster. It first arbitrarily selects k objects from n samples as the initial
cluster centres. Using distance for measuring similarity, it then assigns every remaining sample to its
most similar cluster centre. New cluster centres are calculated as the average of all samples in the
clusters. The above algorithm repeats until the cluster centres don’t change significantly.
In this study, we used the squared Euclidean distance as the measure of similarity and set the k
value to be 4. With proportions of TN loads from six major pollution sources at the outlet of each
sub-basin as the variables and the 55 sub-basins as the samples, the k-means clustering analysis was
performed for all four seasons to identify the spatio-temporal patterns in the distribution of TN
pollution source composition.
3. Results and discussion
3.1. Source apportionment of TN load
Average annual TN loads and seasonal TN loads from 2006 to 2011 at the outlet of the Ru River
basin were calculated and compared in Table 1. Annual TN loads were mainly contributed by non-
point pollution sources, with the largest contributor - crop production accounting for 46.20%. On the
other hand, point sources only contributed 34.83% of total TN load in the study region.
Seasonally, TN load was the highest in summer, followed by autumn, winter, and spring.
Contributions by septic tanks, industries, concentrated feedlots and sewage treatment plants all
reached a maximum in summer and dropped to a minimum in winter. Unlike the others, contributions
from crop production in summer and autumn were much larger than those in spring and winter.
3.2. Clustering analysis of TN pollution source composition
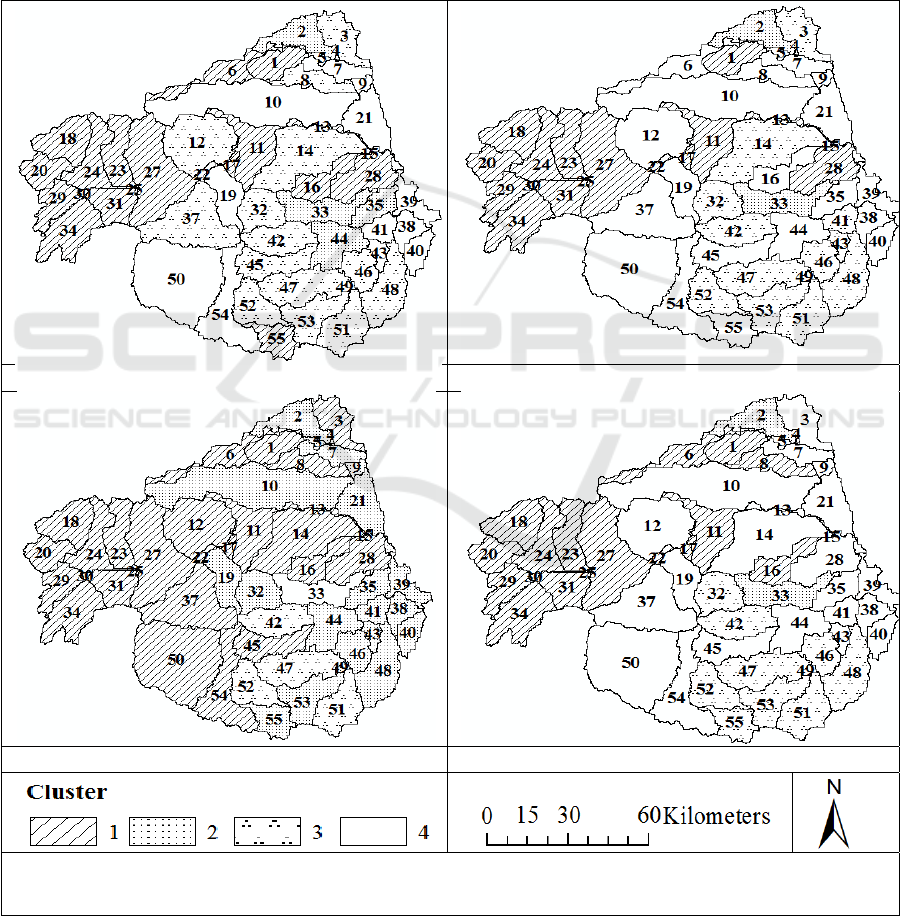
Table 2 compared the four identified seasonal clusters of TN source composition, while Figure 2
showed their spatial distributions. In spring, cluster 1 included 11 sub-basins in the west, 4 sub-basins
in the middle, sub-basin 1 and 6 in the north, sub-basin 15, 16 and 28 in the east, and sub-basin 55 in
IWEMSE 2018 - International Workshop on Environmental Management, Science and Engineering
96

the south. Since there are generally large areas of farmland in these sub-basins, TN loads are mainly
from non-point sources dominated first by crop production and then by septic tanks. Cluster 2
included sub-basin 33, 35, 44 in the middle and sub-basin 2 in the north. Due to industrial activities
and the presence of sewage treatment plants in these regions, TN loads mainly originated from point
sources dominated by industries. Cluster 3 included 13 sub-basins in the north and in the middle as
well as sub-basin 3 and 8 in the north. Similar to the cluster 1 regions, TN loads in cluster 3 regions
were mostly from non-point sources. However, septic tanks acted as the primary non-point pollution
source. Cluster 4 consisted of sub-basin 50 and 54 in the southwest, sub-basin 19 in the middle, 6
sub-basins in the east, and 6 sub-basins in the north-east. In these regions, TN load contributions
from crop production, septic tanks, and concentrated feedlots all fell in the range between 20% and
30%, much more than those from the other three sources.
Table 1. Average annual TN loads and seasonal TN loads in Ru River Basin.
TN sources
Spring Summer Autumn Winter Whole year
TN load
(ton)
Ratio
(%)
TN load
(ton)
Ratio
(%)
TN load
(ton)
Ratio
(%)
TN load
(ton)
Ratio
(%)
TN load
(ton)
Ratio
(%)
Crop production 275.27 31.31
812.48
43.90
893.68
58.23
404.42
44.97
2385.85
46.20
Septic tanks 195.45 22.23 388.86 21.01 218.55 14.24 159.90 17.78 962.77 18.64
Scattered feedlots
1.64
0.19
7.50
0.41
5.31
0.35
2.53
0.28
16.99
0.33
Industries 103.54 11.77 168.00 9.08 104.88 6.83 83.39 9.27 459.81 8.91
Concentrated
feedlots
149.56
17.01
216.13
11.68
154.70
10.08
130.71
14.53
651.09
12.61
Sewage treatmen
t
plants
153.83 17.49 257.68 13.92 157.52 10.27 118.47 13.17 687.51 13.31
Total 879.29 100 1850.65 100 1534.64 100 899.42 100 5164.02 100
Table 2. Cluster centres of TN pollution source composition in the four seasons.
Cluster centres Crop
production
Septic
tanks
Scattered feedlots Industries
Concentrated
feedlots
Sewage treatment
plants
Spring
1
59.95% 33.25% 0.66% 0.21% 4.72% 1.20%
2
17.41% 21.29% 0.13% 18.37% 9.89% 32.91%
3 20.15% 72.48% 0.26% 0.14% 6.97% 0.00%
4
25.44% 29.28% 0.23% 8.34% 26.21% 10.50%
Summer
1
91.66% 5.62% 0.66% 0.08% 1.41% 0.56%
2 21.51% 17.11% 0.28% 22.64% 5.48% 32.98%
3
37.17% 52.50% 1.36% 0.11% 7.76% 1.10%
4
49.73% 25.45% 1.01% 4.92% 12.09% 6.80%
Autumn
1 84.91% 11.15% 0.78% 0.09% 2.64% 0.43%
2
20.97% 6.10% 0.24% 32.67% 1.04% 38.98%
3
43.02% 56.64% 0.34% 0.00% 0.00% 0.00%
4 56.52% 20.43% 0.44% 4.74% 10.24% 7.62%
Winter
1
83.04% 14.25% 0.96% 0.11% 1.63% 0.00%
2
18.46% 9.67% 0.18% 27.92% 5.14% 38.64%
3 32.40% 60.17% 0.23% 0.09% 7.12% 0.00%
4
47.85% 25.74% 0.42% 5.13% 12.28% 8.59%
Spatio-temporal Patterns of Total Nitrogen Pollution Source Composition in the Ru River Basin
97
In summer, Cluster 1 included 11 sub-basins in the west, 4 sub-basins in the middle, sub-basin 1
in the north and sub-basin 15 and 28 in the east. TN loads in cluster 1 regions were mostly
contributed by crop production whose contributions increased significantly from spring to summer.
Cluster 2 included sub-basin 33 in the middle and sub-basin 2 in the north. In these regions, TN loads
were mainly from point sources dominated first by sewage treatment plants and then by industries.
Cluster 3 included 9 sub-basins in the south-east, sub-basin 14, 32 and 42 in the middle, and sub-
basin 3 in the north. TN loads in these regions were primarily from non-point sources with septic
tanks being the largest contributor. Cluster 4 included sub-basin 50, 54 and 55 in the south-west, 6
sub-basins in the middle, 5 sub-basins in the east, and 8 sub-basins in the north. In these regions, TN
loads mainly originated from non-point sources with crop production contributing nearly half of TN
loads.
(a) (
b
)
(c) (d)
Figure 2. Spatial distribution of four TN pollution source composition clusters in the Ru River
Basin in four seasons: (a) Spring; (b) Summer; (c) Autumn; (d) Winter.
IWEMSE 2018 - International Workshop on Environmental Management, Science and Engineering
98

In autumn, Cluster 1 included 11 sub-basins in the west, 11 sub-basins in the middle, 4 sub-basins
in the north and sub-basin 54 and 55 in the south-west. In these regions, crop production was the
predominant contributor to TN loads. Cluster 2 only contained sub-basin 33 in the middle. Cluster 3
included sub-basin 42 in the middle and sub-basin 47, 51 and 52 in the south. The majority of TN
loads in these regions resulted from non-point sources. Among them, septic tanks and crop
production were the major contributors, while point sources contributed little. Cluster 4 included 7
sub-basins in the north, 11 sub-basins in the east, sub-basin 19 and 32 in the middle and sub-basin 53
and 55 in the south. In these regions, the primary TN source was crop production, followed by septic
tanks.
In winter, Cluster 1 included 11 sub-basins in the west, sub-basin 1, 6 and 8 in the north and sub-
basin 11, 16 and 17 in the middle. In these regions, TN loads contributed by crop production were
much higher than other pollution sources. Cluster 2 included sub-basin 2 in the north and sub-basin
33 in the middle. In these regions, sewage treatment plants were the largest contributor to TN loads,
followed by industries. Cluster 3 included 8 sub-basins in the south and sub-basin 32 and 42 in the
middle. TN loads in these regions were mainly from non-point sources dominated first by septic
tanks and then by crop production. Cluster 4 included sub-basin 50 and 54 in the south-west, 7 sub-
basins in the middle, 9 sub-basins in the east and 7 sub-basins in the north. In these regions, TN loads
primarily originated from non-point sources dominated by crop production.
In summary, TN load in the west was mainly contributed by crop production throughout the year
while point sources only contributed a small amount of TN loads. At sub-basin 33 in the middle, TN
loads were mainly from point sources dominated first by sewage treatment plants and then by
industries. In the south as well as the sub-basin 42 in the middle, the largest contributors of TN loads
were non-point sources dominated first by septic tanks and then crop production. Similar to the
western part, the main TN sources in the east as well as some sub-basins in the north and south were
non-point sources with crop production being the largest contributor. Nevertheless, proportions of
TN load contributions by crop production in these regions were fewer than those sub-basins in the
west. In addition, the patterns of TN pollution source composition in some sub-basins changed with
seasons. For instance, TN loads in sub-basin 35 and 44 in the middle were mainly from point sources
in spring but non-point sources in the other three seasons. At sub-basin 14 in the middle, septic tanks
contributed most TN loads in spring and summer while crop production contributed the most in
autumn and winter.
4. Conclusions
A well-performed SWAT model was used to estimate TN pollution source composition in the Ru
River basin. K-means clustering analysis was then performed to characterize the spatial patterns of
the pollution source composition of TN loads in the four seasons. Non-point sources remained the
main sources of TN loads in the study region throughout the year, accounting for 65.17% of the total.
Clustering analysis on the TN pollution source composition at the 55 sub-basins showed that TN
loads in the west were primarily contributed by crop production all year around with small
contributions from point sources. TN loads in the north and some areas in the middle were mainly
from point sources. In the south and some regions in the middle, the majority of TN loads originated
from non-point sources with the largest contribution from septic tanks followed by crop production.
In the east and some regions in the south and north, TN loads were mainly from non-point sources
with crop production the primary contributor.
The revealed distinct spatial disparity in the TN pollution source composition underlined the
necessity of formulating region-specific water pollution control programs that target the main
pollution sources within the region to achieve the best pollution control effects. In the future, the
effectiveness of different pollution control measures under various configurations could be evaluated
with SWAT to help optimize the watershed pollution control program.
Spatio-temporal Patterns of Total Nitrogen Pollution Source Composition in the Ru River Basin
99

Acknowledgments
This work was supported by Open Foundation of State Key Laboratory of Hydrology-Water
Resources and Hydraulic Engineering (2016490411).
References
[1] Vitousek P M, Cassman K, Cleveland C, Crews T, Field C B, Grimm N B, Howarth R W,
Marino R, Martinelli L, Rastetter E B and Sprent J I 2002 Towards an ecological
understanding of biological nitrogen fixation Biogeochemistry 57-58 1-45
[2] Conley D J and Likens G E 2009 Controlling eutrophication: Nitrogen and phosphorus Sci.
323 1014-1015
[3] Sun C, Shen Z, Liu R, Xiong M, Ma F, Zhang O, Li Y and Chen L 2013 Historical trend of
nitrogen and phosphorus loads from the upper yangtze river basin and their responses to the
three gorges dam Environ. Sci. Pollut. R. 20 8871-8880
[4] Galloway J N, Schlesinger W H, Hiram L I, Michaels A and Schnoor J L 1995 Nitrogen
fixation: Anthropogenic enhancement-environmental response Global Biogeochem. Cy. 9
235-252
[5] Du X, Li X, Hao S, Wang H and Shen X 2014 Contrasting patterns of nutrient dynamics
during different storm events in a semi-arid catchment of northern china Water Sci.
Technol. 69 2533-2540
[6] Mehdi B, Lehner B, Gombault C, Michaud A, Beaudin I, Sottile M F and Blondlot A 2015
Simulated impacts of climate change and agricultural land use change on surface water
quality with and without adaptation management strategies Agr. Ecosyst. Environ. 213 47-
60
[7] Narsimlu B, Gosain A K and Chahar B R 2013 Assessment of future climate change impacts
on water resources of Upper Sind River Basin, India using SWAT model Water Resour.
Manag. 27 3647-3662
[8] Sun R, Zhang X, Sun Y, Zheng D and Fraedrich K 2013 SWAT-based streamflow estimation
and its responses to climate change in the Kadongjia River Watershed, southern Tibet J.
Hydrometeorol. 14 1571-1586
[9] Ping Z, Liu Y, Ying P and Yu Z 2013 Land use pattern optimization based on CLUE-S and
SWAT models for agricultural non-point source pollution control Math. Comput. Model. 58
588-595
[10] Zhang P, Liu R, Bao Y, Wang J, Yu W and Shen Z 2014 Uncertainty of SWAT model at
different DEM resolutions in a large mountainous watershed Water Res. 53 132-144
[11] Epelde A M, Cerro I, Sanchez-Perez J M, Sauvage S, Srinivasan R and Antiguedad I 2015
Application of the SWAT model to assess the impact of changes in agricultural
management practices on water quality Hydrolog. Sci. J.
60 825-843
[12] Cerro I, Antigüedad I, Srinavasan R, Sauvage S, Volk M and Sanchez-Perez J M 2014
Simulating land management options to reduce nitrate pollution in an agricultural
watershed dominated by an alluvial aquifer J. Environ. Qual. 43 67-74
[13] Jiang J, Li S, Hu J and Huang J 2014 A modeling approach to evaluating the impacts of
policy-induced land management practices on non-point source pollution: A case study of
the Liuxi River watershed, China Agr. Water Manag. 131 1-16
[14] Yang X, Liu Q, Fu G, He Y, Luo X and Zheng Z 2016 Spatiotemporal patterns and source
attribution of nitrogen load in a river basin with complex pollution sources Water Res. 94
187-199
[15] Abbaspour K C 2011 SWAT-CUP4: SWAT calibration and uncertainty programs--a user
manual Swiss Federal Institute of Aquatic Science and Technology, Eawag
[16] Moriasi D N, Arnold J G, Liew M W V, Bingner R L, Harmel R D and Veith T L 2007 Model
IWEMSE 2018 - International Workshop on Environmental Management, Science and Engineering
100

evaluation guidelines for systematic quantification of accuracy in watershed simulations T.
ASABE 50 885-900
[17] Yang X, Liu Q, He Y, Luo X and Zhang X 2016 Comparison of daily and sub-daily SWAT
models for daily streamflow simulation in the Upper Huai River Basin of China Stoch. Env.
Res. Risk A. 30 959-972
[18] Sundaray S K, Panda U C, Nayak B B and Bhatta D 2006 Multivariate statistical techniques
for the evaluation of spatial and temporal variations in water quality of the mahanadi river-
estuarine system (india)--a case study Environ. Geochem. Hlth. 28 317-330
[19] Ogwueleka T C 2015 Use of multivariate statistical techniques for the evaluation of temporal
and spatial variations in water quality of the kaduna river, Nigeria Environ. Monit. Assess.
187 1-17
[20] Chounlamany V, Tanchuling M A and Inoue T 2017 Spatial and temporal variation of water
quality of a segment of Marikina River using multivariate statistical methods Water Sci.
Technol. 76 1510-1522
Spatio-temporal Patterns of Total Nitrogen Pollution Source Composition in the Ru River Basin
101
