
Space-based Validation of Methane Products from
AIRS/AMSU in China
L Guan
*
and Q Yang
1
Collaborative Innovation Centre on Forecast and Evaluation of Meteorological
Disasters, Key Laboratory for Aerosol-Cloud-Precipitation of China Meteorological
Administration, Nanjing University of Information Science and Technology, Nanjing
210044,China
Corresponding author and e-mail: L Guan, liguan@nuist.edu.cn
Abstrac t. The CH
4
profiles derived fro m AIRS/AMSU (Atmospheric Infrared Sounder/
Advanced Microwave Sounding Unit, hereinafter referred to as AIRS) and GOSAT
(Greenhouse Gases Observing Satellite) at China's five major WMO/GAW atmospheric
background stations are comprised in this paper. The five background sites are Waliguan,
Lin'an, Longfengshan, Shangdianzi and Shangri-La station. The data was selected from April
2009 to December 2013. The results show that AIRS and GOSAT CH
4
profiles have the
similar vertical distribution. The GOSAT CH
4
concentrations are slightly higher than the
AIRS ones at the near surface level. They are in highest coincidence from 500 to 600 hPa
with the differences all within 17.9 ppbv. The AIRS retrievals are obviously higher than
GOSAT retrievals with larger difference (ma ximu m 254.5 ppbv) from 10 to 70 hPa . The
difference of the two inversions is smaller in spring than in other seasons. The CH
4
inversion
accuracy of AIRS is greatly affected by cloud within the field of v iew, and also comes from
retrieval algorithms, seasonal changes and so on.
1. Introduction
Earth's atmospheric temperature and ocean temperature are rising, and the sea level has gradually
increased since 1950s according to the Fifth Assessment Report of the Intergovernmental Panel on
Climate Change (IPCC) [1]. Global warming is an indisputable fact. CH
4
as the second most
important greenhouse gas next to carbon dioxide (CO
2
), increasing of its emissions can exacerbate
global warming. The concentration of methane has risen from 700 ppbv in the preindustrial era to
1800-1900 ppbv today, which is largely due to human activities [2]. CH
4
is not only a greenhouse gas,
but also a chemically active gas that is easily oxidized in the atmosphere and produces a range of
hydroxides and hydrocarbons
[3]. Therefore, it deserves attention.
Currently, the concentration of atmospheric CH
4
is obtained primarily by ground-based
observations and space-borne measurements. The World Meteorological Organization (WMO)
started implementing the Global Atmosphere Watch (GAW) program in 1989. In 1994, China
established an online observing system of greenhouse gases such as CO
2
and CH
4
at the Waliguan
Atmospheric Background Station in Qinghai Province. At the end of 2008, four main atmospheric
background stations (Waliguan in Qinghai, Lin'an in Zhejiang, Longfengshan in Heilongjiang and
20
Guan, L. and Yang, Q.
Space-based Validation of Methane Products from AIRS/AMSU in China.
In Proceedings of the International Workshop on Environmental Management, Science and Engineering (IWEMSE 2018), pages 20-27
ISBN: 978-989-758-344-5
Copyright © 2018 by SCITEPRESS – Science and Technology Publications, Lda. All rights reserved

Shangdianzi in Beijing) set up Wavelength-Scanned Cavity Ring Down Spectroscopy system(WS-
CRDS), and started a continuous high-precision observation from January 2009[4]. Since July 2010,
the Shangri-La Atmospheric Background Station in Yunnan Province has set up an online
observation system for CH
4
greenhouse gases and conducted continuous high-precision observations
to fill gaps in greenhouse gas observations in southwestern China
[5]. Higher accuracy of observation
can be obtained by ground-based observations; however, there are only about 300 global greenhouse
gas-observation stations in the world at present. Ground stations are unevenly distributed and the cost
of observation is too high to obtain the wide range data, which has become a major factor
constraining the research of carbon cycle
[6]. So the space-borne measurements are crucial.
In 1956, King et al. [7] proposed a technology of satellite infrared atmospheric detection, which
started the space-borne observation of atmospheric composition. Halogen Occultation Experiment
(HALOE) is mounted on the Upper Atmosphere Research Satellite (UARS), and its observations are
limited to the tropopause. The height of observations based on the Michelson interferometer and
Atmospheric Chemistry Experiments (ACE) on ENVISAT are similar to HALOE’s. Atmospheric
Infrared Sounder(AIRS) on board the EOS/Aqua platform was launched in May 2002, has 6 space -
borne sensors with 2378 channels covering the wavelength range of 649-1136, 1217-1613 and 2169-
2674 cm
-1
, providing vertical profiles of CH
4
[8]. The Greenhouse Gases Observing Satellite
(GOSAT), world's first spacecraft to measure the concentrations of carbon dioxide and methane, was
launched on January 23, 2009 in Japan. Methane profiles can be obtained by the thermal infrared
band of Fourier Transform Spectrometer (FTS). Zhang et al.
[9] analyzed the temporal and spatial
distribution of methane in the middle and upper troposphere in China from 2003 to 2008 using AIRS
CH
4
. The results show that AIRS CH
4
is consistent with ground-based CH
4
, with an error of less than
1.5%. Wang et al. [10] validated the near-surface CH
4
concentration of the AIRS V6.0 level 2
support product using the ground-based data at Waliguan in Qinghai, Lulinshan in Taiwan and Ulaan
Uul in Mongolia, and found that the error was less than 2% , the trend of change is consistent. Using
the vertical profiles of CH
4
provided by AIRS V6.0 product, Xiong et al. [11] compared the AIRS
retrieval results with simulation results of global tracer model version 3 (TM3) in South Asia from
2003 to 2007, and found that AIRS and TM3 have a consistent trend. Feng et al.[12] used the
ground-based CH
4
of Waliguan Atmospheric Background Station to validate the AIRS retrieval
CH
4
,and the results show that the AIRS retrieval CH
4
is consistent with ground-based CH
4
and there
is a significant positive correlation between them.
China's space-borne observations of greenhouse gas are in their infancy. At present, there are few
studies on the accuracy of methane profiles retrieved by space-borne instruments in China.
Comparison of the AIRS and GOSAT retrieval methane profiles has not been done yet. Therefore, in
this paper, AIRS Level 2 standard CH
4
products are validated by GOSAT inversions at China's five
major WMO/GAW atmospheric background stations, LAN, LFS, SDZ, WLG and XGLL site, and
the possible causes of AIRS retrieval error are also discussed.
2. Study area and data
2.1. Environment of atmospheric background stations
The five stations selected in this paper are located in the area with typical climate and ecological
environment in China and have regional characteristics. Waliguan station is located on the northeast
slope of the Qinghai-Tibet Plateau, slightly affected by human activities. The vegetation is dominated
by plateau meadows (Asakusa, arid and semi-arid desert, grasslands) and sandbanks, with grazing
mainly around the atmospheric background station. The dominant wind direction in winter is the
southwest, the northeast and the southeast in summer, with obvious plateau continental climate [13].
Waliguan station is the world's highest and the first atmospheric background station in the hinterland
of the mainland. Lin'an Atmospheric Background Station is located in China's subtropical monsoon
Space-based Validation of Methane Products from AIRS/AMSU in China
21

region, on behalf of background characteristics of atmospheric composition in the eastern industrial
zone [14]. The CH
4
emission sources such as paddy fields and wetlands at LAN are numerous. Large
population, human factors, dense cities and landfills will also affect the background methane
concentration. The Longfengshan Atmospheric Background Station is located in Wuchang,
Heilongjiang Province, China. It belongs to the temperate monsoon climate and represents the
climate characteristics of the Northeast Plain. The main types of crops are rice and corn. Shangdianzi
Atmospheric Background Station is located in Beijing-Tianjin-Hebei economic zone in China,
belonging to warm temperate semi-humid monsoon climate zone. The main vegetation at SDZ is
forest land and farmland [15]. There is no intensive industrial area and population 30 km around it,
but it will be affected by air mass transport of Beijing-Tianjin-Hebei Economic Circle. Located at the
junction of Yunnan, Tibet and Sichuan provinces, Shangri-La station represents the mixed
atmosphere conditions in the southwest region of China. It is located in the monsoon climate zone
and is the intersection of the East Asian monsoon and the South Asian monsoon. Its underlying
surfaces are mainly coniferous forest, primitive forest and meadow
[16].
2.2. Data
2.2.1. AIRS Instrument and Its Retrieval CH
4
.
Atmospheric Infrared Sounder (AIRS) on board the Aqua/EOS platform was launched by the NASA
in May 2002. The spectral resolution of AIRS is 1200 (λ\Δλ)
[17], with a swath of 1650 km and a
spatial resolution of 13.5 km. The detector is mainly for vertical detection of atmospheric moisture
and temperature from the surface to 40 km altitude [18]. The main retrieval band of methane is
infrared 7.6 μm. 7.6 μm absorption band of CH
4
has approximately 200 channels in it, the main
interference components are H
2
O, N
2
O and so on. Retrieval algorithm eventually selected 71
channels that are relatively insensitive to water vapor and HNO
3
. For the specific retrieval principle,
see Xiong[8]. In the retrieval system, AMSU is combined to retrieve atmospheric temperature and
humidity profiles, and the retrieval spatial resolution is about 45 km. The data used in this paper is
from the AIRS/AMSU Level 2 Standard product (https://airs.jpl.nasa.gov/). The data from April
2009 to December 2013 are selected.
2.2.2. GOSAT retrieval CH
4
.
The Greenhouse Gases Observing Satellite (GOSAT) was launched on January 23, 2009 in Japan.
The spatial resolution of 10.5km. The instrument on board the satellite is the Thermal and Near-
infrared Sensor for carbon Observation (TANSO). TANSO is composed of two subunits: the Fourier
Transform Spectrometer (FTS) and the Cloud and Aerosol Imager (CAI). FTS is used for greenhouse
gas detection and CAI is for collecting cloud and aerosol information. The FTS has four spectral
bands: band 1 (0.75-0.78μm), band 2 (1.56-1.72μm), band 3 (1.92-2.08μm) and band 4 (5.5-14.4μm).
The spectral resolution of band 4 is 0.2 cm
-1
. In the methane retrieval algorithm, all channels of 7.3-
8.8μm are used to retrieve methane, meanwhile, H
2
O, N
2
O, O
3
, temperature profiles are also
retrieved and surface temperature, surface emissivity are derived. In this paper, the L2 methane
profile products retrieved by FTS thermal infrared band were used (http://www.gosat.nies.go.jp/en/)
and the data closest to the atmospheric background stations matches AIRS. Because GOSAT satellite
was launched 2009, the data of common time period between AIRS and GOSAT FTS, April 2009 -
2013 December, are compared.
3. Comparison between AIRS and GOSAT CH4 profiles
The CH
4
vertical profiles retrieved from AIRS and GOSAT for the pixels closest to each background
station (maximum distance less than 100 km) were compared. The GOSAT has a nadir spatial
resolution of about 10.5 km and no retrieval value in some places because of the lager scanning gap,
IWEMSE 2018 - International Workshop on Environmental Management, Science and Engineering
22

so the colocation maximum distance is selected as 100 km. The AIRS profiles and the GOSAT
profiles were all averaged seasonally. March to May represents spring, June to August represents
summer, September to November represents autumn, December, next January and February
represents the winter. AIRS and GOSAT products were matched in time and space.
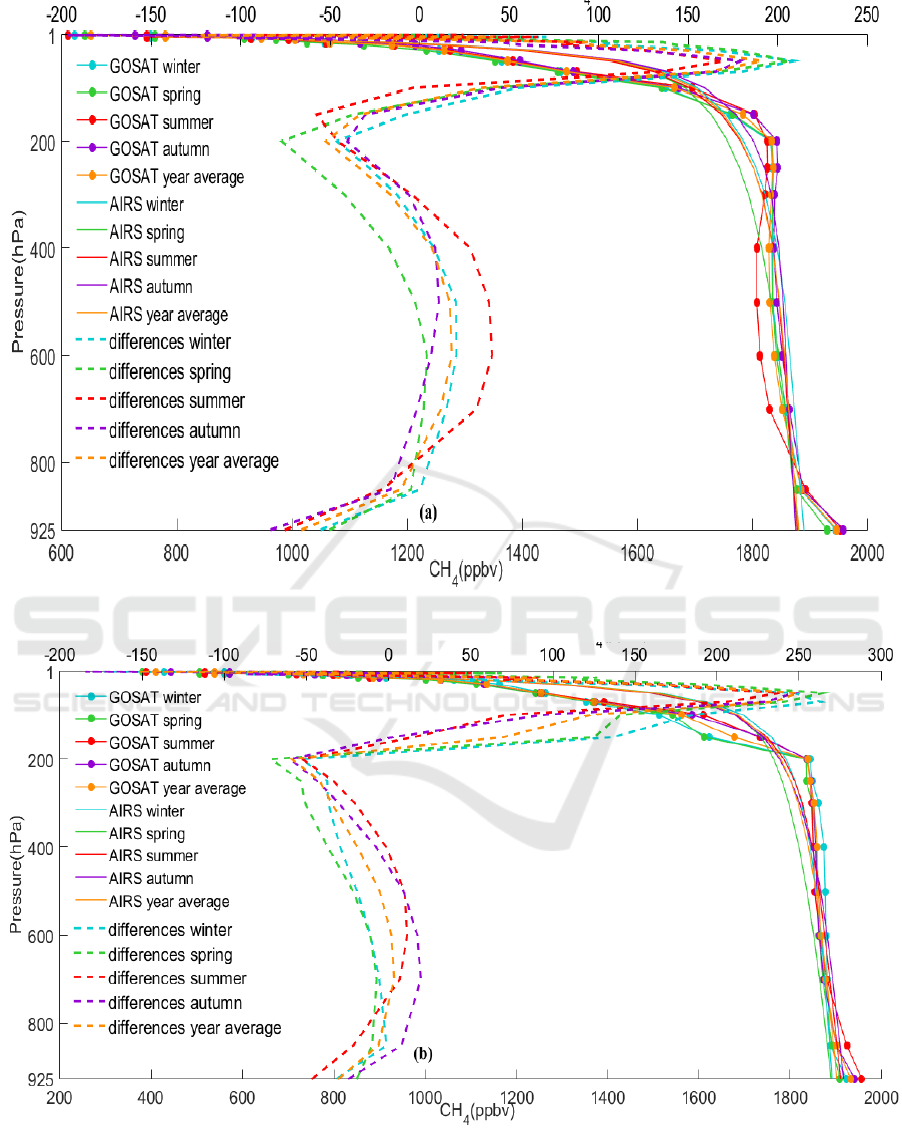
Figure 1 shows the comparison of the CH
4
profiles between AIRS and GOSAT in four seasons
(April 2009 - December 2013). The lower horizontal axis represents the methane concentrations; the
upper horizontal axis represents the differences between the AIRS and GOSAT methane
concentrations. The solid lines represent the AIRS and GOSAT CH
4
profiles in four seasons, while
the dotted lines represent the differences between AIRS and GOSAT CH
4
profiles. As shown in
figure 1, the methane vertical profiles of AIRS and GOSAT are relatively close. The methane
concentrations in troposphere are hardly varying with height with slightly higher in the near-surface
layer, and decrease significantly with height above the troposphere. The annual mean differences of
near-surface methane between the AIRS and GOSAT are -65.69 ppbv, -30.21 ppbv, -59.87 ppbv, -
14.74 ppbv and 0.45 ppbv, respectively at Lin'an, Longfengshan, Shangdianzi, Waliguan and
Shangri-La sites.
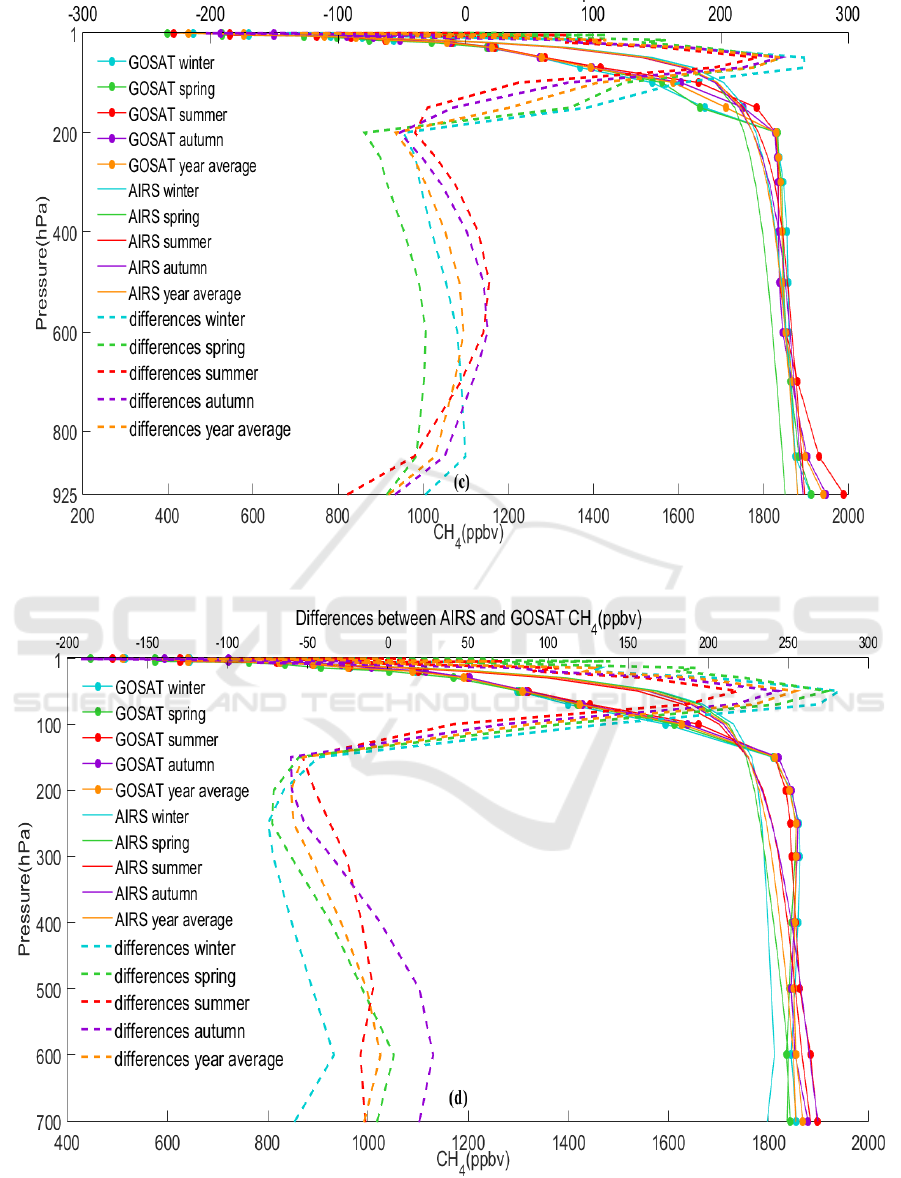
It can be seen from Figure 1 that the AIRS CH
4
below 200 hPa is generally smaller than the
GOSAT’s. The differences between 10-70 hPa are larger. Especially around 50hPa, AIRS CH
4
is
over 200 ppbv higher than the GOSAT’s with the largest difference. The coincidence in 500–600 hPa
between AIRS and GOSAT is higher with deviation less than 17.9 ppbv. Therefore, both data sets
can be applied when studying the changes of tropospheric CH
4
in China. However, GOSAT provides
fewer CH
4
products in near-surface layers; only less than 400 samples are available over the selected
time.
Figure 1 also shows the differences in different seasons. In general, the methane concentrations
retrieved by GOSAT and AIRS at the near surface layer in summer and autumn are higher than those
in winter and spring, mainly because of the larger CH
4
source emissions in the summer and autumn.
At the XGLL site, the near-surface CH
4
in autumn and winter is greater than spring and summer,
which is the same as the seasonal change of CH
4
obtained by ground-based observation [14]. The
differences below 200 hPa in summer are larger than the other three seasons. AIRS CH
4
is higher
than the GOSAT CH
4
in summer, autumn and winter in 400-700 hPa layer at LAN site. The
difference is over 200 ppbv at 50 hPa in winter, with larger difference than the other seasons. At the
Longfengshan station, the AIRS retrieved CH
4
concentration is less than that of GOSAT below 200
hPa with smallest difference happening in winter, and much higher than GOSAT near the 50 hPa
with larger difference in spring. The change of Shangdianzi is similar to Longfengshan. The biases
below 200 hPa in winter are larger in Waliguan.
Space-based Validation of Methane Products from AIRS/AMSU in China
23
IWEMSE 2018 - International Workshop on Environmental Management, Science and Engineering
24
Space-based Validation of Methane Products from AIRS/AMSU in China
25
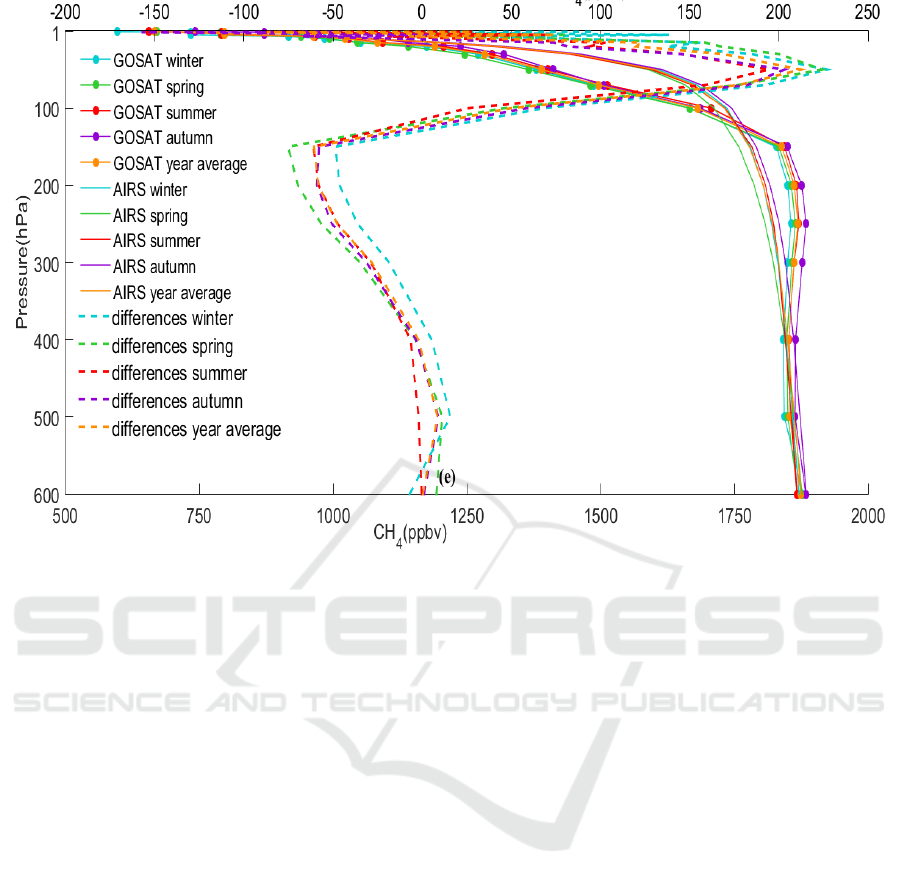
Figure 1. The CH
4
profiles and differences between the AIRS and GOSAT in five atmospheric
background stations ((a), (b), (c), (d), (e) represent LAN, LFS, SDZ, WLG and XGLL sites,
respectively. The lower horizontal axis represent the methane concentrations, the upper horizontal
axis represent the differences).
4. Conclusions
The vertical profiles of methane concentration retrieved by AIRS and GOSAT in the period from
April 2009 to December 2013 was compared in detail in this paper. The main conclusions are as
follows:
1) The vertical distribution of methane concentrations retrieved by AIRS and GOSAT are
consistent with the height. The higher coincidence of the two data sets appears at 500 hPa-
600 hPa layer with differences less than 17.9 ppbv. The AIRS CH
4
at 50 hPa is much higher
than the GOSAT CH
4
.
2) The GOSAT CH
4
concentrations of Lin'an, Longfengshan, Shangdianzi and Waliguan sites
are higher than those of AIRS with the concentrations in summer and autumn higher than
winter and spring at near surface layers. While in Shangri-La site, CH
4
in autumn and winter
are higher than that of spring and summer near surface.
3) The CH
4
inversion accuracy of AIRS is greatly affected by cloud within the field of view,
and also comes from retrieval algorithms, seasonal changes and so on.
Acknowledgments
NOAA of the United States and Japan's GOSAT team provided satellite retrieval products for this
study. The authors hereby express deep appreciation. This work was jointly supported by the
National Natural Science Foundation of China (Grant No. 41575029) and Jiangsu government
scholarship for studying abroad.
IWEMSE 2018 - International Workshop on Environmental Management, Science and Engineering
26

References
[1] Zhou C, Shi R and Gao W 2015 Comparison of carbon dioxide in mid-troposphere and near-
surface Geo-Inf.Sci. 17 1286–93
[2] Xiong X, Weng F, Liu Q and Olsen E 2015 Space-borne observation of methane from
atmospheric infrared sounder version 6: validation and implications for data analysis Atmos.
Meas. Tech. Discuss. 8 8563–97
[3] Sheng P, Mao J, Li J, Zhang A, Sang J and Pan N 2010 Atmospheric physics (Beijing:Peking
University Press) p 10
[4] Fang S, Zhou L, Xu L, Yao B, Liu L , Xia L and Wang H 2012 CH4 concentrations and the
variation characteristics at the four WMO/GAW background stations in China Environ
Sci.33 2917–23
[5] Fang S, Li Z, Zhou L anda Xu L 2012 Variation of CH4 concentrations at Yunnan Xianggelila
background station in China Acta.Scien.Circum. 32 2568–74
[6] Hou S, Lei L and Guan X 2013 General introduction to Greenhouse Gases Observing Satellite
(GOSAT) and its products Remot.Sens.Technol.Appl. 28 269-275
[7] Zhao Y 2014 Comparsion and research of main GHG satellite column concentration and
anthropologic emission in China Doctoral dissertation ,East China Normal University
[8] Xiong X, Barnet C, Maddy E, Sweeney C, Liu X, Zhou L and Goldberg M 2008
Characterization and validation of methane products from the Atmospheric Infrared
Sounder (AIRS) J. Geophys. Res. 113 1-14
[9] Zhang X, Bai W, Zhang and Wang W 2011 Spatiotemporal variations in mid-upper tropospheric
methane over China from satellite observations Chin. Sci. Bull. 56 3321–27
[10] Wang H, Li J, Zhang Y, Li X, Zhang L and Chen L 2015 Spatial and temporal distribution of
near-surface methane concentration over China based on AIRS observations J.Remote.Sens.
19 827–35
[11] Xiong X, Houweling S, Wei J, Maddy E, Sun F and Barnet C 2009 Methane plume over south
Asia during the monsoon season: satellite observation and model simulation Atmos.Chem.
Phys. 9 783–94
[12] Feng D, Gao X, Yang L, Hui X and Zhou Y 2017 A spatial-temporal distribution characteristics
of the atmospheric methane in troposphere on Qinghai-Tibetan plateau using ARIS data
China.Environ. Sci. 37 2822–30
[13] Zhang F, Zhou L and Xu L 2013 Temporal variation of atmospheric CH
4
and the potential
source regions at Waliguan, China Sci.China.Earth.Sci. 43 536–46
[14] Yao Z, Feng M, Lv S, Zhang J, Wang Q, Feng J, Wu M, Sheng G and Fu J 2010
Physicochemical characterization and source apportionment of PM
2.5
collected in Shanghai
urban atmosphere and at Lin’an background atmospheric monitoring station China.Environ.
Sci. 30 289–95
[15] Cheng S, An X, Zhou L, Liu L, Fang S, Yao B and Liu Z 2015 CO
2
concentration representation
of source and sink area at Shangdianzi atmospheric background station in Beijing
China.Environ. Sci. 35 2576–84
[16] Li Z, Fang S, He C, Yang L, Zhang W and Zhou L 2012 Preliminary study of the atmospheric
CO
2
concentration and its variation at Xianggelila background station Environ. Chem. 31
1996–2001
[17] Liu H, Shou Y and Qi C 2014 Application experiment of instability index retrieved with hyper-
spectral Atmospheric Infrared Sounding (AIRS) data in severe convective weather case
Meteor.Mon 40 678–86
[18] Liu C and Ge C 2002 AQUA satellite data policy , major technical indicators and data
localization issues of the United States Earth Observing System Remot.Sens.Inf. 38-42
Space-based Validation of Methane Products from AIRS/AMSU in China
27
