
Modeling of Poverty Rate in Indonesian Using Geographically
Weighted Logistic Regression for Supporting the Sustainable
Development Goals Program in 2030
Lailatus Syarifah
1
, Putri Andriani
1
, Nadhiyati Rizka
1
, Retno Dwi Puspitasari
1
,
Nur Chamidah
2*
1
Student of Statistics Program, Department of Mathematics, Universitas Airlangga, Surabaya, Indonesia
2
Department of Mathematics, Faculty of Sciences and Technology, Universitas Airlangga, Surabaya, Indonesia
Keywords: Poverty Rate in Indonesia, Sustainable Development Goals, Geographically-Weighted Logistic Regression.
Abstract: Sustainable Development Goals (SDGs) is a world development agenda drafted by the United Nations
containing 17 goals with 169 targets and 241 indicators. The objectives of SDGs are economic growth,
social inclusion, and environmental protection. One of the goals of SDGs is to alleviate poverty. Poverty
denotes the limited ability to meet the needs of decent living such as limitations in income, skills, health,
economic assets control, or access to information. Indonesia is ranked 9
th
on the list of countries with the
largest number of poor people in the world. Poverty rates vary greatly between one region and the next,
which can be caused by the diversity of characteristics among the regions. The Indonesia government’s
target is that the poverty rate in Indonesia must fall below 10%. The poverty rates can be categorized and
analysed using the geographically weighted logistic regression (GWLR) model approach. The study found
that the province with the highest poverty percentage is Papua where the significant variables are literacy
rate, percentage of households with proper sanitation, household slum percentage, percentage of households
occupying habitable homes, and percentage of malnutrition.
1 INTRODUCTION
Sustainable Development Goals (SDGs) is a global
development agenda for the next 15 years compiled
by the United Nations (PBB). One of the goals of
SDGs implemented by Indonesia is to alleviate
poverty (Sumekar dan Haryadi, 2016). Indonesia
ranks ninth in the list of countries with the largest
number of poor people in the world (World Bank,
2006). The Government of Indonesia aims to lower
poverty levels in Indonesia to below 10%
(Indonesian Ministry of National Development
Planning, 2018). Poverty rates can be categorized
into low (less than or equal to 10%) and high
(greater than 10%). Poverty rates can be analyzed by
using geographically weighted logistic regression
(GWLR) method by including location factor or
spatial factor into its calculation. Chamidah et al.,
(2014) used GWLR method to model dengue
hemorrhagic fever disease in Surabaya. In this
research, we modelled the level of poverty in
Indonesia, including factors that affect it, using
GWLR. With this research, the government is
expected to be able to alleviate poverty in Indonesia.
Meanwhile, the purpose of this study is to
describe data of poverty rate in Indonesia and the
factors that allegedly influence poverty in every
province in Indonesia by using thematic map,
modeling poverty data in Indonesia with
Geographically Weighted Logistic Regression
(GWLR) analysis using GWR4 software, and to
interpret factors that significantly affect poverty in
each province in Indonesia based on the GWLR
method using thematic maps.
2 LITERATURE REVIEW
Geographically Weighted Logistic Regression
(GWLR) or spatial logistic regression and logistic
regression analysis have almost the same shape. The
difference is that the geographical GWLR technique
is entered into the model through weighting function
Syarifah, L., Andriani, P., Rizka, N., Puspitasari, R. and Chamidah, N.
Modeling of Poverty Rate in Indonesian Using Geographically Weighted Logistic Regression for Supporting the Sustainable Development Goals Program in 2030.
DOI: 10.5220/0007554309350938
In Proceedings of the 2nd International Conference Postgraduate School (ICPS 2018), pages 935-938
ISBN: 978-989-758-348-3
Copyright
c
2018 by SCITEPRESS – Science and Technology Publications, Lda. All rights reserved
935

(Kurnia, 2011). Weighting (w
ij
) is given to each
observation, so the model formed is as follows.
(1)
Notes:
: The observation value of the predictor variable
on location
: Regression coefficients for each location
The logit form for GWLR is as follows.
(2)
Weighting is used to provide different emphasis
for different observations in producing parameter
estimators. Before the weighting is determined, d
ij
must be calculated first using Euclidean distance:
(3)
One of the determinants of the GWLR model is
the selection of weighting functions. The spatial
weighting function commonly used is fixed kernel
weighting, the two examples of which are the fixed
Gaussian kernel and the fixed bisquare kernel.
3 RESEARCH METHOD
The data used in this study was secondary data
obtained from the publication of the Central Bureau
of Statistics (BPS) and the publication of the
Ministry of Health of the Republic of Indonesia. The
observation unit in this study was all provinces in
Indonesia consisting of 34 provinces. The variable
that acts as the response variable (Y) was the
poverty rate of all provinces in Indonesia. This
response variable is categorical on a nominal scale.
This category of poverty level is based on the
Indonesian government's poverty rate target, which
divides poverty rates into two categories:
1 = Low if the percentage of poverty ≤ 10%
2 = High if the percentage of poverty > 10%
Based on other research examined the factors
that influence poverty, the factor affecting poverty
was literacy rate (Rusdarti dan Karolina, 2013).
Some predictor variables that was involved in this
study are literacy rate (X
1
), population density (X
2
),
PDRB (X
3
), unemployment rate (X
4
), percentage of
household with proper sanitation (X
5
), percentage of
slum household (X
6
), percentage of households
occupying habitable home (X
7
), and malnutrition
percentage (X
8
). Slum settlement indicators based on
the condition of facilities and infrastructure include
indicators of road conditions, drainage conditions,
clean water conditions, wastewater conditions, and
solid waste conditions (Hastuti and Syakur, 2017).
The analysis using GWLR method can be described
as follows:
1 Describe the factors affecting the provincial
poverty level in Indonesia based on thematic
maps using Geoda1.8 software with the
following steps:
a. Input the layer file map of provinces in
Indonesia in shp format and input data related
to the provincial poverty rates, along with the
factors that influence it into the table
attribute.
b. Classify the provinces according to the
poverty level data and its factors by the
number of classification class as desired.
c. Display classification results by selecting
option label feature.
2. Model and estimate provincial poverty data in
Indonesia based on Geographically Weighted
Logistic Regression (GWLR) approach using
GWR4 software with the following steps:
a. Determine the latitudes and longitudes of
every province in Indonesia.
b. Calculates the Euclidian distance between
locations at coordinates and locations with
coordinates.
c. Determine the best bandwidth based on the
CV method.
d. Calculating the weighted matrix by using the
Kernel function is Fixed Gaussian, Fixed
Bisquare, and Adaptive Gaussian.
e. Conduct parameter estimation of GLWR
model by including all predictor variables.
f. Perform partial significance test parameters.
g. Determine the best model by using a
weighted matrix that has the smallest AIC
value.
3. Analyze and interpret the factors that
significantly affect the provincial poverty level in
Indonesia based on thematic maps using
Geoda1.8 software with the following steps:
a. Input layer file map of provinces in Indonesia
in shp format and input data related to the
provincial poverty rate along with the factors
that influence it into the table attribute.
b. Classify provinces in Indonesia according to
poverty level data with the number of
classification class as desired.
c. Display classification results by selecting the
option label feature.
d. Undertake interpretation of factors that
significantly influence the level of poverty in
every province of Indonesia.
ICPS 2018 - 2nd International Conference Postgraduate School
936
4 RESULT AND DISCUSSION
Based on GWLR model with f(x) value. it was
found that the higher the Literacy Rate, the
percentage of households with proper sanitation, and
the percentage of households inhabiting a habitable
home, the greater the tendency of a province to have
a lower percentage of poverty, while the higher the
percentage of slum houses and malnutrition
percentage, the greater the tendency of a province to
have a high percentage of poverty.
In the Province of Gorontalo, there are influential
variables, namely Literacy Rate (X
1
), households
with proper sanitation (X
5
) and habitable household
(X
7
). However, the variable X
5
is not in accordance
with the model results in general, where in
Gorontalo Province the obtained model is as
follows:
This means that the higher the percentage of
households with proper sanitation, the greater the
tendency of Gorontalo Province to have a high
percentage of poverty. This is because the possibility
of households that have proper sanitation is due to
assistance provided by the government, not from the
community itself. The comparison between the
logistic regression model and the GWLR model is
done to find out which model is better-suited for the
case of poverty levels in Indonesia. In order to find
out the best model by comparing the AIC values for
both models, the model with the smallest AIC is the
best model.
Table 1: AIC value.
Model
AIC
Logistic Regression
45.966158
GWLR
40.645918
The table shows that the AIC value of the
GWLR model is smaller than the logistic regression
model. Thus, it can be concluded that the GWLR
model is better-suited to analyze poverty data in
Indonesia compared to the logistic regression model.
The picture below shows the estimated
percentages of poverty in Indonesia based on the
GWLR model. There is a difference between before
estimation and after estimation. The provinces where
there is a change of percentage of poverty from low
poverty percentages into high rate estimations are
Jambi, Bangka Belitung Island, Bali, West
Kalimantan, North Kalimantan, South Sulawesi and
North Maluku.
Figure 1: Percentage of poverty in Indonesia based on the
GWLR model.
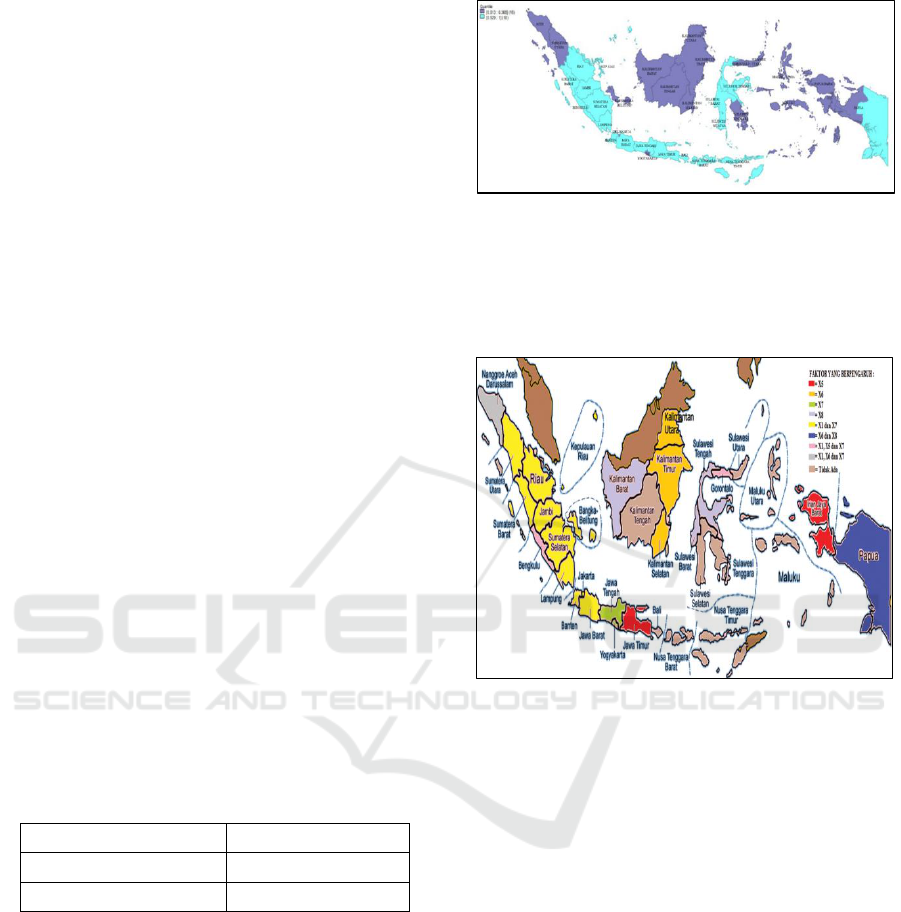
The thematic maps of factors that significantly
influence the Percentage of poverty in Indonesia can
be shown in Figure below.
Figure 2: Predictor variables that affect the percentage of
poverty in each province in Indonesia.
The picture shows the spread of predictor
variables that affect the percentages of poverty in
each province in Indonesia. The influential predictor
variables are X
1
(Literacy), X
5
(Household with
Decent Sanitation), X
6
(Percentage of Slum
Household), X
7
(Percentage of household occupying
habitable homes) and X
8
(Percentage of
Malnutrition). There are 2 provinces or 5.8% of all
provinces in Indonesia where the percentage of
poverty in the area is only influenced by variable X
5
.
The province only affected by X
5
is West Papua
Province and East Java Province. There are 3
provinces or 8.82% of all provinces in Indonesia
where the percentage of poverty in the area is only
influenced by the variable X
6
, which is the
percentage of slums. The provinces only affected by
X
6
is South Kalimantan Province, East Kalimantan
Province, and North Kalimantan Province. The
provinces only affected by X
7
(Percentage of
household occupying habitable homes) are Central
Java and Yogyakarta Provinces. Provinces affected
Modeling of Poverty Rate in Indonesian Using Geographically Weighted Logistic Regression for Supporting the Sustainable Development
Goals Program in 2030
937

by X
8
(Percentage of Malnutrition) are West
Sulawesi, Central Sulawesi and West Kalimantan
Provinces. The percentage of poverty in other
provinces in Indonesia is influenced by more than
one variable. The 11 provinces influenced by
variables X
1
and X
8
are North Sumatra Province,
West Sumatera Province, Riau Province, Jambi
Province, South Sumatera Province, Lampung
Province, Bangka Belitung Island. One province
affected by variables X
6
and X
8
is the province of
Papua. The two provinces affected by variables X
1
,
X
5
and X
7
are Bengkulu and Gorontalo Provinces.
One province affected by variables X
1
, X
6
and X
7
is
Aceh Province. A total of 9 provinces or 26.47% of
the percentage of poverty is not affected by X
1
, X
2
,
X
3
, X
4
, X
5
, X
6
, X
7
, X
8
and X
9
.
The overall classification accuracy is 79.41%.
The result of the estimation of areas with low
poverty level is 10 regions being classified into low
poverty level, while the regions wrongly classified
(from low to high) are 7 regions, namely Jambi,
Kep. Bangka Belitung, Bali Province, West
Kalimantan Province, North Kalimantan Province,
South Sulawesi Province, and North Maluku
Province with classification accuracy of 58.20%.
Meanwhile, there are 17 regions classified into high
poverty level appropriately classified into the
category of high poverty level with 100%
classification accuracy.
5 CONCLUSION
In 2017, as many as 17 (50%) of Indonesian
provinces have a high percentage of poverty, and the
province with the highest percentage of poverty is
the Province of Papua with 28.4%, while the lowest
percentage of poverty is present in DKI Jakarta
Province with 3.75%. Based on the results of the
analysis, the best model for the percentage of
poverty using Kernel functional weights is the Fixed
Gaussian.
The variables that significantly influence the
percentage of poverty are literacy rate (X
1
),
percentage of household with proper sanitation (X
5
),
percentage of slum household (X
6
), percentage of
households occupying habitable homes (X
7
),
percentage of malnutrition (X
8
). Based on the
GWLR model, the higher the literacy rate, the
percentage of households with proper sanitation, and
the percentage of households living in habitable
homes, the greater the tendency of a province to
have a lower percentage of poverty, while the higher
the percentage of slum houses and malnutrition
percentage, the higher the propensity for a province
to have a high percentage of poverty.
From the results of the discussion, the two
provinces with the highest percentage of poverty
were Papua and West Papua Provinces. Papua
Province is influenced by variable percentage of
slum household (X
6
) and malnutrition percentage
(X
8
). The higher the percentage of slum household
(X
6
) and malnutrition percentage (X
8
), the higher the
percentage of poverty. The Province of West Papua
is influenced by the percentage variable of proper
sanitation (X
5
). The lower the percentage of a proper
sanitation RT, the higher the percentage rate of
poverty.
As a suggestion, the government should pay
more attention to provinces with high-category
poverty rates, such as Papua and West Papua. For
the province of Papua, the government should build
housing and provide health treatment for people
affected by malnutrition. As for the Province of
West Papua, the government should hold
socialization programs and assist in the development
of proper sanitation. In addition to an active
government, it is hoped that the Indonesian people
will also support the government's programs in the
success of SDGs 2030 with one of its objectives
being to alleviate poverty in Indonesia.
REFERENCES
Chamidah, N., Saifuddin, T., & Marisa, R. (2014). The
Vulnerability Modeling of Dengue Hemorrhagic Fever
Disease in Surabaya Based on Spatial Logistic
Regression Approach. Applied Mathematical Sciences
HIKARI. 28. 1369 – 1379.
Hastuti dan Syakur. (2017). Spatial Characteristics of
Slum Settlement of South Sulawesi Province. Palopo:
Universitas Cokroaminoto Palopo. (Text in
Indonesian)
Kurnia, A. (2011). Modeling of Logistic Regression
Analysis and Geographically Weighted Regression
Semiparametric (Case Study: Human Development
Index Modeling of East Java Province Year 2008).
Surabaya: Institut Teknologi Sepuluh November,
2011. (Text in Indonesian)
Rusdarti dan Karolina, S. 2013. Factors Affecting Poverty
Level in Central Java Province. Semarang:
Universitas Negeri Semarang. (Text in Indonesian)
Sumekar S., dan Haryadi U. 2016. Socialization of
Sustainable Development Goals (SDGs)
Implementation in the Library. Perpusnas. (Text in
Indonesian)
World Bank. 2006. A New Era in Poverty Alleviation in
Indonesia. Jakarta: The World Bank Office Jakarta.
(Text in Indonesian)
ICPS 2018 - 2nd International Conference Postgraduate School
938
