
Global Trade War: On the Efficiency of US Steel and Non-US Steel
Companies
Yuan Ekananda Muhammad Adikara and Dr. Sri Herianingrum, SE., M.Si
Postgraduate School, Universitas Airlangga, Jl. Airlangga No. 4-6, Airlangga, Gubeng, Surabaya, Indonesia
Keywords: US Steel Companies, Non-US Steel Companies, Global Trade War, Efficiency, Data Envelopment
Analysis.
Abstract: This study aims at analyzing the efficiency of steel companies in the United States and outside the United
States to measure their comparative strengths to confront the global trade war based on Data Envelopment
Analysis. Quantitative approach was employed by means of Data Envelopment Analysis by the assumption
of Variable Return to Scale. The respondents were four US based steel companies and non-US based steel
companies. Intermediation approach was used in measuring the inputs and outputs. Input variables
comprised the assets and labor cost; while the Output variables consisted of operational profit. This study
has found that no steel company was efficient during the observation period. It has been revealed that there
was significant difference in efficiency performance between US based steel companies and Non-US based
steel companies.
1 INTRODUCTION
The Trump tariffs are a series of tariffs imposed
during the presidency of Donald Trump. In January
2018, Trump imposed tariffs on solar panels and
washing machines, and later the same year, he
imposed tariffs on steel and aluminum. Beginning
on June 1st, 2018, Trump administration imposed a
25% tariff on imports of steel, and a 10% tariff on
aluminum, on the European Union, Canada, and
Mexico. The tariffs angered U.S. allies, who planned
retaliatory tariffs on U.S. goods, and heightened
chances of a trade war. China said that it will
retaliate for the tariffs imposed on $50 billion of
Chinese goods that come into effect on July 6. India
is also planning to hit back to recoup trade penalties
of $241 million on $1.2 billion worth of Indian steel
and aluminium. Other countries, such as Australia,
are concerned of the consequences of a trade war
(Long, 2018).
2 LITERATURE REVIEW
A trade war is an economic conflict resulting from
an extreme protectionism in which states raise or
create tariffs or other trade barriers against each
other in response to trade barriers created by the
other party. Increased protection causes both nations
output compositions to move towards their autarky
position. For example, if a country were to raise
tariffs, then a second country in retaliation may
similarly raise tariffs. An increase in subsidies,
however, may be difficult to retaliate against by a
foreign country. Many poor countries do not have
the ability to raise subsidies. In addition, developing
countries are more vulnerable than developed
countries in trade wars. Thus, in raising protections
against dumping of cheap products, a government
risks making the product too expensive for its people
to afford.
Trade wars and protectionism have been
implicated as the cause of some economic crises, in
particular the Great Depression (Irwin, 2017).
Efficiency and effective use of resources are the
main goal of every company manager. When a
company cannot effectively produce their goods and
services, it results in the failure in the competition of
using their fund as well as distributing the fund to
divisions in needs of business capital. Conceptually,
the more efficient the operations of a company, the
easier the optimum profit will be achieved.
Subsequently, the easier addition of fund will be
distributed, the more competitive the fund. It all
eventually leads to the better the quality of goods
Adikara, Y. and Herianingrum, S.
Global Trade War: On the Efficiency of US Steel and Non-US Steel Companies.
DOI: 10.5220/0007553608930897
In Proceedings of the 2nd International Conference Postgraduate School (ICPS 2018), pages 893-897
ISBN: 978-989-758-348-3
Copyright
c
2018 by SCITEPRESS – Science and Technology Publications, Lda. All rights reserved
893

and service given to clients, as well as the safer and
healthier the company will become.
Every organization certainly needs to be
effective. In general, efficiency means to avoid
every possible waste. Bear in mind that the ability of
an organization to acquire and possess operation
infrastructures, also known as source of fund and
resources essential for the operation of the
organization, is limited – while the objectives are
infinite, there is no justification for extravagance.
Efficiency is the answer for difficulties in
calculating the measurement of performance such as
allocation, techniques, and total efficiency (Hadad,
2003). According to Bastian (2009), efficiency is the
capability to complete tasks correctly or
mathematically. It is defined as the calculation of
output and input ratio or the amount of output
obtained from certain amount of input used.
According to Kurnia (2005), DEA is one of the
non-practical analyses which is used to measure
relative efficiency. Practically, either profit-oriented
or non-profit oriented business organizations, their
production and activities use certain amount of
inputs in order to achieve certain amount of outputs.
The analysis tool also measures the efficiency basis
and is also a tool for policy making in aiming at
efficiency improvement. Sutawijaya and Lestari
(2009) add that DEA can be used in many fields,
including: health care, education, transportation,
manufacturing, and also banking.
3 RESEARCH METHOD
This was a quantitative research which devised
quantitative analytical tools and Data Envelopment
Analysis (DEA) method. The variables in the
research were divided into two, namely inputs and
outputs. Input variables comprised assets and labor
cost; while output variables were in the form of
operational profits. Aside from that, the research
used secondary sources obtained from the annual
financial reports of these selected US based and non-
US based steel companies within the period of 2013-
2016.
The populations of this research were steel
companies registered in the World Steel Association
in the period of 2013-2016. The sampling method in
this research was done through purposive sampling
method which meant the samples were chosen based
on the judgement, showing that samples were not
chosen randomly and the information about the
samples was obtained in certain ways. The sampling
criteria were the largest steel producer by volume
located in United States and the largest steel
producer by volume based in the country outside of
United States affected by trade war during the same
period of time and steel companies delivering
financial reports during the observation period
(2013-2016) which have been publicized.
According to the criteria, the US largest steel
producers by volume were AK Steel, Nucor
Corporation, Steel Dynamics and US Steel
Corporation, consecutively. On the contrary, non-US
steel producers by volume affected by trade war
meeting were ArcelorMittal, China Baowu Steel
Group, Maanshan Iron and Steel Company, and
ThyssenKrupp.
3.1 Data Envelopment Analaysis
(DEA)
This research used Data Envelopment Analysis
(DEA) method with Variable Return to Scale (VRS)
model. DEA is a mathematical program optimization
method which measures the technical efficiency of
an Economic Activity Unit (EAU) and compares the
units with others (Sutawijaya and Lestari, 2009).
DEA is a non-parametric approach which is linear to
programming-based supported by technical
efficiency software packages. Specifically, OSDEA
is used for this study .
DEA assumes that each Economic Activity Unit
will have weight which maximizes its efficiency
ratio (maximized total weighted output/total
weighted input) (Muharam and Pusvitasari, 2007).
Maximization assumption of efficiency ratio had
made this DEA research to employ output
orientation in calculating the technical efficiency.
Another type of orientation was the minimization of
input, however from both two assumptions the
similar results will be achieved (Sutawijaya and
Lestari, 2009). Each EAU used combination of
different inputs to achieve different output
combinations, this way each EAU would choose a
set of measurementwhich reflect those diversities.
An EAU is said to be relatively efficient when
the dual value equals to 1 (efficiency value at 100
percentile); when the dual value is less than 1, it
means that the EAU is considered to be relatively
inefficient or suffering from inefficiency (Huri and
Susilowati, 2004). Technical efficiency in steel
company was measured using ratio between output
and input. DEA will calculate steel company which
use input n to reach output m which is different
(Sutawijaya and Lestari, 2009).
ICPS 2018 - 2nd International Conference Postgraduate School
894
3.2 Normality Test (Shapiro-Wilk Test)
Normality test was conducted as the requirement to
conduct independent sample t-test. Normality test
could be performed by doing non-parametrical
statistical analysis Shapiro-Wilk. This research used
Shapiro-Wilk difference testing because this
research only recruited less than 50 subjects or
respondents. Shapiro Wilk test was considered to be
more accurate when the subject is less than 50.
3.3 Independent Sample t-Test
Statistical technique was used as data processing for
the research in the form of knowing the difference of
two averages (independent t-test). The formula to
acquire the standard deviation of average calculation
difference (
̅
̅
). This hypothesis testing in the
form of difference testing of two averages aimed to
verify the accuracy of the hypothesis. In other
words, it aimed to determine whether the hypothesis
is rejected or accepted. The significance was 95%.
Where:
If
>
then
is accepted
If
<
then
is rejected
4 RESULT AND DISCUSSION
This research aimed to compare the efficiency
values which currently become an important aspect
in measuring the performance of steel companies.
Steel companies as Economic Activity Units are said
to be relatively efficient when their dual value shows
the value of 1 (efficiency value equals to 100
percent). In contrast, when the dual value is less than
one, then the respective EAU can be considered as
relatively inefficient (Huri and Susilowati, 2004).
Based on the calculation using DEA method with
the assumption of Variable Return to Scale (VRS)
using OSDEA software, it is seen from the table that
the level of efficiency achieved by all of US based
and non-US based steel companies in 2013-2016
tended to fluctuate over the years.
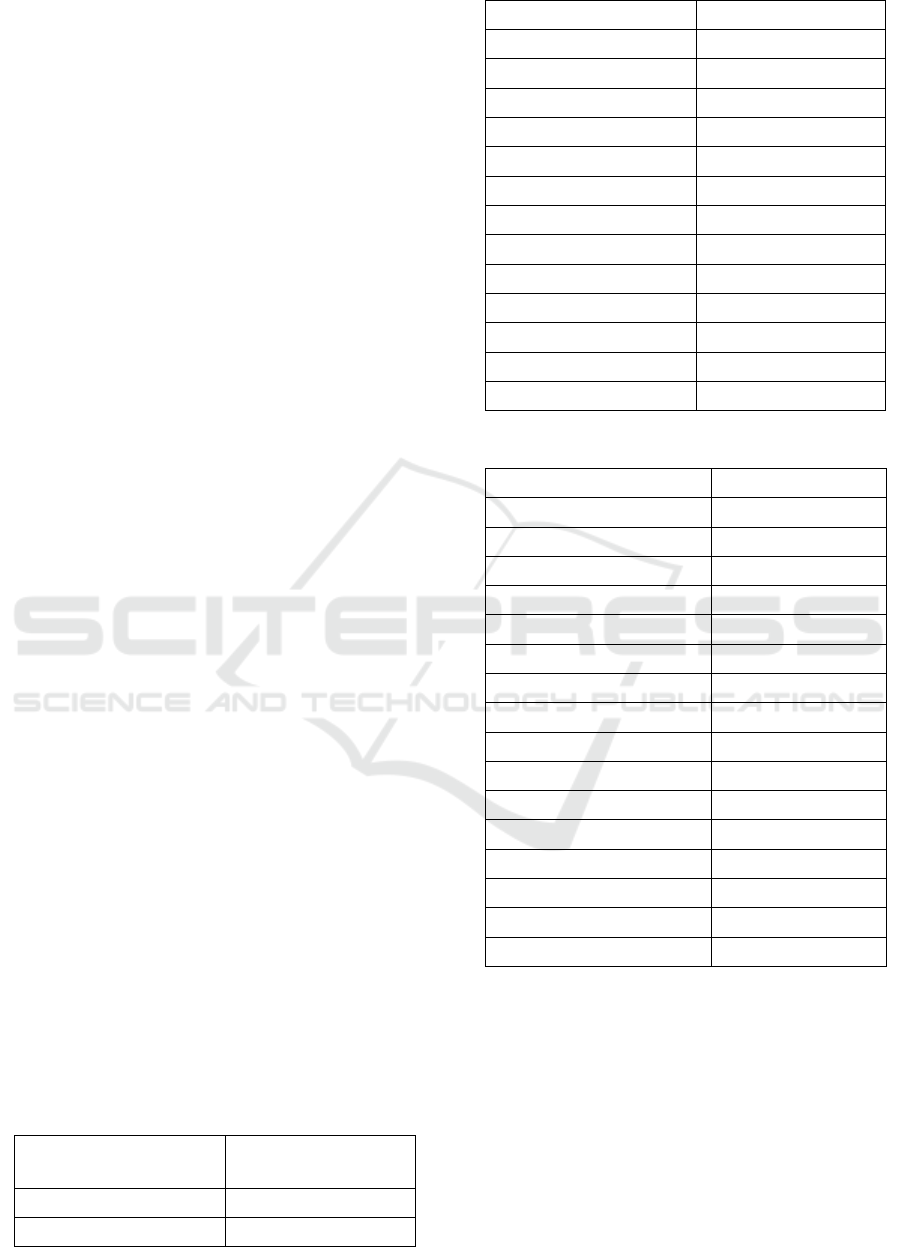
Table 1: US based steel companies.
US based Efficiency value
AK steel 2013 1
AK steel 2014 0,833365887
AK steel 2015 0,882797963
AK steel 2016 1
Nucor 2013 0,693475868
Nucor 2014 0,776181594
Nucor 2015 0,492737385
Nucor 2016 0,740671037
Steel dynamics 2013 0,93340913
Steel dynamics 2014 0,761457273
Steel dynamics 2015 0,624471496
Steel Dynamics 2016 1
US Steel 2013 1
US Steel 2014 0,496787074
US Steel 2015 1
US Steel 2016 0,827619804
Table 2. Non-US based steel companies.
Non-US Based Efficiency Value
ArcelorMittal 2013 0,138189787
ArcelorMittal 2014 0,317495912
ArcelorMittal 2015 0,625406565
ArcelorMittal 2016 0,63958895
Baowu Steel 2013 0,635874753
Baowu Steel 2014 0,624412882
Baowu Steel 2015 0,081815492
Baowu Steel 2016 1
Maanshan Steel 2013 0,216192461
Maanshan Steel 2014 0,156617197
Maanshan Steel 2015 1
Maanshan Steel 2016 0,240326323
ThyssenKrupp 2013 0,17941338
ThyssenKrupp 2014 0,240090524
ThyssenKrupp 2015 0,216271204
ThyssenKrupp 2016 0,260972677
There were no steel companies remained
efficient during observation period. Hence, it can be
assumed that neither US nor non-US steel company
has succeed in maximizing their inputs and outputs.
This means that the value of inputs and outputs
achieved by the companies was said to be less
efficient and could not achieve their targets.
Inefficient steel companies cannot maximize
their inputs and outputs. This means that the inputs
and outputs achieved by the steel companies cannot
meet their targets (Muharam and Pusvitasari, 2007).
Global Trade War: On the Efficiency of US Steel and Non-US Steel Companies
895

According to the calculation of DEA, US based steel
companies and non-US based steel companies
suffered from inefficiency rooted from the input
variables (assets and labor costs) and the output
variables (operational profits). The measure of steel
company efficiency tends to be limited to the
correlation between technical and operational system
in the process of converting the input to become
output (Sutawijaya and Lestari, 2009). Therefore,
what is needed is an internal micro policy, which
means optimum control and allocation of inputs in
order to gain maximum outputs.
The use of the first input, total asset, by the steel
companies suffered from inefficiency because the
value of total asset was bigger than the target. The
allocated inputs were bigger than the target and
could not be maximized in order to produce outputs.
The suggested solution is by allocating input total
asset surplus to other input so that it can be more
productive assets. Aside from that, in order to fix
management of productive asset proportion, either
credit or financing distributed to the organization’s
many operational divisions should be properly
adjusted by their relative size, so that the operational
function of the steel companies can be improved.
The use of the second input, labor costs, is not in
accordance to or bigger than what the steel
companies have needed to pay their employees’
salaries. This is supported by the fact that there is an
increase in the number of employees which is not
balanced with the needed skills, causing the steel
companies to suffer from the decrease of
productivity (Sutawijaya and Lestari, 2009).
Output inefficiency in this current research has
been caused by operational profits. It has been far
too small than its potential. An improvement
proposed for the companies is to increase the value
of credit distribution/financing to the organization’s
many operational divisions properly adjusted by
their relative size.
In order to be able to significantly see the
difference of efficiency value between each period
group, independent sample t-test testing was
conducted. This required normal data distribution.
Data normality test in this research was acquired
using Shapiro-Wilk test.
Table 3. Shapiro-Wilk test.
Bank
Normality
test result
US based steel companies 0.561
Non-US based steel companies 0.851
The result of Shapiro-Wilk normality test using
SPSS 16 has shown that overall efficiency acquired
from DEA method during the post Eurozone crisis
period in 2013-2016 has possessed normal data
distribution because it has bigger value than the
alpha (0.05).
After conducting analytical testing by means of
t-test or Independent Sample t-test, the result gained
was the difference of efficiency performance using
DEA-VRS approach. In the following table, the
value of t calculation is 4.474; while the value of t
table with α = 0.05 and Df = 3 is 2.353. It can be
concluded that t calculation > t table; therefore,
is
accepted. Based on the achieved probability value,
the value is 0.004. Since the value is smaller than the
alpha (0.05),
is rejected.
Table 4. Independent sample t-test.
Model t calculation df Probability
DEA-VRS 4.474 3 0.004
Based on the comparison of the t value and the
achieved probability, it can be concluded that there
has been significant difference in the value of
efficiency between the US Based Steel Companies
and non-US based steel companies.
The obvious contrast of different inefficiency
between the US Based Steel Companies and non-US
based steel companies could be explained by
Chinese based steel companies that is dominated by
a number of large state-owned groups owned via
shareholdings by local authorities, provincial
governments and even the central authorities. Profits
are low despite continued high demand due to high
debt and overproduction of high end products
produced with the equipment financed by the high
debt. The central government is aware of this
problem but there is no easy way to resolve it as
local governments strongly support local steel
production. Meanwhile, each firm aggressively
increases production (Hogan, 2000).
5 CONCLUSION
In conclusion, among US US Based Steel
Companies and non-US based steel companies, there
were no steel companies remained efficient during
the period of observation. The influence of input and
output variables in each bank was shown to be
different towards the efficiency. Furthermore,
according to the independent sample t-test testing, it
could be concluded that there has been significant
ICPS 2018 - 2nd International Conference Postgraduate School
896

difference in the efficiency value of the US Based
Steel Companies and non-US based steel companies,
can be calculated from the comparison of t value and
the achieved probability (
is rejected)
Referring to the results and the conclusion, some
suggestions have been proposed for involved parties
and further researches. In order to improve their
efficiency, steel companies need to allocate surplus
in the use of inputs to other inputs. For further
researches, it is recommended that further
researchers use bigger samples in order to achieve
optimum results and can describe steel companies
efficiency in the world in broader sense.
ACKNOWLEDGMENT
This research was supported by Sekolah Pasca
Sarjana Universitas Airlangga. We thank our
colleagues from Sekolah Pasca Sarjana who
provided insight and expertise that greatly assisted
the research, although they may not agree with all of
the interpretations/conclusions of this paper.
We also thank Dr. Sri Herianingrum SE., M.Si.
for comments that greatly improved the manuscript.
We would also like to show our gratitude to our
colleagues from MSEI 2016 for sharing their so-
called insights and their pearls of wisdom with us
during the course of this research.
REFERENCES
A. Bastian, 2009, “Analisis Perbedaan Asset dan Efisiensi
Bank Syariah di Indonesia Periode Sebelum dan
Selama Program Akselerasi Pengembangan Perbankan
Syariah 2007-2008 Aplikasi Metode DEA (Studi
Kasus 10 Bank Syariah di Indonesia),” Unpublished
thesis, Faculty of Economics Diponegoro University
Semarang.
A. Sutawijaya and E.P. Lestari,, “Efisiensi Teknik
Perbankan Indonesia Pasca Krisis Ekonomi: Sebuah
Studi Empiris Penerapan Model DEA,” Jurnal
Ekonomi Pembangunan, Vol. 10 No.1.
A.S. Kurnia, 2005, Data Envelopment Analysis Untuk
Pengukuran Efisiensi, Workshop Modul, Semarang:
Diponegoro University.
D. Irwin, Peddling. 2017. Protectionism: Smoot-Hawley
and the Great Depression, Princeton University Press.
p. vii-xviii,.
H. Long, Trump has officially put more tariffs on U.S.
allies than on China, (retrieved on June 27, 2018 from
https://www.washingtonpost.com/news/wonk/wp/201
8/05/31/trump-has-officially-put-more-tariffs-on-u-s-
allies-than-on-china/?utm_term=.27c69b17e815),
2018.
H. Muharam & R. Pusvitasari, 2007, “Analisis
Perbandingan Efisiensi Bank Syariah dengan Metode
Data Envelopment Analysis (Periode tahun 2005),”
Jurnal Ekonomi dan Bisnis Islam, Vol.2 No.3.
M.D. Hadad, 2003, Pendekatan Parametrik Efisiensi
Perbankan Indonesia. (retrieved on May 23, 2017 from
www.bi.go.id),.
M.D. Huri and I. Susilowati, 2004. “Pengukuran Efisiensi
Relatif Emiten Perbankan Dengan Metode Data
Envelopment Analysis (DEA) (Studi Kasus: Bank-
bank yang Terdaftar di Bursa Efek Jakarta Tahun
2002),” Jurnal Dinamika Pembangunan, Vol. 1 No 2
W.T. Hogan, 2000. The Steel Industry of China,
Lexington Books.
Global Trade War: On the Efficiency of US Steel and Non-US Steel Companies
897
