
The Level of Leukocytes, Eosinophils, Monocytes, and Lymphocytes
in Mice (Mus musculus) on Post-Inoculation of Trypanosoma evansi
Marek Yohana Kurniabudhi
1
, Era Hari Mudji
2
, Rini Fajarwati
3
1,3
Faculty of Veterinary Medicine, Airlangga University
2
Faculty of Veterinary Medicine, Wijaya Kusuma University of Surabaya
Keywords: Trypanosoma, Leukocytes, Eosinophils, Monocytes, Lymphocytes.
Abstract: Surra is a disease that has an economic impact because it has a wide geographical distribution and is able to
infect various domestic and wild mammals, causing death. This disease makes livestock productivity,
causes milk and meat production to drop, makes carcass quality poor, reduces production performance, and
requires high cost for treatment. This study aims to determine the level of leukocytes, eosinophils,
monocytes, and lymphocytes of mice inoculated with Trypanosoma evansi. The results are presented in a
descriptive form. The research results showed that the Leukocyte levels were P0 = 13.62 ± 7.08
ab
, P1 = 8.15
± 1.04
a
, P2 = 13.18 ± 4.69
ab
, P3 = 16.22 ± 4.95
b
; Eosinophils levels were P0 = 0.05 ± 0.13
a
, P1 = 0.97 ±
0.82
a
, P2 = 0.36 ± 0.05
a
, P3 = 0.00 ± 0.00
a
, in which there was no significant difference in the four
treatments for leukocytes and eosinophils; while the Monocytes levels were P0 = 1.83 ± 0.50
a
, P1 = 1.48 ±
0.24
a
, P2 = 2.68 ± 0.45
b
, P3 = 5.43 ± 0.37
c
; Lymphocytes levels were P0 = 7.71 ± 4.36
b
, P1 = 3.41 ± 1.34
a
,
P2 = 5.85 ± 1.24
ab
, P3 = 8.53 ± 3.91
b
, in which there were significant differences between the four
treatments for monocytes and lymphocytes, with p ≤ 0.05. Trypanosoma evansi inoculation can increase
level of leukocytes, eosinophils, monocytes and lymphocytes in mice after 3 days of infection.
1 INTRODUCTION
A parasitic disease that frequently attacks cattle is
Trypanosomiasis (Surra). This disease makes
livestock productivity, causes milk and meat
production to drop, makes carcass quality poor,
reduces production performance, and requires a high
cost of treatment (Dargantes, 2010).
Trypanosomiasis is caused by a protozoon, a blood
parasite called Trypanosoma evansi. This parasite
can be found in the blood circulation in the acute
phase of infection. T. evansi takes glucose as a
source of nutrients so that if the animal does not
have good nutritional intake, the parasite will cause
a decrease in blood glucose. Trypanotoxin is a toxin
produced by Trypanosoma sp that can lyse red blood
cells and lead to anemia condition in host animals
(Astuti et al., 2006). This study aims to determine
the levels of leukocytes, eosinophils, monocytes, and
lymphocytes in mice that are inoculated with
Trypanosoma evansi.
2 LITERATURE REVIEW
Trypanosomaevansi was firstly discovered by
Griffith Evans in camels and horses in India. This
disease has the local name surra, meaning “thin”. T.
evansi is allegedly derived from the evolution of
T.Brucei, which causes the nagana disease in
animals in Africa. The spread of T. evansi in India is
through infected camels for trade (Eyob and Matios,
2013). The surra case was first reported in Indonesia
in 1897 in the horse population on the island of Java,
sporadically spreading throughout Indonesia
(Ausvetplan, 2006).
3 METHOD AND MATERIALS
This research was an experimental research with a
post-test only on control group design. This study
applied Completely Randomized Design (RAL) with
random sampling technique in 4 treatments using 6
replications. Three variables comprise of the
independent variable, which was the difference in
608
Kurniabudhi, M., Mudji, E. and Fajarwati, R.
The Level of Leukocytes, Eosinophils, Monocytes, and Lymphocytes in Mice (Mus musculus) on Post-Inoculation of Trypanosoma evansi.
DOI: 10.5220/0007548006080610
In Proceedings of the 2nd International Conference Postgraduate School (ICPS 2018), pages 608-610
ISBN: 978-989-758-348-3
Copyright
c
2018 by SCITEPRESS – Science and Technology Publications, Lda. All rights reserved
the time of taking blood; the dependent variables,
which were the amounts of leukocytes, eosinophils,
monocytes, and lymphocytes of mice (Mus
musculus); and control variables namely sex, age,
cage, and treatment (pellet and drink).
The laboratory animals used were 24 adult male
BALB/C-strain mice (Mus musculus) (aged > 2
months) with weight range of 25-30g.
Trypanosoma evansi was inoculated in mice
through intraperitoneal technique. The blood of the
mice containing the 10
3
Trypomastigote stadium
parasite was injected for as much as 0.2 ml in the
treated mice, except in the control mice. Blood was
taken through the heart using 3 ml syringe with 26G
or 28G needle. Then, the preparation of blood ulcers
was conducted to determine the development of
parasite in blood plasma. It was made by taking a
little blood from the collection and dripping it on a
glass object. Blood was applied to a glass object, and
then methanol was added to conduct fixation for 3-5
minutes. Giemsa with 10% stain was done for 30
minutes on a blood vial that has been fixed with
methanol. The stained preparation was washed with
flowing water, dried up, and observed under a
microscope.
4 RESULTS AND DISCUSSION
Table 1: The Average (±SD) Mice Leukocyte Levels (10
3
Cell/μl) on Post-Inoculation in Trypanosoma evansi.
Treatment Average
(±SD)
P0 (Control: Blood-
takin
g
afte
r
72 hours
)
13.62±7.08
ab
P1 (Blood-taking
afte
r
24 hours
)
8.15±1.04
a
P2 (Blood-taking
afte
r
48 hours)
13.18±4.69
ab
P3 (Blood-taking
afte
r
72 hours)
16.22±4.95
b
Note: The same superscripts in same column with P
0.067 ≥ 0.05 signifies no significant difference
between treatments.
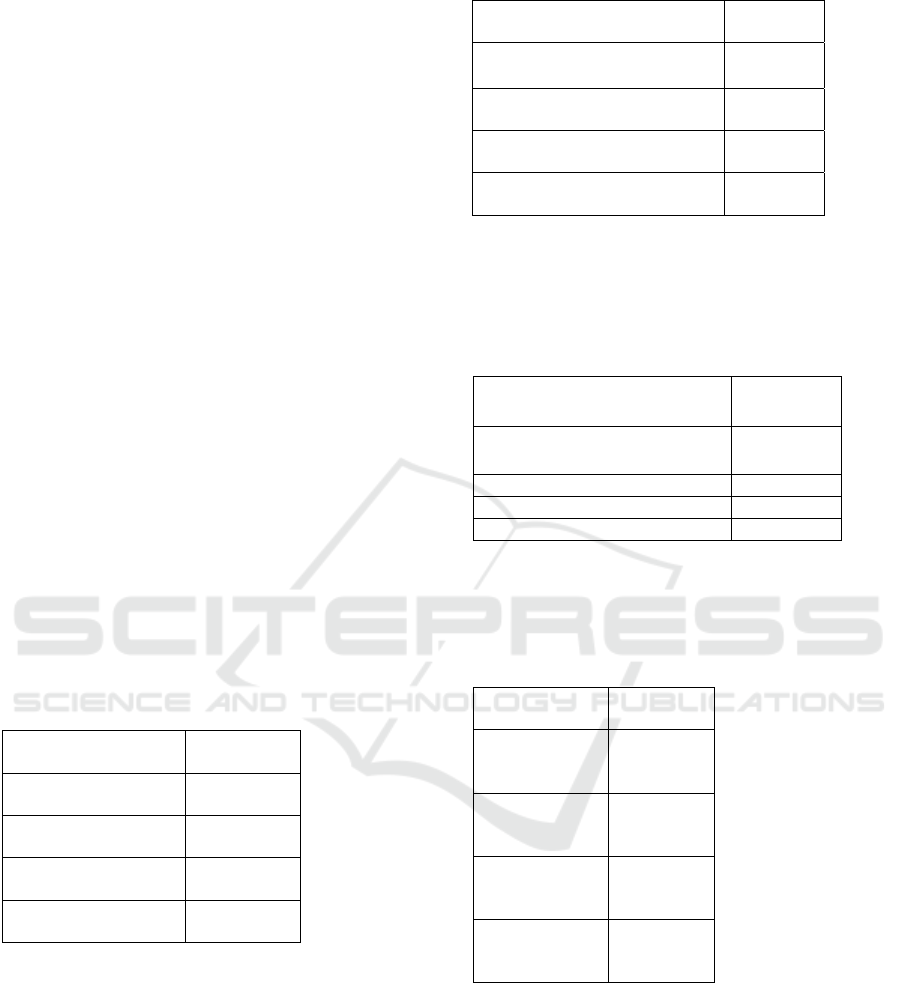
Table 2: The Average (±SD) Mice Eosinophil Levels (10
3
Cell/μl) on Post-Inoculation in Trypanosoma evansi
Note: The same superscripts in the same column
with P 0.273 ≥ 0.05 signifies no significant
difference between treatments.
Table 3: The Average (±SD) Mice Monocyte Levels (10
3
Cell/μl) on Post-Inoculation in Trypanosoma evansi
Treatment Average
(±SD)
P0 (Control: Blood-taking after
72 hours)
1.83 ±0.50
a
P1
(
Bloo
d
-takin
g
afte
r
24 hours
)
1.48±0.24
a
P2
(
Bloo
d
-takin
g
afte
r
48 hours
)
2.68± 0.45
b
P3 (Bloo
d
-taking afte
r
72 hours) 5.43±0.37
c
Note: Superscripts are different in the same column
with P 0.00 ≤ 0.01, indicating a very significant
difference between control and treatments.
Table 4: The Average (±SD) Mice Lymphocyte Levels
(10
3
Cell/μl) on Post-Inoculation in Trypanosoma evansi.
Treatment Average
(±SD)
P0 (Control:
Blood-taking
afte
r
72 hours)
7.71±4.36
b
P1 (Blood-
taking after 24
hours)
3.41±1.34
a
P2 (Blood-
taking after 48
hours
)
5.85±1.24
ab
P3 (Blood-
taking after 72
hours
)
8.53±3.91
b
Detail: Superscripts are different in the same column
with P 0.042 ≤ 0.05, indicating a significant
difference between control and treatments.
5 CONCLUSIONS
Trypanosoma evansi infection affects leukocytes,
eosinophils, lymphocytes, and monocytes levels, and
the blood-taking of mice in different hours affects
Treatment Average
(
±SD
)
P0 (Control: Blood-taking after
72 hours)
0.05±0.13
a
P1 (Blood-taking after 24
hours
)
0.97±0.82
a
P2 (Blood-taking after 48
hours
)
0.36±0.05
a
P3 (Blood-taking after 72
hours)
0.00±0.00
a
The Level of Leukocytes, Eosinophils, Monocytes, and Lymphocytes in Mice (Mus musculus) on Post-Inoculation of Trypanosoma evansi
609

levels of leukocytes, eosinophils, lymphocytes, and
monocytes.
REFERENCES
Abbas, AK and AH Lichtman. 2005. Cellular and
Molecular Immunology. Elsevier Science: USA.
Aboderin, FI and VO Oyetayo. 2006. Haematological
Studies of Rats Fed Different Doses of Probiotics,
Lactobacillus Plantarum, Isolated from Fermenting
Com Slurry. Pakistan J.Nutr. 5: 102-105.
Akers RM and DM Denbow. 2008. Anatomy and
Physiology of Domestic Animals. Blackwell
Publishing: USA.
Amanda, USA 2012. Differential Leukocytes and
Neutrophil/Lymphocyte (N/L) Ratios in Female Mud
Buffalo (Bubalus bubalis). Undergraduate Theses.
Faculty of Veterinary Medicine. Bogor Agricultural
Institute.
Ausvetplan. 2006. Disease Strategy Surra. Primary
Industries Ministerial Council: Australia.
Bolliger, AP, NE Everds; TOS Zimmerman; DM Moore;
SA Smith and KF Barnhart. 2010. Hematology of
Laboratory Animals on Schlam's: Veterinary
Hematology. 6
th
ed. Blackwell Publishing. Singapore.
Campbell, TW 2015. Exocitic Animal Hematology and
Cytology. 4
th
ed. Wiley-Blackwell: USA.
Colville, T. and JM Bassert. 2002. Clinical Anatomy and
Physiology for Veterinary Technicians. Mosby. USA.
Dargantes, AP 2010. Epidemiology, Control and Potential
Insect Vectors of Trypanosoma evansi (Surra) in
Village Livestock Philipphines. [Phd. Thesis]. Division
of Health Science. Murdoch University.
Desquesnes M., A. Dargantes., DH. Lai., ZR. Lun., P.
Holzmuller and S. Jittapalapong. 2013. Trypanosoma
evansi and Surra: A Review and Perspectives on
Transmission, Epidemiology and Control, Impact and
Zoonotic aspects. Biomed Res Int. 2013: 1-20
Dharmawan, NS 2002. Introduction to Veterinary Clinical
Pathology (Clinical Hematology) 2
nd
Printing.
Pelawasari: Denpasar.
Ekaningtias, M. 2014. Effect of Hymeniacidon sp. Spons
Extract Giving on the Levels of Parasitemia
Trypanosoma evansi on BALB/c Mice (Mus musculus
L). Journal of Veterinary Science Vol. 32. No. 200
UGM: Yogyakarta.
Eyob, E. and Matios, L. 2013. Review on Chamel
Trypanosomosis (Surra) Due to Trypanosoma evansi:
Epidemiology and Host Respond. Journal of
Veterinary Medicine and Animal Health Vol.5 (12) PP
334-343: Ethiopia.
Fischbach F. and Marshall BD 2009 A Manual of
Laboratory and Diagnostic Tests.Ed 8th. Philadelphia:
Lippincott & Wilkins.
Guyton, AC and Hall. 2008. Textbook of Medical
Physiology. 11
th
ed. Translator: Irawati. EGC: Jakarta.
Translation from: Textbook of Medical Physiology.
Holland WG., NG Thanh, TT Do., S. Sangmaneedet., B.
Goddeeris and J. Vercruysse. 2005. Evaluation of
diagnostic tests for Trypanosoma evansi in
experimentally infected pigs and subsequent use in
field surveys in north Vietnam and Thailand. Tropical
Animal Health and Production 37, 457-467.
Kresno, BS 2010. Immunology: Diagnosis and Laboratory
Process. The fifth edition. Balai Penerbit Fakultas
Kedokteran Indonesia. Jakarta
Meyer, D., Cole, JE and Carroll, LJ 1975. Veterinary
Laboratory Medicine Interpretation and Diagnosis
.WB Saunders Co. Philadelphia, London, Toronto,
Montreal, Sydney, Tokyo.
Nordenson, NJ 2002. White Blood Cell Count and
Differential
http://www.lifesteps.com/gm.Atoz/ency/white_blood_
cell_count_and_differentil. Retrieved on January 12,
2016.
Partoutomo, S. 2000. Immunosuppression Detection Due
to Infection of Trypanosome evansi and Malnutrition
in Buffalo Animal Experiment with Skin Sensitization.
Journal of Animal Science and Veterinary Vol 5 No.
2: Bogor
Quesenberry, KE and JW Carpenter. 2003. Ferrets,
Rabbits and Rodents: Clinical Medicine and Surgery.
2
nd
ed.Saunders: United States of America.
Reid SA, A. Husein and DB Copeman. 2001. Evaluation
and Improvement of Parasitological Tests for
Trypanosoma evansi Infection. Veterinary
Parasitology 102, 291-297.
Samuelson DA. 2007. Textbook of Veterinary Histology.
Saunders and imprint of Elsevier Inc: China.
ICPS 2018 - 2nd International Conference Postgraduate School
610
