
Correlation between C-Reactive Protein Concentrations and
Erythrocyte Sedimentation Rate in Patients with Positive Widal Test
Citra Yolanda Sari
1
, Budi Santosa
2
and M. Evy Prastiyanto
3
1
Forensic Science, Postgraduate School, Universitas Airlangga, Jl. Airlangga No. 4-6, Surabaya, East Java, Indonesia
2
Laboratory of Clinical Pathology, Faculty of Nursing and Health Sciences, Muhammadiyah Semarang University,
Semarang, Central Java, Indonesia 50272
3
Laboratory of Microbiology, Faculty of Nursing and Health Sciences, Muhammadiyah Semarang University, Semarang,
Central Java, Indonesia 50272
Keywords: CRP, ESR, Patient with positive Widal,
Abstract: Clinical symptomps of typhoid and paratyphoid fever greatly vary, while the gold standard of its laboratory
examination is bacterial culture which commonly takes 3 days for the results. Further tests should be
performed to support diagnosis of this disease. The tests possibly performed to patients with suspected
typhoid are C-Reactive Protein (CRP) and Erythrocyte Sedimentation Rate (ESR). CRP is an acute-phase
protein that is tested to nonspecifically monitor the occurrence of an infection, while ESR is a nonspecific
test for inflammation which is clinically functional for screening inflammatory diseases. The aim of this
study is to determine the correlation between CRP and ESR in patients with positive Widal test. This study
uses correlation analysis to 30 samples which fit inclusion criteria in RS Roemani Muhammadiyah
Semarang and are obtained by purposive sampling. The samples were tested the CRP concentration by
semi-quantitative latex immunoagglutination method and were tested the ESR by westergren method. The
results shows average concentration of CRP was 18.40 mg/L, and average number of ESR was 15.20 mm/h.
Statistical analysis uses in this study is pearson correlation test. A strong and significant correlation between
CRP and ESR in patients with positive Widal with p-value = 0.000 (p < 0.05) and r = 0.886 is obtained.
1 INTRODUCTION
Typhoid and paratyphoid fever are two acute
systemic diseases of digestive tract that remain
global health problems for the world’s populations.
Approximately 21 million cases and 220,000 deaths
were reported per year (WHO, 2014). Typhoid and
paratyphoid fever were found to be endemic in
Indonesia with the incidence rate of 350-810 per
l00,000 population and mortality rate of 0,6-5%
(Kepmenkes, 2006). The cases number of the
diseases varied in different regions, in Semarang for
example, in 2015 there were 9,748 cases reported
(Dinkes, 2015). The data above suggested that
incidence rate of typhoid and paratyphoid fever are
still considered high and an appropriate laboratory
test is required.
The laboratory examination commonly
performed to diagnose the disease is Widal test.
Positive result of Widal test indicates the existence
of specific antibody against component of
Salmonella in human blood. It is quickly performed
but the specificity is less than 50 %. Gold standard
for typhoid and paratyphoid fever is bacterial culture
of Salmonella. However, a three days examination
and facility of clinical microbiology laboratory has
caused the delay of diagnosis (Kepmenkes, 2006),
therefore, certain laboratory tests are considered
necessary to confirm typhoid and paratyphoid fever
in addition to its gold standard as diagnostic
examination.
The other laboratory tests possibly performed in
suspected infections are C-Reactive Protein and
Erythrocyte Sedimentation Rate tests. CRP is acute-
phase protein synthesized by liver as an immune
response to infection, while ESR is a nonspecific
laboratory examination for inflammatory diseases by
determining the rate of fall of erythrocytes to form
sediment in a certain period (Baratawidjaja, 2006;
Bastiansyah, 2008). ESR is much often performed
compared to CRP, because ESR is one of the routine
laboratory examinations for infections, however,
436
Sari, C., Santosa, B. and Prastiyanto, M.
Correlation between C-Reactive Protein Concentrations and Erythrocyte Sedimentation Rate in Patients with Positive Widal Test.
DOI: 10.5220/0007544504360439
In Proceedings of the 2nd International Conference Postgraduate School (ICPS 2018), pages 436-439
ISBN: 978-989-758-348-3
Copyright
c
2018 by SCITEPRESS – Science and Technology Publications, Lda. All rights reserved

there have been some studies proving a correlation
between the two examinations, one of which was
study by Malinda in 2017 showing a strong
correlation between ESR values and CRP
concentrations in patients with suspected lung
tuberculosis with correlation coefficient 0.81
(Rukmana, 2017).
There is an increase of average CRP
concentrations of 43 mg/L in children with positive
result of Salmonella typhi culture, Widal, and
typhidot tests (Choo et al, 2001). There is an
increase of CRP concentrations and ESR values of
53 mg/L and 30 mm/h in typhoid fever patients,
respectively (Idhayu, 2016). There is no report on
correlation between CRP concentrations and ESR
values in patients with positive Widal test referring
to a diagnosis of typhoid or paratyphoid fever.
2 MATERIALS AND METHODS
Materials:
CRP-Latex kit by Glory Diagnostic, Sevilla,
Spain, NaCl 0.9 %, Pipette, Micropipette 50 µl, 200
µl, 1000 µl, Westergren pipette, Westergren stand.
Sample Collections:
Venous blood specimens were collected from
median cubital vein using syringe, blood was
divided into two tubes prior to CRP and ESR
examination. Serum was used for CRP test, while
plasma was used for ESR test. Samples collections
were done in RS. Roemani Muhammadiyah
Semarang starting from July until August 2017,
totaling 30.
2.1 CRP Test by Semi-quantitative
Latex Immunoagglutination
CRP concentrations were measured through several
steps including CRP qualitative test and quantitative
test using CRP latex kit. Fifty microllitres of positive
control, negative control, and patient’s blood were
added into the well of CRP test-slide. One drop of
CRP-latex reagent was added into the slide and then
homogenized. Agglutination was examined within 2
minutes. If there is visible agglutination that shows
positive result, when the result was positive, further
measurement should be done using semi-quantitative
test. A five serial dilutions of 50 µl of NaCl 0.9 %
and 50 µl of patient’s serum were done in each well
of CRP test-slide until the six circles on slide. One
drop of CRP-latex reagent was added, the slide was
homogenized, and visible agglutination was
examined within 2 minutes. Dilution factor used was
6 mg/L.
2.2 ESR Test by Westergren method
ESR test used westergren pipette, westergren stand,
and NaCl 0.9 % solution. EDTA blood samples were
diluted using NaCl 0.9 % solution with ratio of 1:4.
The diluted samples were homogenized in a tube
and incubated for one hour at room temperature. The
result was recorded within one hour. After 1 hour,
the result was noted.
The mean and standard deviation of CRP and
ESR values were statistically analyzed. Correlation
between CRP concentrations and ESR in patients
with positive Widal test was done by Pearson test
analysis.
3 RESULTS AND DISCUSSION
The average of CRP concentration in 30 patients
with positive Widal test was 18.40 mg/l. The lowest
CRP concentration was 6 mg/l, and the highest was
48 mg/l. The average of ESR value in 30 patients
with positif Widal result was 15.20 mm/h. The
lowest ESR value was 3 mm/h, while the highest
was 30 mm/h (Table 1).
Table 1: Frequency Distribution of CRP Concentrations
and ESR Values in Patients with Positive Widal.
Variable
Sample
Average
SD
Min-Max
CRP
30
18.40
11.245
6-48
LED
30
15.20
6.289
3-30
SD : Standard Deviation
The comparison between CRP concentrations
and ESR values in patients with positive Widal test
showed a tendency of ESR values to increase
following the increasing of CRP concentration levels
(Figure 1).
Correlation between C-Reactive Protein Concentrations and Erythrocyte Sedimentation Rate in Patients with Positive Widal Test
437
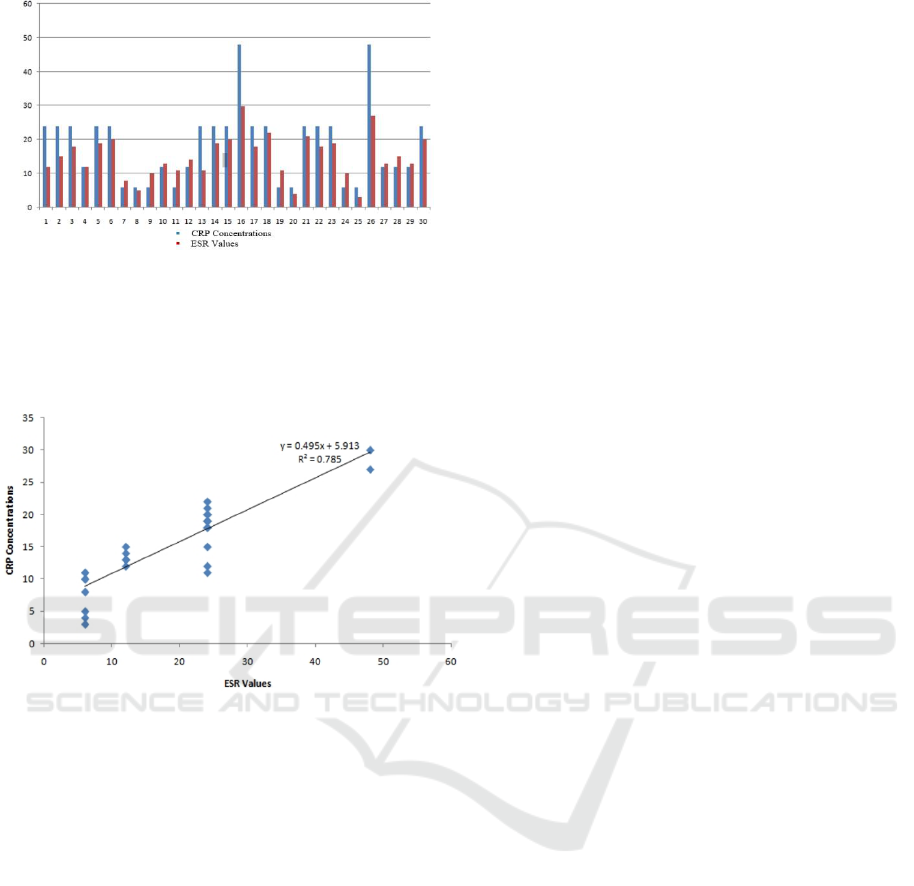
Figure 1: Comparison between CRP Concentrations and
ESR Values of Patients with Positive Widal Results.
Relationship between CRP concentrations and
ESR values of patients with positive Widal test was
shown in a scatter diagram below.
Figure 2: Results of Relationship between CRP
Concentrations and ESR Values in Patients with Positive
Widal.
Results of Pearson correlation analysis showed
that correlation coefficient or r = 0.886 suggesting a
strong correlation between CRP concentrations and
ESR values, whereas value of p= 0.000 (p≤0.005)
showed significant correlation between CRP
concentrations and ESR values, suggesting a
significant and strong correlation between CRP
concentrations and ESR values in patients with
positive Widal test. The scatter diagram showed
gradient of a straight line going upword, indicated
that there was tendency of increasing ESR values
following an increase of CRP concentrations.
Pearson correlation analysis showed that
correlation value of 0.886 with p value 0.000 was
obtained, suggesting a strong and significant
correlation between CRP concentrations and ESR
values in patients with positive Widal test. The result
suggested that a tendency of ESR values to increase
following the increasing of CRP concentrations.
The results of this study were relevant with
Malinda (2017) on correlation between ESR values
and CRP concentrations in patients suspected with
lung Tuberculosis, proved a strong correlation
between ESR values and CRP concentrations in
patients with suspected lung tuberculosis, with r =
0.81 (Rukmana, 2017). In addition, this study is also
relevant with research by Widarti in 2014 showed a
meaningful correlation between ESR values and
CRP concentrations in patients suspected with lung
tuberculosiswith r = 0.889 (Widarti, 2014).
During infection, bacterial products such as
Lipopolysaccharide (LPS) activated macrophage and
other cells to release various cytokines such as
Interleukin 1, Interleukin 6, Interleukin 8, And TNF
as non-spesific immune response to bacterial
antigens. These cytokines stimulated liver to
synthesize and release some plasma protein called
acute-phase protein, such as C-Reactive Protein,
Mannan Binding Lectin (MBL), seruloplastin, and
fibrinogen (Longo and Fauci, 2013; Baratawidjaja,
2006).
Study by Amal et al in 2012 about effect of
typhoid fever to cytokines (Interleukin 6 and 8) and
C-Reactive Protein showed a significant increase of
the average Il-6, Il-8, and CRP as much as 153
pg/ml, 131 pg/ml, and 37.2 mg/l, respectively (Ali,et
al 2012).
The increasing CRP concentrations in blood
caused the increase of plasma viscosity. It led to a
decrease of potential zeta, a repulsive force among
erythrocytes, allowing the formation of rouleaux and
faster sedimentation of erythrocytes. The increase of
ESR values are not only influenced by the increase
of CRP concentrations, but also possibly influenced
by erythrocyte factors and other acute-phase proteins
like fibrinogen. During infection, the other acute-
phase proteins are also increased although it does
not occur prior to the increase of CRP
concentrations. However, the other acute-phase
proteins also caused plasma viscosity and increased
the ESR values (Kiswari, 2014).
4 CONCLUSIONS
The conclusion of this study obtains the average
CRP concentration from 30 patients with positive
Widal test is 18.40 mg/l. The lowest CRP
concentration is 6 mg/l, and the highest is 48 mg/l.
The average ESR value from 30 patients with
positive Widal result is 15.20 mm/h. The lowest
ESR value is 3 mm/h, while the highest is 30 mm/h.
A strong and significant correlation between CRP
ICPS 2018 - 2nd International Conference Postgraduate School
438

and ESR in patients with positive Widal with p-
value p < 0.05 and r = 0.886 is obtained.
ACKNOWLEDGEMENTS
Researchers would like to show gratitude to family,
especially to parents for their endless support.
REFERENCES
Ali, A. H., Saleh, E. S., Keetani, A. A., Joodi, K. K., 2012.
‘The effect of Typhoid Fever on Cytokines
(Interleukin 6 and 8) and C-Reactive Protein
Concentration’. Journal of Advanced Medical
Research, vol. 1, no 1, pp. 114-122.
Baratawidjaja, Karnen G., 2006. Imunologi Dasar Edisi ke
7. Balai Penerbit FKUI. Jakarta.
Bastiansyah, E., 2008. Panduan Lengkap Membaca Hasil
Tes Kesehatan. Penebar Plus. Jakarta.
Choo, K.E., David, T.M.E., Henry, R.L., Chan L.P., 2001.
‘Serum CRP Concentrations in Malaysian Children
with Enteric Fever’. Journal of Tropical Pediatrics,
vol. 47, pp. 211–214.
Dinkes, 2015. Profil Kesehatan kota Semarang 2015.
Dinas Kesehatan, Semarang.
Idhayu, Adeputri T, 2016. ‘Perbedaan Kadar CRP pada
Demam Akut Karena Infeksi Dengue dan Demam
Tifoid’. Jurnal Penyakit Dalam Indonesia, vol.3, no.
3, pp. 138-42.
Kiswari, Rukmana, 2014. Hematologi & Transfusi.
Erlangga. Jakarta.
Longo, D. L., Fauci, A.S., 2013. Harrison:
Gastroenterology & Hepatology. EGC.
Menteri Kesehatan Republik Indonesia. 2006. Pedoman
Pengendalian Demam Tifoid. KEPMENKES No
364/MENKES/SK/V/2006. Kementerian Kesehatan
RI. Jakarta.
Rukmana, Malinda S.M., 2017.’Hubungan Nilai Laju
Endap Darah dengan CRP Pada Tersangka
Tuberkulosis Paru’. Repository Poltekkes Bandung.
Widarti, 2014. ‘Analisis Hubungan Hasil Pemeriksaan
Laju Endap Darah (LED) Dan Hasil Pemeriksaan C-
Reactive Protein (CRP) Pada Penderita Tuberkulosis
Paru’. Program Studi D3 Analis Kesehatan Politeknik
Kesehatan Makassar, Vol v, no. 2.
WHO, 2014. Immunization, Vaccines, and Biologicals;
Typhoid, media release, 15 April, WHO Vaccines and
Diseases.
Correlation between C-Reactive Protein Concentrations and Erythrocyte Sedimentation Rate in Patients with Positive Widal Test
439
