
Measuring Runout Value of Sliding Door Using Combination Method
of Laser and Machine Vision
Qi Chen
1
, Liming Wu
1
, Ya’nan Zhao
1
, Chao Xu
2
and Yonggen Xu
2
1School of Electromechanical Engineering,Guangdong University of Technology, Guangzhou, China
2Zhongshan OPK Hardware products Co., Ltd, Zhongshan Xiaolan, China
Keywords: Measuring runout value of sliding door, Laser measurement, Machine vision measurement, nonlinear
optimization.
Abstract: In order to solve the problem of low automation in the original measurement of sliding door run out value, a
method of using a servo motor to replace the manual sliding door is proposed at first, then give an analysis
about the error source of laser measurement when the run out value is large, and a measurement method of
the run out value of the sliding door based on machine vision is designed. The method estimate the ROI of
every frame by calculating of the motor speed at first, then use image processing to process the run out
video, and the position of the marker is finally gotten. The measurement results of the laser displacement
sensor are used to optimize the visual measurement results, and Gauss-Newton is used to solve the nonlinear
least squares problem. Experimental results show that this method can effectively improve the overall
accuracy in visual measurement.
1 INTRODUCTION
The damping system of the pulley is an important
part of the sliding door. Because the ordinary sliding
door does not have a damping system installed, the
door will have a strong collision with the door frame
at the moment of closing, which not only destroys
the structure of the door frame, but also creates
environmental noise and affects people's quality of
life. Instead, elegant sliding doors are installed with
the damping system on the door rail, which can
effectively avoid this problem. The door will
experience a buffering time of 2-5s before fully
closing. However, the performance of the damping
system will also directly affect the user's sliding
door experience. When the sliding door contacts
with the damping system, it will be affected by the
force which make it generate a run out in the vertical
direction, and the value of run out is not only
affected by the installation quality of the sliding
door fittings but also the speed of door movement
and the structure of the damper pulley system. If the
value of jump is too large, not only will it reduce the
comfort when using the sliding door and increase the
noise of the sliding door, but it will also cause the
door to fall off from the track.
Obviously, the measurement of the run out value
of the sliding door has become a key step in the
testing of the damping system. Analysis of the run
out curve can not only verify the product's
conformity, but also can reflect the defects in the
structural design of the damping system. In this
paper, according to the existing test methods, the
servo motor is used instead of the manual sliding
door, after analysing the inevitable error of the laser
measurement method in the test process , a vision-
based runout measurement method is proposed, and
the laser sensor is used for correcting the result
which can reduces the overall measurement error.
2 SLIDING DOOR TEST FRAME
The sliding door run out test is tested on the test
frame. The traditional test frame consists of a door
frame, a track, a sliding door, and a damping system.
After being installed with the matching damping
system, when the sliding door is closed to a certain
distance, it will be subject to a buffering effect of
damping, so that the sliding door will automatically

and slowly close in the closing direction. Due to the
different mechanical structures of the dampers, some
dampers will cause the door to jump slightly in the
vertical direction while allowing the sliding door to
close slowly. The value of run out is also related to
the weight of the door itself. The smaller the weight,
the greater the run out value.
The traditional testing framework itself does not
have the power to move the door. It requires people
to push the door manually. The manual method of
sliding the door is closer to the actual use, but the
long-time test can easily cause fatigue to the
operator (Xu Xianzhe, 2015). That will cause the
intensity and speed of pushing the door cannot be
accurately grasped. And the manual push door test
method has uncertainty in the direction of the push
door. If the force of the push door is not horizontal,
it will generate extra displacement in the vertical
direction.
In order to solve this problem, the sliding door
frame was reconstructed and servo motor with
conveyor belt was used to control the movement of
the door. In this method, the position, speed,
acceleration and test times of the door movement
could be set to achieve automatic testing, which
greatly reduced the workload of testers. Use this
method to push the sliding door can only produce a
horizontal speed and ensuring that the moving door
is in the horizontal direction before the run out
occurs.
3 ANALYSIS THE ERROR OF
LASER MEASUREMENT
The run out value of the sliding door refers to the
moving distance of the door in the vertical direction
during the movement. The jumping usually occurs at
the moment of contact with the damping system, and
the whole process is about 200 ms. The traditional
method is to use the laser sensor to measure the
displacement in real time. The laser sensor has the
advantages of high precision, fast response and non-
contact measurement, and the measurement
frequency can reach 50-100 Hz(Sun Bin,2015). The
method is to install the laser sensor on the sliding
door when the door is not moving, and record the
distance from the sensor to the door frame at this
time. This distance is defined as the base reference
value. In the test process, the actual run out value is
equal to the measured value minus the base
reference value:
(1)
Note that the sensor observation value is , C1
is the base reference value of the sensor before the
start of the test, and is the theoretical jump
distance.
This measurement method can accurately
measure the run out value of the moving door
without considering the tilt angle of the jump.
However, when the door is jumping, it must be one
end jumping and the other end is in the original
posture. This will cause the tilt angle is not equal to
0 at the jumping moment, as shown in the figure:
Figure 1: Tilted laser sensor.
When there is a certain tilt angle between the
sensor and the test frame, the observation value of
the laser sensor is no longer the shortest distance AC
from the test frame. Instead, the result is tilted by .
Obviously, the actual run out value should be:
(2)
is the actual run-out distance. Since the laser
sensor cannot measure the tilt angle , the
measurement error of the laser method is:
(3)
As can be seen from equation, the measurement
error of the laser measurement method is affected by
the run out observation value and the magnitude of
the tilt angle, and when the run out value and the tilt
angle are small, high-precision measurement results
can be obtained. With the increase of the tilt angle,
the error will be gradually enlarged. In this regard,
there is an urgent need to design a measurement
method capable of observing from a global
perspective so that the accuracy of the observation
results will not be affected by the position of the
sliding door.
4 DETECTION BASED ON
MACHINE VISION
The advantage of machine vision-based run out
detection is that the camera sensor can observe the
run out value from a global perspective. The position
of the sensor during the observation process is not
affected by the movement of the sliding door.
The camera is mounted on the top right of the
test frame where the jump occurs. A square red
marker with a side of 10 mm is pasted on the sliding
door and let the edge of the marker is parallel to the
sliding door frame.
Figure2: Test Frame with Camera and Marker.
4.1 Camera Calibration
Camera calibration is a key step in the process of
obtaining three-dimensional information using the
two-dimensional plane image information of the
object (Xu Chao,2017). The camera calibration is to
obtain the camera's own structural parameters and
camera pose. In the visual inspection system, the
accuracy of the calibration directly affects the
accuracy of the measurement results. Different
inspection requirements require different calibration
methods.
Realizing the three-dimensional point in the real
world and the two-dimensional transformation in the
image requires the use of four coordinate systems:
world coordinate system, camera coordinate system,
image coordinate system and pixel coordinate
system (Li Xin,2017). The world coordinates are the
reference coordinates of the spatial position. The
camera coordinates are based on the lens optical
center and the optical axis direction is the z-axis.
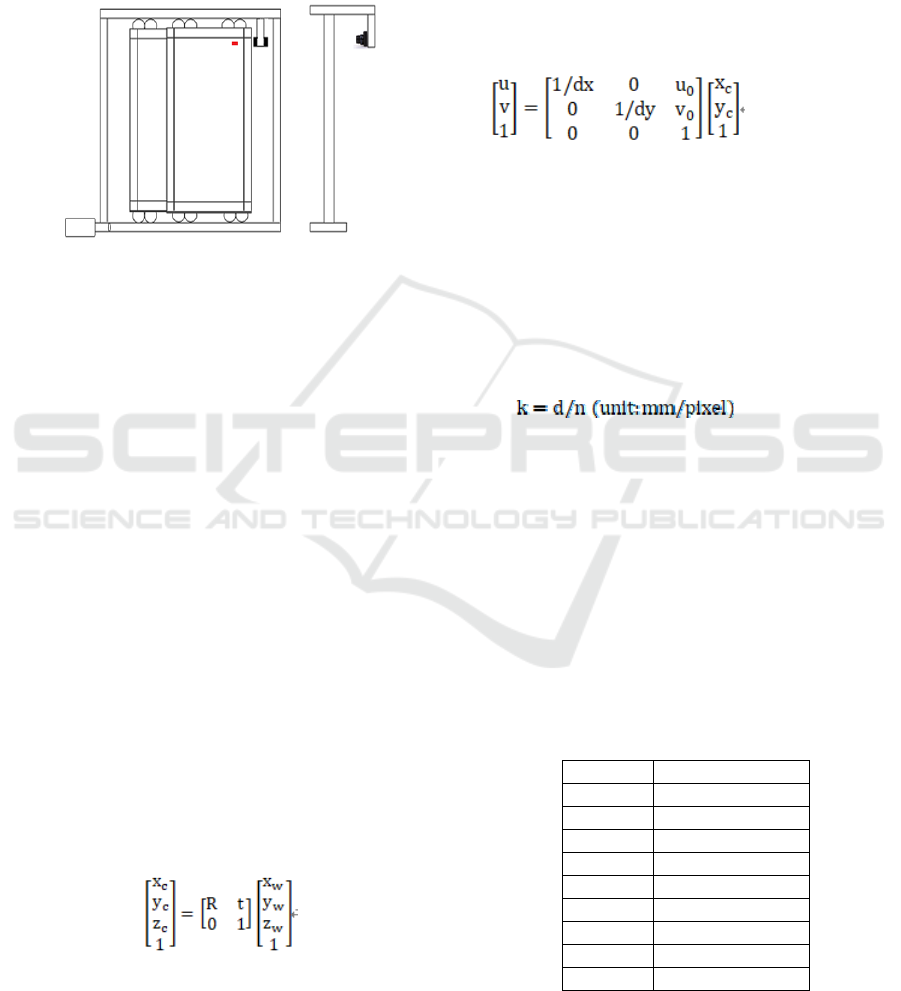
The formula from the world coordinate to the
camera coordinate is:
(4)
R is a 3x3 rotation matrix, which represents the
rotation of the camera coordinates to world
coordinates, and t is a 3x1 translation vector.
The image coordinate system refers to the two-
dimensional coordinate system established on the
image with the camera optical center as the origin,
and the unit of the coordinate axis is the physical
size of the actual pixel. The pixel coordinates are the
coordinate system established with the upper left
corner of the image as the origin of coordinates. The
unit of the pixel coordinate axis is the pixel. The
conversion from the image coordinate system to the
pixel coordinate system can be expressed as:
(5)
To detect the amount of run out value, we only
need to calculate the proportional relationship
between the unit pixel and the actual length. This
paper selects the checkerboard calibration board as
the reference object, first determines the physical
dimension d (unit: mm)of the calibration board, and
calculates the number of pixels n(unit: pixel) of the
checker boxin the image is acquired, then the
proportional coefficient (Gong Cong,2014):
(6)
In order to improve the camera calibration
accuracy and eliminate the impact of the camera lens
distortion, the calibration board needs to be
photographed at different angles, and then take the
average of these calibration results as the final
calibration result. In this paper, the resolution of the
camera is 1024*960, 9*9, checkerboard calibration
board with 4mm grid length is used for calibration,
and 9 pictures of different angles are taken on the
calibration board. The measurement results are as
follows:
Table 1:Camera calibration results.
times Pixel number
1 128.0212
2 129.0043
3 128
4 129
5 128.0089
6 129.0012
7 129.0318
8 128.0724
9 128.0416
The average value is 128.4646 and the
proportional coefficient k=0.0311 mm/pixel.
4.2 Runout Displacement
Measurement
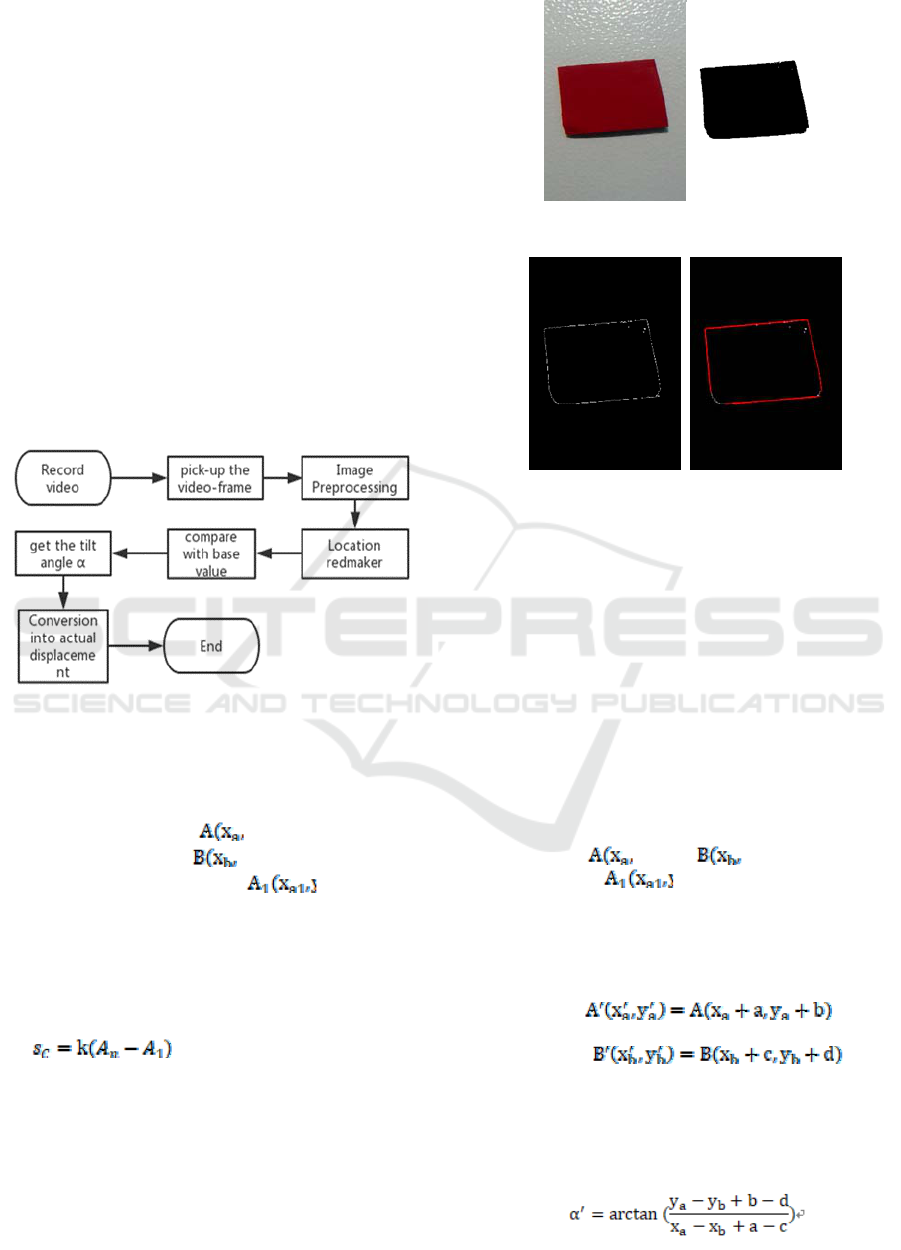
After the test video is recorded, images are extracted
frame by frame for processing. The first is the image
preprocessing. In order to reduce the image
processing time, the image needs to be extracted
from the region of interest (Qiu Zhicheng, 2012).
Because the servo motor is used to control the
sliding door, the approximate position of the marker
at a certain moment can be calculated according to
the speed, and then converts it to image coordinates
and intercepts the image. As shown in the figure, the
color of the marker and the color of the door are
significantly different. After the grayscale
transformation and binarization of the image, the
background is filtered from the image, and use the
canny edge detection to extract the edges of the
marker.
Figure 3: Visual Measurement Process.
Then use the Hough transformation to detect line
segment to locate the coordinates of the four edges
of the marker, and note that the endpoint in the
upper right corner is
and the endpoint in the
upper left corner is
. Before the start of the
test, the reference value
is measured
using this method. In the following frames, - can
be used to obtain the vertical pixel of the jumping
gate, and and coordinates can be used to find
the runout tilt angle α. As we can see from the
formula:
(7)
You can calculate the actual runout value of the
sliding door.
Figure 4: ROI and Binary image.
Figure 5: Canny and Hough Change.
5 OPTIMIZE MEASUREMENT
RESULTS
Among the above two measurement methods, the
displacement measurement accuracy of the laser
displacement sensor is higher, reaching 0.01mm,
repeatability 15um, and the error mainly comes from
the tilt angle α in the test process, and the laser
sensor tilt angle αcannot be measured by itself. In
the detection of runout using machine vision, we can
get both the runout value and the tilt angle by using
the points
and and the reference
coordinates
. However, because of
camera noise in the actual measurement process, our
measurement results will inevitably have errors, that
is, the coordinates of A and B may actually have a
certain offset:
(8)
(9)
Here, a, b, c, d are the offsets of the new
coordinate point on the original coordinate point.
The angle and the new runout value calculated from
the new coordinate are:
(10)
(11)
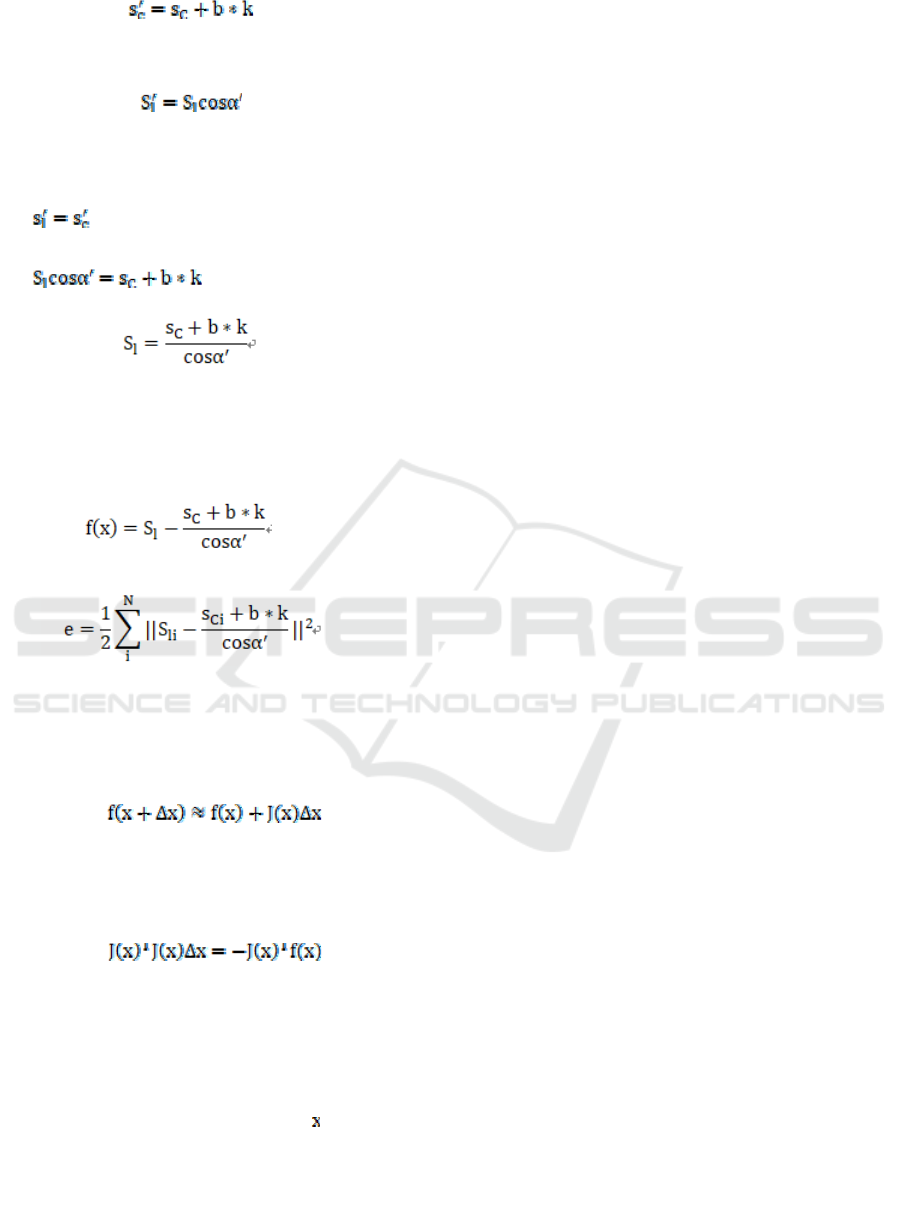
Substituting the obtained into Equation 1:
(12)
It is not difficult to know that both S
1
and
S
C
indicate the actual run out value. Ideally there
are:
(13)
(14)
(15)
Due to the presence of noise, a, b, c, d are not
always equal to zero. The above formula cannot be
established, defining the error function:
(16)
(17)
Here N is the total number of video frames. It
can be seen that this is a non-linear optimization
problem that can be linearized by performing a first-
order Taylor expansion:
(18)
Substitute the linearized f(x) into (17).Then
calculates the derivative of and let it equals to
zero.
(19)
x is a 4x1 vector [a,b,c,d]T, the Gauss-Newton
method is used to find the optimal offset. The
solution is(Li Bo,2015):
(1) Given a preliminary test value
(2) Calculate iteration step size
(3) Update iterative value =
+
(4) The result of the calculation. If e is small
enough, is output, otherwise, step 2 is returned.
This article uses a small weight sliding door to
test, the purpose is to make the tilt angle and runout
value more obvious. After testing 10 times, 50 sets
of laser sensor data synchronized with time stamp
and 50 frames were obtained. After using Google
ceres library for optimization, after 8 iterations, the
value of the error function was decreased from
0.1118 to 0.0421. The optimal values of a, b, c, and
d are 1.2622, -3.6903, -1.2622, and -3.9108.
6 CONCLUSIONS
Aiming at the problem that the method of laser
measurement has obvious errors when the runout
value and tilt angle are large, a detection method
based on machine vision is proposed. The
measurement result of the laser sensor is used to
correct the visual measurement result and a
nonlinear optimization problemis constructed, then
use Gaussian Newton method to solve the
optimization variables. The experimental results
show that, given the initial value of 0,0,0,0, the
Gauss Newton method can iterate the optimal offset
with fewer iterations, and the optimization error
decreases from 0.1118 to 0.0421, which effectively
improve the overall accuracy in visual measurement.
ACKNOWLEDGEMENTS
This work was supported by the Science and
Technology Planning Project of Guangdong
Province (no.2017A090905047), Science and
Technology Planning Project of
Guangzhou(no.201806010128) and A New
Generation of Intelligent Large-Scale Carton
Printing Equipment Package Development and
Industrialization. Thanks for the helps.
REFERENCES
1. Sun Bin, Lin Bing, 2015. A quantitative error
compensation model of the inclination angle of the
laser displacement sensor. Chinese Journal of
Scientific Instrument 36(05):996-1004.
2. Xu Xianze, Liang Chu, 2015. Design of circular
runout detecting system of automobile transmission
shaft based on ARM. Engineering Journal of Wuhan
University 48(2):234-238.
3. Xu Chao, Zhang Yifan, Han Xiaoming, Deng Jianjun,
2017. Machine Vision Based Vibration Displacement
Measurement of Large Flexible Structures.Journal of
Vibration, Measurement and Diagnosis37(04):781-
786+846.

4. Li Xin, Wu Liming, WangGuitang,Xiong Feng, Chen
Yujun, 2017. Image Mosaic Method for Large Size
Component Vision Measurement Based on
Homography Matrix. Computer Measurement and
Control 25(11):26-29+33.
5. Qiu Zhicheng, Zhang Xiangtong, 2012. Vision-Based
Vibration Measurement and Control of Flexible
Structure.Journal of Vibration, Measurement and
Diagnosis 32(01):11-16+157-158.
6. Gong Cong, 2014. The Method and Realization of
High-Precision Size Measurement Based on Machine
Vision.Guangdong University of Technology.
7. Li Bo,Chen Yan, Zhou Xiangjun, 2015.Accurate
recognition of work-pieces based on Gauss-Newton
image registration.Optics and Precision Engineering.
