
Reassessing the Carbon Kuznets Curve: Panel Data Model Analysis
for Prefecture-level Cities in China
Yanhong Li
1
1
North China Electric Power University, Baoding, Hebei, China
Keywords: Carbon emission; Carbon Kuznets curve; Co-integration test; Prefecture-level Cities.
Abstract: This article is based on Environmental Kuznets Curve, and analyzes the relationship between carbon
Emissions and Economic Growth in prefectural cities in China by using Panel Data Model. Variable time
span is 14 years. Cross-section covers more than 200 prefecture-level cities .It shows that with the
development of economic, carbon emissions are on the rise. The carbon Kuznets curve presents a curve with
an upper right slant. Inverse U-shaped relationship is not obvious or the inflection point is not reached .This
shows that passively waiting for economic growth to improve the quality of environment does not meet
China’s development model, and coordinated development of economic growth and quality of environment
is the fundamental way for China’s sustainable development.
1 INTRODUCTION
Carbon emission is the main reason that leads to the
global warming. Controlling emission has become
an important issue,for it’s about the interests of
people all over the world According to World
Development Report 2010: Development And
Climate Change published by World Bank. From
Industrial Revolution to now, the average
temperature of the world has risen by 1 degree.
What’s worse, in a decade of the 1980s, the
temperature rose by 0.48 degree from 100 yearsago.
As global temperature rises, there are lots of
disasters which have bad impact on the survival and
development of human. With the rapid development
of China’s economic, reliance on fossil fuels grows
in multiples. According to World Energy Outlook
2007 published by International Energy Agency, the
average rate of carbon emissions in China is 4.2%
which ranks first in the world. China is under great
pressure from domestic and international carbon
emission reduction. To balance the development of
economic and carbon emission is an important issue
for China’s current economic development. In 2015,
China Fragrance “Joint International Framework
Convention on Climate Change” Secretariat
submitted Strengthening Actions to Address Climate
Change-China’s national Independent Contribution.
It sets a goal for carbon emission, by 2030 China’s
carbon emissions per unit of GDP fell 60% to 65%
from 2005. In addition, to achieve the goals of
sustainable energy development and non-fossil
energy accounts for 20% of primary energy .
China’s per capita carbon emissions are lower
than that in developed countries such as the United
States, poor energy technology leads to energy
utilization and higher carbon emissions per unit of
GDP.As we all known, economics growth leads to
increased carbon emissions. If we take unreasonably
measures to control carbon emissions, it is true that
it will do harm to the development of the economic.
China will take economic development as its top
priority for a long time; therefore, it is not a wise
idea for a developing country like China to give up
the development of economic in order to protect the
environment. From the perspective of the
development of economic in other countries, the
rapid economic growth while low-carbon emission
development modal; does not exist, according to the
theory of the development of Environmental
Kuznets Curve in Environmental Economics, The
law “First pollution, after treatment” is summarized
by developed countries which is not suitable for
developing countries.
This article takes the environmental Kuznets
curve as the research perspective, collect the panel
data model and create panel data for each region
spanning more than 20 years, through empirical
analysis to find the relationship between the

development of economic and carbon emissions in
China. To have a comprehensive discussion of the
form of the Kuznets curve in various regions of
China according to panel data modal so that it can
provide theoretical support for the promotion of
building an environmentally friendly society.
2 REGRESSION RESULTS
ANALYSISOF PANEL DATA
MODEL
2.1 Panel Data Analysis Between
Energy Consumption and
Economic Growth
The theory of CKC is a great method to study the
relationship between carbon emissions and
economic growth. Main through regression analysis
to verify whether there is an inverted U shaped
relationship between economic growth and carbon
emissions and decoupling theory to analyze the
relationship between them. In 2008 Wagner studied
the relationship between carbon emissions and GDP
per capita and proved that CKC is also an inverted U
shape. The general expression of CKC is: C=
f(G,G
,G
,W), C stands for environmental quality
and it usually measured by indicators of carbon
emissions. The formula of panel data model is:
C
=α
+α
G
+α
G
+α
G
+α
W
+ε
(1)
And α
is the model parameter, the relationship
between environment and economic growth can be
reflected by the parameter value.
If α
>0,α
=0,α
=0 , there is a
monotonically increasing positive correlation
between carbon emissions and economic growth. In
other words carbon emissions increase with
economic growth, there will be no turning point of
carbon emission reduction.
If α
>0,α
<0,α
=0, at this point, there is
an inverted U-shaped curve between carbon
emissions and economic growth, carbon emissions
increase first and then decrease as the economic
grows.
If α
<0,α
>0,α
=0, CKC curve is U
shaped ,with the development of economic, carbon
emissions first decrease and then increase.
If α
>0,α
<0,α
>0, the curve is N shaped.
It shows that carbon emissions first increase and
then decrease and then increase again as the
economic grows.
If α
<0,α
>0,α
<0, the curve is inverted
N-shaped. It shows that carbon emissions first
decrease and then increase and then decrease as the
economic grows.
In my perspective, the EKC curve is based on the
analysis of the industrialization process in the
developed countries and its inverted U pattern
mainly reflects the law of economic growth in
developed countries as a function of the
environmental quality .However the developing
world in different developing countries is different
.The development path of developing countries is
different from the analysis of the industrialization
process of developed countries. Developing
countries will not wait for the natural improvement
of the environment and will therefore intervene early
in the process of industrialization .These factors
have an impact on the morphology of the EKC curve
.So whether the inverted U shaped of the
environmental Kuznets curve in developing
countries needs to be verified in more sophisticated
data fitting. Due to data limitations most of the
literature is mainly limited to national or provincial
data and the information obtained is limited.
This article will use data from various regions of
China on carbon emissions and economic growth to
fit the shape of the EKC curve. Since regional-level
data contains more relevant information on
environmental and economic growth the fitting
effect is more convincing.
2.2 Reassessing the Carbon Kuznets
Curve
Because the carbon emissions in prefecture level
cities cannot be obtained directly and the differences
between energy consumption structure and
production technology in the same period in the
same province are small, we use the percentage of
the prefectural city GDP in the province as a weight.
Estimating carbon emissions of prefecture level
cities through the provincial carbon emissions. This
article uses the carbon emission panel date of
prefecture level cities from 2013 to 2016. According
to 《China City Statistical Yearbook》covers 283
prefecture level cities , however, in some western
regions , some key date are missing . The final panel
date covers 251 prefecture level cities. We use the
following regression model because most studies use
quadratic curve to fit the EKC:
plc
= α
IC
+α
IC
+α
FAI
+α
IS
+δ
+φ
+
ε
(2)
The subscript ‘it’ represents the index of the t-
th year of the i-th prefecture level city, α represents
the corresponding regression coefficient, PICit
represents the carbon emissions of the t-th year of
the i-th prefecture level city, ICit represents the per
capita GDP, the date use the GDP of prefecture level
city divided by the total population at the end of a
year and adjusted the price index based on 2003.
FAIit represents fixed asset investment of the t-th
year of different regions, ISit represents the
industrial structure of the t-th year of different
regions, φi represents regional fixed effect variable,
δt represents fixed time effect variable. This article
uses a variable that lags by one period as a tool
variable to conduct model estimation because there
are certain entophytes in the model’s explanatory
variables GDP and fixed assets investment
indicators.
LM =
()
∑
∑
́
∑∑
−1
(3)
H=
(
)
(
)
~χ
(k) (4)
Through the Hausman and LM tests, the results
show that fixed effect model is better, and the
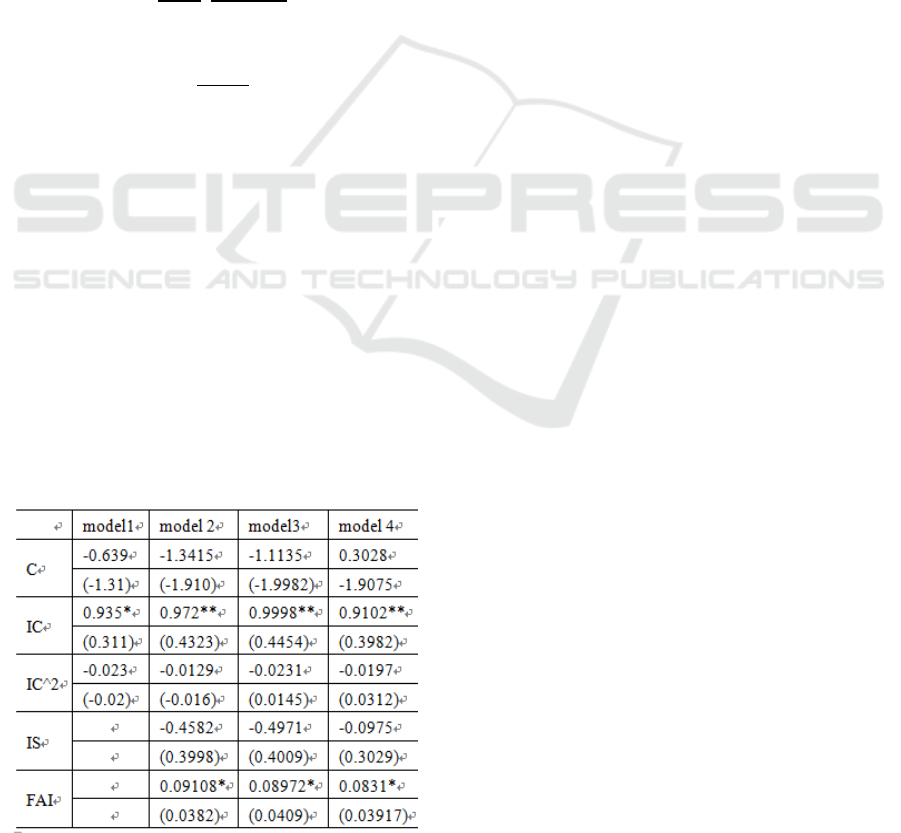
specific regression results are shown in the table 1.
Model 1 just see per capita GDP and its
quadratic term as explanatory variables, the result
shows that at the 1 % level of significance, the
coefficient of one term is obviously a positive value,
the coefficient of quadratic term is not obvious. This
indicates that when the model does not include other
explanatory variables, the relationship between
carbon emission and economic growth is linear
relationship. With economic growth, carbon
emission is also growing. CKC curve is a straight
line that leans toward upper right.
Table 1 Regression results of panel date.
Note: ‘*’ means the significance level is 5%.
‘**’ means the significance level is 1%.
Model 2 adds the influence of fixed assets
investment and industrial structure, regression result
shows that carbon emission and economic growth
still take on positive linear correlation. The influence
of fixed assets investment on the carbon emission
will show some continuity, therefore, in order to
solve the sequence related problems in the model,
the model evolved into the form of model 3, that is,
fixed assets investment will lag one phase before
participating in regression. The quadratic coefficient
is still not obvious at this time; the coefficient of one
term is a positive value. Further consideration of the
problem of mutual cause and effect between carbon
emission and per capita GDP, therefore, model 4
uses the date on per capita GDP which lags one
phase, the result still indicate a positive linear
relationship between the two variables. A
comprehensive analysis of these four models, the
relationship between carbon emission and economic
growth is monotone increasing; indicating that they
are linear relationship or they are in the ascending
phase of an inverted u-shaped curve with the
inflection point has not yet appeared.
In the model, the percentage of secondary
industry in explanatory variable is not significant,
mainly because when these models were established,
author used various type of primary energy
consumption to calculate carbon emission, but
carbon emission from the primary and tertiary
industries mainly occur during the production of the
products that people used, mainly because of the use
of electric energy, so carbon emission actually
happens in the secondary industry. So, industrial
structure cannot influence the carbon emission in the
prefecture level city obviously. Besides, the impact
of fixed asset investment on carbon emissions in
prefecture level cities is obviously positive and it has
a lasting influence in the future.
In summary, there is a positive linear correlation
between carbon emission in prefecture level cities
and economic growth; it can also be explained as the
inflection point of inverted u-shaped curve has not
appeared. But CKC curve means that we cannot
simply expect economic growth to the inflection
point so that the environmental quality in China can
be improved naturally, we should take the initiative
to improve the environment, improve the efficiency
of energy using, and reduce carbon emission.

3 CONCLUSIONS AND POLICY
RECOMMENDATIONS
Traditional library environmental Kuznets curve
shows that, with the growing of economy, the
carbon emission will first increase and then
decrease. Associated with economic growth, the
change of environmental quality will improve
gradually. But traditional EKC curve is according to
the experience of the developed country
industrialization, so the trend of developing
countries is not applicable. Developing countries
with the advantage of backwardness can draw
lessons from experiences and lessons in the process
of industrialization in developed countries, and take
measures to control environmental quality
management.
According to the district cities more than 20
years of data, this paper draws a conclusion that the
relationship between carbon emissions and
economic growth mainly appears a sloping straight
line, so the Kuznets Curve is not an inverted U
curve. This means that the carbon emissions control
problem and environment problem in economic
growth cannot be solved automatically. After
pollution then management way is not suitable for
our country's development present situation; we
should take active measures, reasonably control
energy consumption, and improve the efficiency of
energy utilization.
REFERENCES
1. Brajer, V.R. Mead and F. Xiao. 2011. Searching for an
Environmental Kuznets Curve in China’s Air
Pollution, China Economic Review, 22(3): 383-397.
2. Galeotti M, Lanza A, Pauli F. 2006. Reassessing the
environmental Kuznets Curve for CO2 emissions: a
robustness exercise, Ecological Economics, 57: 152-
163.
3. Harbaugh, W., A. Levinson and D. Wilson. 2002.
Reexamining the Empirical Evidence for an
Environmental Kuznets Curve, Review of Economics
and Statistics, 84(3): 541-551.
4. Jalil, A., S. F. Mahmud. 2009. Environment Kuznets
Curve for CO2 Emissions: A Co-integration Analysis
for China, Energy Policy, 37(12): 5167-5172.
5. Yang G.Y. Econometric analysis of the relationship
between carbon emission and economic growth in
Anhui province. [J] Statistics and Decision 2012, 17:
106-109.
6. Zhang B, Chen GQ. Methane emissions in China
2007, Renew Sustain Energy Rev [M] 2014, 30: 886-
901.
