
Research on Access Speed of the Stereo Garage Based on Queuing
Theory
Xianglei Zhu
1a
, Shuang Lv
1b
and Jian Meng
1c
1
China Automotive Technology & Research Center,300300 Tianjin, China
Keywords: Stereo garage; Queuing theory; M/M/S; Access speed;
Abstract: With the contradiction between urban parking problems, three-dimensional garage is an effective way to
alleviate the problem of urban parking difficult, but due to the current three-dimensional garage planning
unreasonable problems, some three-dimensional garage access inefficient, three-dimensional garage
construction after the use of low and serious of the waste of resources, so the rational optimization of three-
dimensional garage vehicle access speed is particularly important. Based on the theory of queuing theory,
this paper presents a method to optimize the speed of vehicle access. Firstly, the paper analyzes the factors
influencing the access scale of the three-dimensional garage and determines the index of the access speed of
the three-dimensional garage. Then, based on the theory of queuing theory, the three-dimensional garage
access is determined and the M / M / S, The Model of Stacker with Tendency Selectivity Coefficient. And
constructs the optimization model in consideration of the tolerance of different customers. Finally, an
optimization method for improving the access speed of three-dimensional garage is proposed by selecting
different stacker and different speed calculation.
1 INTRODUCTION
At present, relevant researches have been carried out
on the three-dimensional parking at home and
abroad. Scholars conducted research on the
characteristics, scale, and access efficiency of the
three-dimensional garage. Zhou Qicai analyzed the
parking status and parking service of the three-
dimensional garage in the literature [1]. The model
discusses the application of parking space utilization
and the probability of parking rejection in a three-
dimensional garage. It also discusses the possibility
of setting a parking buffer to improve the service
effectiveness of the parking system. In the paper [2],
Jiang Daijun analyzed the mechanical characteristics
of the roadway stereoscopic garage, and analyzed
the reasons for queueing at the garage entrance and
queue and the queuing model according to the
queuing theory, and optimized the queue captain and
total service time by mentioning a new scheduling
strategy. In the paper [3], Zhou Xuesong analyzed
and compared the optimal control strategies of two
typical three-dimensional garages for access
vehicles, namely selecting different objective
functions—time and energy consumption, and
establishing their optimal control strategy for access
vehicles and their The simulation results are
analyzed to illustrate the current research status of
the optimal control strategy for the access vehicle
and its importance in the stereo garage. In the
paper[4], Xu Genning proposed four kinds of
scheduling principles in order to achieve efficient
access to mechanical parking garages, and set up a
mathematical model that takes the average access
time of the garage as the objective function. In the
paper [5], Zhou Zhiyong introduced the multi-
service channel loss system to the parking lot
queuing system, used the theory of queuing theory
and the "birth and extinction process" to establish a
probability model of vehicle parking conditions, and
improved the vehicle accessibility of the parking lot.
In the paper[6], Zhou Qicai analyzed the average
parking time for different parking uses, and
proposed the concept of parking system fluency and
its calculation method. Li Jianfeng in the paper [7]
through optimization of the genetic algorithm to
optimize the scheduling strategy of the three-
dimensional garage, established a mathematical
model with the total access time as the objective
function. Xi Zhenpeng analyzes different strategies
for accessing vehicles in the paper [8]. He chooses
the standby strategy as the main strategy, and the

parking priority at the peak is the secondary strategy
to improve the efficiency of the access garage of the
three-dimensional garage. The paper [9][10][11]
demonstrated that there is a quantitative relationship
between the service time of the stacker and the
location of the stacker according to the different
ways of location path selection, which shows a
positive correlation. And through the argumentation
of this correlation, the shortest path configuration
method is given. Therefore, the rational planning of
a three-dimensional garage and the improvement of
the operating efficiency of the three-dimensional
garage are of great significance to the promotion and
operation of the three-dimensional garage.
2 INFLUENCE FACTORS AND
INDICATORS OF STEREO
GARAGE VEHICLES ACCESS
SPEED
2.1 Influence Factors of Stereo Garage
Vehicles Access Speed
The access speed of the solid garage affects the
efficiency of the stereo garage, and it is an important
index to evaluate the service level of the solid
garage. Therefore, improving and optimizing vehicle
access efficiency of three-dimensional garage is
particularly important for the operation of three-
dimensional garage.
The influencing factors of the access speed of the
vehicle in the three dimensional garage are mainly
as follows:
( 1 ) The number of entrances and exits for
stacking garages and stackers;
(2)The access efficiency of the stereo garage
stacker;
(3)The traffic organization around the stereo
garage.
It can be seen that if we want to improve the
access efficiency of the three-dimensional garage, it
should be analyzed from the determination of a
reasonable number of entrances and exits and the
number of stackers and the improvement of the
operating efficiency of the stacker.
When studying the access efficiency of a stereo
garage, we assume that the number of parking
spaces has been determined and sufficient. At this
time, the vehicle waiting time only needs to consider
the waiting time for the stacker service. The storage
process of the stacker is the same as the process of
picking a car, and the service rate is also the same.
Therefore, only the stored car process is discussed in
this article. The stacker crane picking process is not
described here any more. The stacker crane model is
also suitable for picking up cars. process.
2.2 Index of Access Speed of Stereoscopic
Garage Vehicles
(1)Average waiting time
The average waiting time for the parking garage
is the time from the arrival of the vehicle to the
entrance and exit, waiting in line to receive the
stacker service.
(2)The average car waiting for the captain
The average waiting queue captain for a stereo
garage is the sum of the number of vehicles that are
being serviced by the stacker and the number of
vehicles that are waiting in line to receive service.
(3)Average storage time
The average parking time for a stereo garage is
the total time from the arrival of the vehicle to the
entrance and exit, waiting in line to accept the
stacker service, and parking at the designated
location.
3 THE M/M/S STACKER MODEL
WITH REFERENCE TO THE
PREFERENCE COEFFICIENT
3.1 Basic Theoretical Analysis of the
Model
(1)Input process
1)Customer number. Assume that the number
of vehicles arriving in a stereo garage is unlimited.
The number of customers is .
2)Type of arrival. The arrival of the vehicle is a
single vehicle arrival. The time interval of arrival is
distributed in the second chapter. It has been verified
by the data and in accordance with the Poisson
distribution.
(2)Service organization
1)The number of service desks. When
considering the number of stackers, the stacker is a
service desk, and a stacker corresponds to an
entrance and exit, and how many stackers
correspond to the number of service desks.
2)Service time distribution
Each vehicle receives service, and it is placed in
a parking space at a designated location. The time at
which the vehicle receives service at the stacker is
the access time of the stacker. Because the location
of the vehicles in the garage is random, the stacker
crane access time is also random. According to the
statistical distribution of the garage service time, the
corresponding service time of the vehicle is also
approximately subject to the negative exponential
distribution [4].
(3)Queuing rules
When the vehicle arrives in the garage, if the
parking space is full, it needs to wait in line, the
queuing rule is the waiting system first to first
service, so the analysis is obtained, the stacker
service model is M/M/S model.
(4)Tendency selection coefficient
The preference coefficient is that when the
vehicle arrives at the garage, it will tend to choose
the location convenient for finding and access to the
entrance and exit, in particular, it will tend to choose
the center entrance. When more entrances and exits,
this tendency to choose more obvious. We set the
preference coefficient is
k
C
.
3.2 The Theoretical Analysis Process of
the Number Service Model of
Stacker
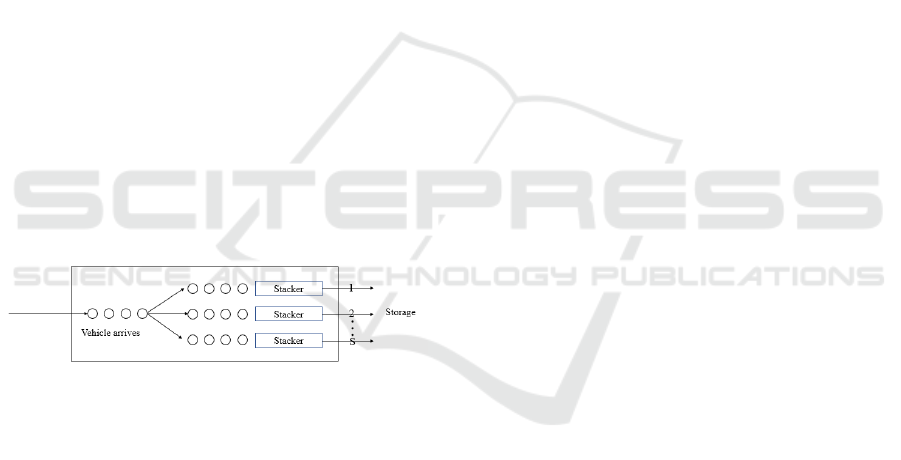
When the vehicle arrives at the garage, the actual
queuing process is relative to the stacker, as shown
in Figure 3-1.
Figure3-1 The queueing process of stacking machine.
When the vehicle arrives, it is possible to choose
a stacker exit and entry according to the actual
situation. The reason for selection is different from
driver's behavior and practice. Some drivers choose
convenient access, and some drivers choose to enter
the entry line with fewer queues.
We assign the probability that the driver tends to
choose an entry and exit, assignment is
k
C
.
1
1
S
k
k
C
=
=
∑
.The vehicle receives the stacker service
on the principle of first come and first served at the
entry and exit.
According to the above discussion, we do
research on queues at various entrances and exits.
Suppose that
()Nt
is the number of vehicles at
the K entry point.
{
}
() ()
n
Pt PNt n==
(3-1)
Where
()Nt
——Number of vehicles at the k-th
entrance at time t(veh);
()
n
Pt
——The probability of the nth car at the
kth entrance and exit at time t.
In a very short time interval, there will be one of
the following four situations at the garage exit of K
garage. Firstly, there is no vehicle arrival and no
vehicle service finished. Secondly, there is only the
arrival of vehicles and no vehicle service finished;
Thirdly, three is no car arrival and a car service
finished. Fourthly, there is only one car arrival, and
there is a car service finished.
(1)Firstly, there is no vehicle arrival and no
vehicle service finished.
The probability of 0 of the vehicles arriving in a
three-dimensional garage is:
1()
t
ett
λ
λο
−Δ
=−Δ+ Δ
(3-2)
The number of vehicles reaching the solid garage
is 1, but the probability of not entering the K exit is:
[]
(1 )
(1 ) 1 ( )
(1 ) ( )
t
k
k
k
te C
Ct t t
Ct t
λ
λ
λλο
λο
−Δ
Δ•−
=− Δ•−Δ+Δ
=− Δ+Δ
(3-3)
No car service end probability is:
1()
t
ett
μ
μ
ο
−Δ
=−Δ+
(3-4)
So the probability of no vehicles arriving and no
vehicles being serviced is:
[
]
[
]
[][]
1(1)()1 ()
1()1()
1()
k
k
k
tCtt tt
Ct t t t
tC t t
λλομο
λο μο
μλο
⎡⎤
−Δ+ − Δ+ Δ −Δ+ Δ
⎣⎦
=− Δ+Δ −Δ+Δ
= − Δ− Δ+ Δ
(3-5)
Where
e
——natural logarithm, short-cut
process 2.71828;
λ
——Vehicle arrival in unit time(pcu/h);
tΔ
——Tiny time intervals(s);
()t
ο
Δ
——High order infinitesimal quantities
of
tΔ
;

μ
——Average service time of stacker(s);
k
C
——The probability of reaching the k-th
entrance of the arriving vehicle.
(2)Secondly, there is only the arrival of
vehicles and no vehicle service finished
At this point, the number of vehicles reaching the
garage entrance and exit is 1, and the probability of
entering the K exit is::
()
t
kk
te C C t t
λ
λλο
−Δ
Δ=Δ+Δ
(3-4)
The probability that no car has finished service
is:
1()
t
ett
μ
μο
−Δ
=−Δ+ Δ
(3-7)
The probability that only one vehicle will arrive
and no vehicle service is completed :
[
]
[
]
()1 ()
=()
k
k
Ct t t t
Ct t
λο μο
λο
Δ+ Δ − Δ+ Δ
Δ+ Δ
(3-8)
( 3 ) There is no vehicle to arrive, only the
probability of the completion of a vehicle.:
[
]
1- +(1- ) + ( ) ( )
() ()
t
k
t
tC t t t te
te t t t
μ
μ
λλοομ
μομο
−Δ
−Δ
ΔΔΔ+Δ•Δ
=Δ + Δ=Δ+ Δ
(3-9)
(4)There is a vehicle arriving and there is a
probability of completion of a vehicle service.:
[
]
+( ) =( )
t
k
Ct t te t
μ
λο μ ο
−Δ
⎡⎤
ΔΔ Δ Δ
⎣⎦
(3-10)
According to the probability formula, the
solution is:
11
10
11
0
n 1
kn kn k
nn
nnn
n
k
n
CCC
PP P
C
P
λλλ
μμμμ
λ
μ
−−
−
−
==
⎛⎞
=≥
⎜⎟
⎝⎠
L
L
(3-11)
And
0
1
n
a
P
∞
=
=
∑
(3-12)
00
00
1
()
1
n
k
n
k
an
C
PPP
C
λ
λ
μ
μ
∞∞
==
==
−
∑∑
(3-13)
0
1
k
C
P
λ
μ
=−
(3-14)
k
k
C
λ
ρ
μ
=
0
1
k
P
ρ
=−
(3-15)
So
0
( ) (1 ) n=0,1,2,
nn
k
nkk
C
PP
λ
ρρ
μ
==− L
(3-16)
Where
n
P
——The probability of having n cars at the
garage entrance;
μ
——Stacker average service time(s).
3.3 Basic Parameter Index Analysis of
Model
According to the above model analysis can be
obtained as follows:
(1)Average number of vehicles at the k-th
entrance (including service vehicles)
00
1
0
0
2
(1 )
=(1 )
(1 )
1
(1 ) ( )
1
1
(1 )
(1 ) 1
n
kn kk
nn
n
kk
n
n
kk k
n
k
kk
kk
k
kk
kk
nnPn
nP
d
d
d
d
ρρ
ρρ
ρρ ρ
ρ
ρρ
ρρ
ρ
ρρ
ρρ
∞∞
==
∞
−
=
∞
=
==−
−
=−
=−
−
=− =
−−
∑∑
∑
∑
(3-17)
(2)Average queue length at the k-th entrance
()
011
2
(1)
11
k
qnnn
nnn
kk
k
kk
LnPnPP
ρρ
ρ
ρρ
∞∞∞
===
=−= −
=−=
−−
∑
∑∑
(3-18)
(3)Average waiting time
After a vehicle arrives at a garage, the waiting
time before choosing the kth entrance to receive
service is distributed between t+dt:
()
(w =Pt t dt f t dt<<+)
(3-19)
This probability value is the product of the
following three case probabilities:

Before the vehicle arrives, there are n vehicles at
the k-th entrance, and the probability is
n
nkk
P=
ρρ
(1- )
.
During (0,t) there is n-1 vehicle service over time,
Its probability is
1
()
(1)!
tn
et
n
μ
μ
−−
−
.
A car is being served in (t, t+) time. The probability
is
dt
μ
for all n values from 1 to n, The above
situation is established ,so:
()
1
1
1
(1 )
=(1 )
(1)!
()
(1 )
(1)!
=(1 )
=(1 )
k
k
nnt
kk
n
n
t
k
kk
n
t
t
kkk
t
kk
t
f
tdt e dt
n
t
edt
n
ee dt
edt
μ
μ
ρμ
μ
μρ
μ
ρρ μ
ρμ
μρρ
μρ ρ ρ
μρ ρ
∞
−
=
−
∞
−
=
−
−−
−
−
=−
−
−
−
∑
∑
(3-20)
()
(1 )
=(1 )
k
t
kk
ft e
μρ
μρ ρ
−−
−
(3-21)
The distribution function for waiting time is:
(1 )
0
(1 ) (1 )
0
() (1)
1
k
kk
t
t
kk
t
tt
kk
Pt e dt
ee
μρ
μρ μρ
ωμρρ
ρρ
−−
−− −−
≤= −
=− = −
∫
(3-22)
The average waiting time is:
00
22
(1) (1) (1 )
1
(1 )
(1 ) (1 )
kk k
k
kk
kk
w tdp w t e tdt
μρ ρ μ ρ
ρ
μρ ρ
μρ ρμ
∞∞
=≤= −−−
=− =
−−
∫∫
(3-23)
Average parking time
d
:
()
(1 )
=(1 )
11
(1 ) (1 )
k
t
kk
k
kk
ft e
d
μρ
μρ ρ
ρ
ρμ μ ρμ
−−
−
=+=
−−
(3-24)
At this point, we have obtained various queueing
indicators at the k-th entrance. Here
k
k
C
λ
ρ
μ
=
(3-25)
Where
λ
——Average rate of arrival at the
entrance;
k
C
——The probability of reaching the k-th
entrance of the arriving vehicle;
μ
——The average service time of the stacker
(s)
k
ρ
——Service strength at the k-th entrance
Assuming that the average service time of the
stacker
μ
is fixed at this time, as the arrival rate of
the vehicle increases, the service intensity of the
stacker becomes larger and larger, thus increasing
the queue length at the k-th entrance and exit, and
increasing the average delay of parking. Garage
service is less efficient.
k
C
is the propensity selection coefficient, that is,
the probability that the arrival vehicle chooses the k-
then trance. When the garage system reaches
equilibrium, the vehicle arrives at the garage, and
the driver tends to choose the equal opportunity for
each exit. At this time, the queuing situation at each
entrance and exit converges. In the balanced state,
the service level of the entire service system can be
reflected by the queuing situation at the k-then
trance. At this time
1
k
Cn
−
=
.
The queuing indicators in the garage system can
be derived from the following formulas.
(1)Average number of vehicles in the system:
Set the number of vehicles at each entrance and
exit at any time isX1 、 X2 、 X3,…,Xm, So the
average number of vehicles in the system is:
12
12
11
1
()
m
m
m
mk
k
nEX EX X X
EX EX EX
nn n n
=
== +++
=+++
=++ =
∑
L
L
L
(3-26)
(2)Average queue length in the system:
()
1
m
k
qq
k
LL
=
=
∑
(3-27)
Queue length at each entrance:
'()
1
11
m
k
qq q
k
LL L
mm
=
==
∑
(3-28)
(3)Average waiting time:
For any vehicle entering the cubic garage system,
the probability that its waiting time is less than t is
given by Eqs. (3-29) and (3-30).:
1
() ()
m
kk
k
Pw t CP w t
=
≤= ≤
∑
(3-29)
00
1
0
11
() ()
(( ))
m
kk
k
mm
kk kk
kk
w tdpwt td CPwt
CtdPwt Cw
∞∞
=
∞
==
⎡⎤
=≤= ≤=
⎢⎥
⎣⎦
≤=
∑
∫∫
∑∑
∫
(3-30)
(4)Average parking time is
1
11
m
kk
k
dw Cw
μμ
=
=+ = • +
∑
(3-31)
It can be seen from the above formula, When
1
k
Cn
−
=
, The queue status of the entire system can
be represented by the queue status of any entrance.
However because the driver of the vehicle tends to
be selective,
k
C does not equal
1
n
−
, but is a
constant different from
1
n
−
. Drivers will always
tend to choose entrances and exits that are easy to
access from the road into the garage area and are
convenient for parking and picking up.
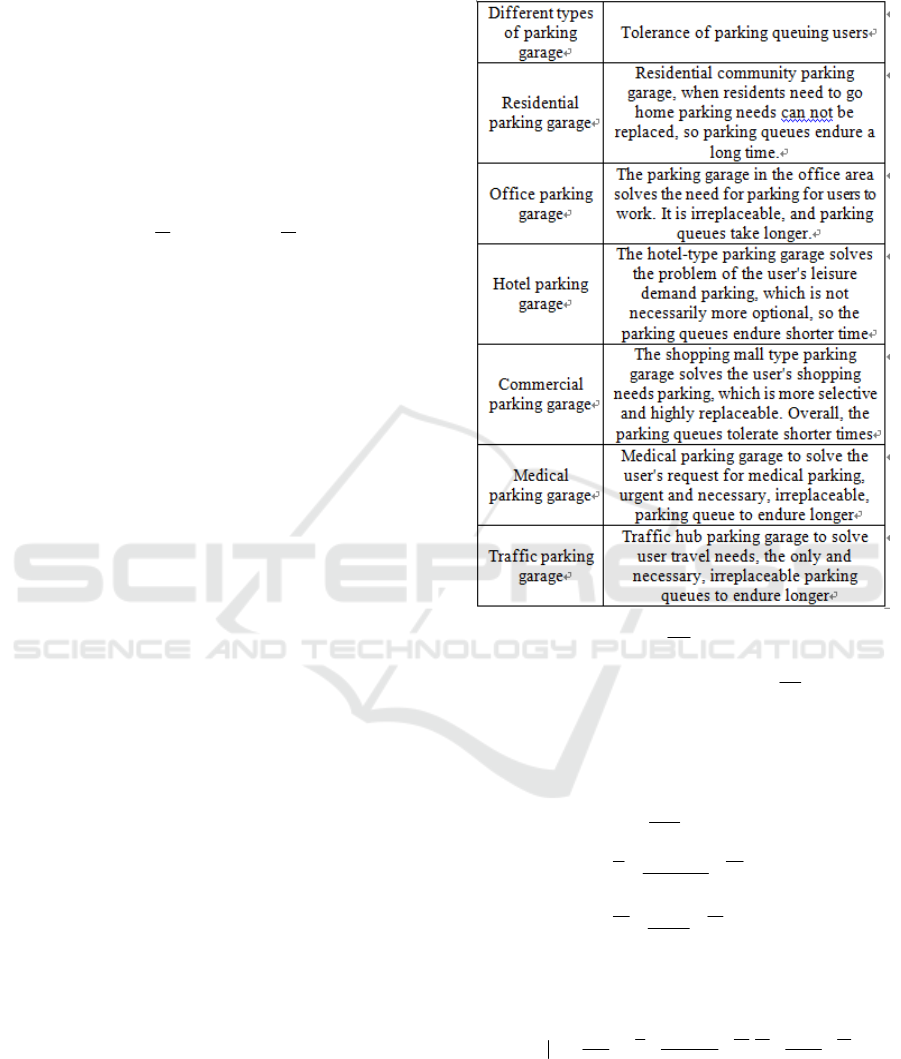
3.4 Considering the User Tolerance
Optimization Model
The service level of the stereo garage is mainly
reflected by the objective indicators of average
waiting time and average queue length, but for the
same queue length and parking waiting time, the
severity of anxiety of different groups of people is
different. Tolerance time varies with individual
differences and cannot be determined by a fixed
length of time criterion.
User tolerance time is not the same for different
types of parking garages, It is shown in table 3-1
below.
Table3-1 The user tolerance time of garage for different
use.
Assume that the longest average waiting time
tolerated by the user is
r
w
, and the longest average
queue length that can be tolerated is
r
L
. When the
following conditions are satisfied, the optimal
number of stackers can be obtained.
2
1
(1 )
1
k
k
k
r
k
k
qr
k
C
ww
LL
λ
ρ
μ
ρ
ρμ
ρ
ρ
⎧
=<
⎪
⎪
⎪
⎪
=<
⎨
−
⎪
⎪
⎪
=<
−
⎪
⎩
(3-32)
Find satisfaction
2
*
max 1; ;
(1 ) 1
kk k
krqr
kk
C
s
swwLL
λρ ρ
ρ
μρμ ρ
⎧
⎫
==<=<=<
⎨
⎬
−−
⎩⎭
this is the optimal number of stackers.
4 INFLUENCE FACTORS AND
INDICATORS OF STEREO
GARAGE VEHICLES ACCESS
SPEED
In order to optimize the access speed of stereoscopic
garage vehicles, the following two methods can be
used to reduce the average waiting queue length and
the average waiting time.
(1)Only adjust the number of stackers s.
(2)Improve the stacker service speed μ and
adjust the number of stacker s in combination.
Assume that the vehicle arrival rate during a leveling
period of a certain garage is
60 /veh h
λ
=
,the peak
vehicle arrival rate is
90 /veh h
λ
=
,According to
design requirements, the average time t for the
stacker to complete a car access is 75s.That is
75
s
μ
=
.When there are two stackers, s=2, the
index parameters of the three-dimensional garage
are shown in the following Table 4-1.
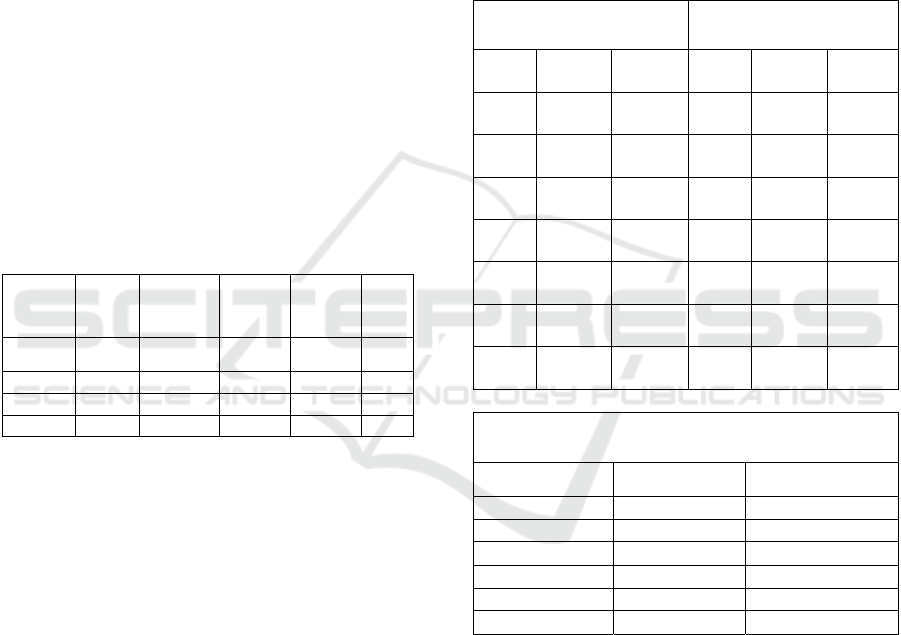
Table 4-1 The number of stackers s = 2 when the three-
dimensional garage index table.
λ
(veh/h)
ρk Lq(veh) W(s) d(s)
λ
(ve
h/h)
60 0.63 1.04 125.00 200.00 60
65 0.68 1.42 157.26 232.26 65
70 0.73 1.96 201.92 276.92 70
75 0.78 2.79 267.86 342.86 75
During the peak period
60 /veh h
λ
=
, the
average parking queue length
1.04
q
L
veh=
and the
average waiting time for cars are
125ws=
With the
increase in the number of vehicles arriving, it is
close to the peak,
80 /veh h
λ
=
.At this time, the
average parking queue lengthis
4.17
q
L
veh=
, the
average waiting time for parking is
375ws=
.At
this time, the queue length exceeds the design
specification of the three-dimensional garage
4
q
L ≤
.
When the vehicle reaches peakis
90 /veh h
λ
=
.At
this time, the average parking queue length is
14.06
q
L veh=
, the average waiting time for
parking is
1125ws=
. The average waiting time and
the average queue length are far beyond the
tolerance of customers. The service level of the
three-dimensional garage is low, and the normal
operation of the garage can no longer be guaranteed.
When the stacker crane service speed is
increased by 2%, 4%, and 8%, the index parameters
of the three-dimensional garage are shown in table
4-2 below. LetR be the rate of decrease in waiting
time from the original speed.
When the number of unused stackers is
calculated by the model, the average waiting time
for the car and the average car waiting for the
captain. The index parameters of the three-
dimensional garage when the stacker number is s=3
and s=4 are shown in the following Tables 4-2 and
4-3.
Table 4-2 List of indicators for improving the service
speed of the s=2 stacker crane.
μ increase by 2% μ increase by 4%
Lq
(
veh
)
W(s) R
Lq
(
veh
)
W(s) R
0.97 116.18 7.06% 0.90 108.00
13.60
%
1.31 144.95 7.83% 1.21 133.71
14.97
%
1.79 184.02 8.87% 1.63 168.00
16.80
%
2.50 240.10 10.36% 2.25 216.00
19.36
%
3.64 327.41 12.69% 3.20 288.00
23.20
%
5.69 482.09 16.82% 4.82 408.00
29.60
%
10.39 831.12 26.12% 8.10 648.00
42.40
%
μ increase by 8%
Lq(veh) w(s) R
0.83 93.35 25.32%
1.11 113.98 27.52%
1.50 140.62 30.36%
2.07 176.33 34.17%
2.94 226.71 39.54%
4.42 303.13 47.69%
When s=2, s=3, s=4, μ original speed and s=2, μ
increase speed by 2%, 4%, and 8% respectively,
wait for the captain to draw a map as the vehicle
arrival rate changes, as shown in Figure 4. -1 shows.
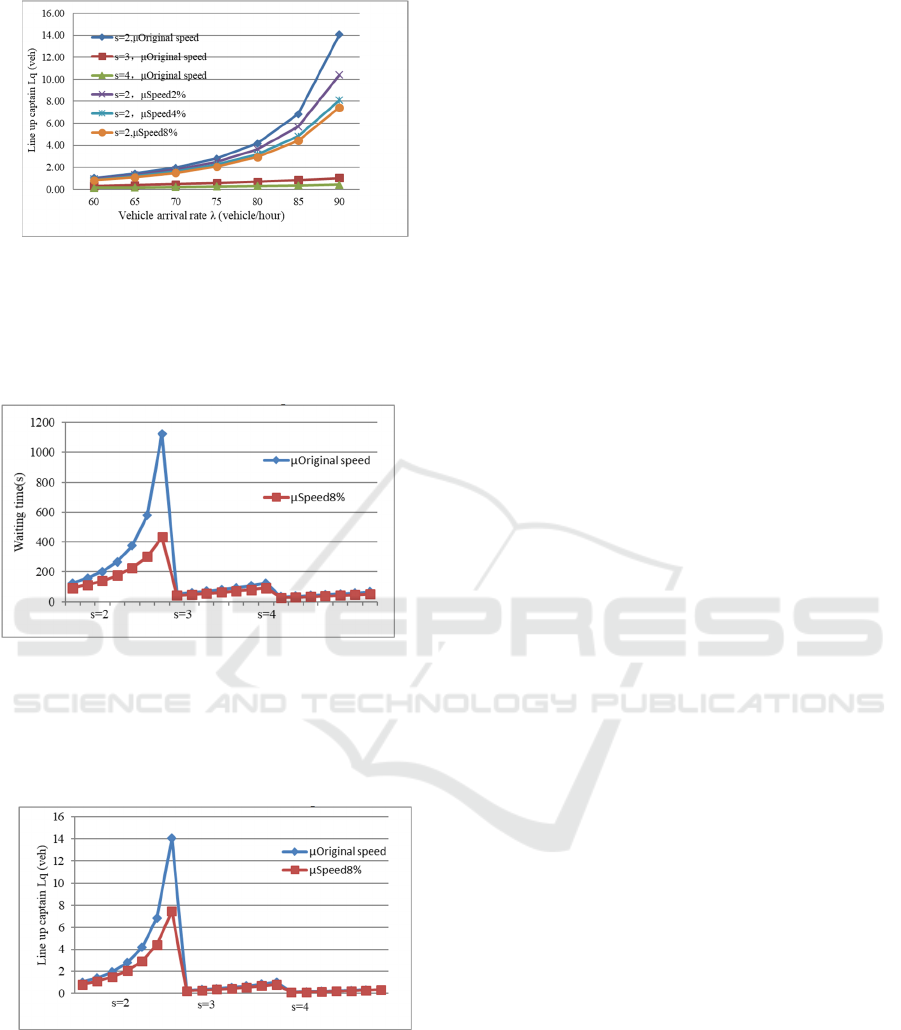
Figure 4-1 Relationship between arrival rate and waiting
captain.
When s=2, s=3, s=4, the average waiting time of
the car when the original speed and the speed of μ
increase by 8% are plotted as a function of the
vehicle arrival rate, as shown in Fig. 4-2.
Figure 4-2 The relation schema between arrival rate and
queue size.
When s=2, s=3, s=4, when the original speed of
μ and the speed of μ increase by 8%, the average
waiting distance of the car is plotted as the change of
the vehicle arrival rate, as shown in Fig. 4-3.
Figure 4-3 stacking machine number is not waiting for the
captain change map.
By analyzing the data in Tables 4-3 , as shown in
the data changes in Figure 4-2, Figure 4-3, when the
number of stackers s = 2, the vehicle arrival rate is
between During the change, by increasing the
service speed of the stacker, the stacker crane's
access efficiency can be significantly improved. The
average waiting time and the average waiting team
captain are all greatly reduced, and the service level
can also meet the customer tolerance. At this time,
increasing the number of stackers and optimizing the
access speed is not as obvious as improving the
service speed of the stacker. That is, there is no need
to increase the number of stackers, improve access
efficiency, and reduce energy consumption. When
the arrival rate of the vehicle changes from time to
time, the optimization effect of only increasing the
service speed of the stacker on the access speed is
not obvious. The average waiting time and the
average waiting time for the team leader are too
long, the service level is low, and the user cannot
satisfy the user. demand. Therefore, increasing the
number of stackers at this time optimizes the access
speed, which can significantly increase the access
speed and service level of the stereo garage vehicles.
The increase in the service level of the two stackers
is not obvious, so only one stacker is needed.
Due to the fact that the three-dimensional car
garages are mostly built in areas such as hospitals
and shopping malls where the traffic volume is
relatively large, it is recommended to use three
stacker cranes in actual operation. During the peak
period of non-traffic, two stacker cranes work and
fine-tune the stacker cranes. The service speed μ, the
level of service can meet most of the vehicle arrival
rate, stereo garage can be effectively run, when the
traffic peak period, when the three stacker crane
work at the same time, to ensure that the three-
dimensional garage operates at a higher level of
service . The third stacker can be used for inspection
when idle. This will not only optimize the access
speed of the three-dimensional garage, improve the
service level of the garage, but also reasonably save
energy consumption, but also ensure the rational
operation of the mechanical stacker.
5 CONCLUSIONS
This article first analyzes the factors affecting the
access speed of the stereoscopic garage, and
determines the index of the access speed of the
stereo garage. Then it establishes a model of the
number of stereo garage stackers with reference to
the selection coefficient. Under the condition of
customer tolerance, the optimization of the quantity
model of the stacker was optimized. Finally, the
vehicle access speed of the stereo garage is
optimized by changing the number of stackers and
configuring the service efficiency of the stacker.

REFERENCES
1. Zhou Qicai, Pei Ning, XiongXiaolei. Discussion on
Parking Garage Service Model and Efficiency Based
on Queuing Theory[J]. China Journal of Construction
Machinery, 2005 (2): 161-164.
2. Jiang Daijun. Research on the queuing and location
optimization of roadway stacking type three-
dimensional garage[D]. Chongqing University, 2014.
3. Zhou Xuesong, Tian Mi, Ma Youjie, et al. Research
on Optimized Control Strategy of Intelligent Stereo
Garage Access Vehicle[J]. Manufacturing Automation,
2008, 30(10): 29-34.
4. XU Gening, CHENG Hongmei, CHEN Yanwei.
Optimizing the Principle of Accessing and
Dispatching for Stereoscopic Garage Vehicles Based
on Queuing Theory [J]. Hoisting and Transport
Machinery, 2008 (5): 50-55.
5. Zhou Zhiyong, Chen Jun, Wang Wei. The acceptance
condition of parked vehicles based on queuing
theory[J]. Journal of Southeast University(Natural
Science), 2006, 36(4): 638-642.
6. Zhou Qicai, XiongXiaolei, Ren Jianqiang, et al.
Characteristic Analysis and Fluency Calculation of
Stereoscopic Parking System [J]. China Civil
Engineering Journal, 2005 (1): 41-45.
7. Li Jianfeng, Duan Wenjun, Fang Bin, et al.
Optimization of Access Parking Dispatching Based on
Improved Genetic Algorithm[J]. Control Engineering,
2010, 17(5): 658-661.
8. Xi Zhenpeng. Analysis of the Access Policy of
Stereoscopic Garage Based on Queue Theory [J].
Forum on Industry and Technology, 2011, 12: 81-82.
9. Potrc,T.Lerher, J. Kramberger, and M.Sraml.
Simulation model of multi-shuttle automated storage
and retrieval systems. Journal of Materials Processing
Technology,2004: 236-244
10. Motoji Yamamoto, Yoshiaki Hayashi and Akira Mohri,
Garage parking planning and control ofcar-like robot
using a real time optimization method[C] Proceeding
of the 2005 IEEE International ConferenceonAssem
Task Plan,July19-21,2005,Canada,2005:248-253.
11. Perry R F, Hoover S F, Freeman D R. Design of an
Automated Storage/Retrieval System Using
Simulation Modeling[J].Institute of Industrial
Engineers. ICAW Proceedings,1983: 57-63.
12. Jung S,Moon B R. Toward Minimal Restriction of
Genetic Coding and Crossovers for the 2nd
Eunclidean TSP
. IEEETrans on Evolutionary
Computation, 2002, 6 (6) : 557-565.
