
The Numerical Simulation of Thermal Fatigue Crack Propagation on
Mold Steel
Jiangang Ding
Shanghai Aircraft Manufacturing Co., Ltd, Shanghai, 201324, P.R. China
Keywords: Mold Steel; Thermal Fatigue; Crack Propagation; Numerical Simulation
Abstract: H13 steel suffered periodic heating and cooling when used as die casting mold materials, and this will
leading to emerge thermal fatigue easily. To solve this problem, this paper studied the thermal fatigue
process of die casting mold steel by comparing the results of thermal fatigue test and ANSYS simulation
method, and try to predict the initiation and propagation of thermal fatigue cracks. In this paper, HMTH1
thermal fatigue testing machine was employed to heat and cool the specimen in periodicity, and recorded
the cycle times and crack lengths when thermal fatigue cracks were observed. The ANSYS software was
used to complete finite element simulation of the experiment and obtain the result of temperature fields,
heating stress fields and cycle crack paths of different thermal fatigue cycles. The result indicated that as the
thermal fatigue cycles up to 500 and 1000, the main crack propagated 567.29μm and 225.29μm, and
compared the simulation result under the same conditions to solve the problem of initiation and propagation
of thermal fatigue cracks better.
1 INTRODUCTION
Die casting mold is a kind of hot work mold, which
working environment is very bad. Under the service
conditions of hot and cold shock, it will appear a lot
of micro-cracks on the cavity surface of the mold,
which mostly presenting the form of radially,
parallel, and reticular, and is called the thermal
fatigue crack. Therefore, it is a kind of die failure
forms and its proportion has reached 60%~70%[1,
2]. Die casting mold requires low roughness of the
surface, it can not continue to service after the hot-
cold fatigue cracks have appeared, hence the key
point of the service life of die casting mold is the
time of thermal fatigue cracksappears.Moreover, the
factors that affect the thermal fatigue of the mold
include the cycle of different temperature, thermal
conductivity and the coefficient of thermal
expansion. The methods of thermal fatigue
performance test includes rating crack method
namely Uddeholm method, the plate specimen
method[3], etc, and one of the earliest which is
proposed by COLFIN in 1953.Compared with the
plate specimen method, the cost of Uddeholm
method is lower, resulting in its widely applied.
The Uddeholm is a method of thermal fatigue
test, which heating and cooling the rod specimens
repeatedly in high frequency induction, then
compared with the standard fingerprint to evaluate
the degree of surface cracks[4-5]. The advantages of
this method is considering the local width and the
overall breadth of the crack, andit is visual but with
the drawback that it is difficult to be quantified, and
it needs a lot of experienced engineers to evaluate
the thermal fatigue crack, which was great
influenced by subjective factors. And the test rod
heating in the induction conditions have great
difference with the actual casting conditions.The
current study for the life of die casting mold is
focused on improving the mold thermal fatigue life
from the casting mold design[6-8],mold structure[9-
12], mold material, mold processing, heat treatment
process and die casting process parameters. In the
paper, the HMTH1 thermocouple heating self
constraint thermal fatigue testing machine was
adoptedto conduct the thermal fatigue experiment
and the ANSYS software was used to simulate the
experiment. Finally, By comparing the results of the
experiment and the finite element simulation, to
explore how to improve the thermal fatigue life of
die casting mold[13].

2 THE METHOD OF THERMAL
FATIGUE TEST
In the experiment, the high frequency power was
used to heat and cool the sample for the Uddeholm
method[14], which can initiate thermal fatigue crack
in the surface of the specimen. But it can only obtain
the expansion trend of thermal fatigue crack, and can
not accurately and intuitively observe the dynamic
changes over time of the specimen’s interior
temperature field, thermal stress field. According to
the situation of the numerical simulation of thermal
fatigue crack, currently in the domestic and foreign
research, the majority of the two-dimension plane
model has been used[15, 16], yet the actual extend
of crack, mostly occurs in the 3D model. Based on
this situation, this paper used the ANSYS software
to complete finite element analysis of the H13 die
steel and gain the results of the temperature field and
thermal stress of the three-dimensional crack, and
compared with the result of the experiment to
explore the thermal fatigue crack location, crack
length and crack growth path better.
2.1 The Basic Theory of Thermal
Transmission Ways
2.1.1 Thermal Radiation
This experiment adopts the way of the
electromagnetic induction coil heating, which is a
kind of heating transference of thermal radiation.
The heat radiation refers to objects emit
electromagnetic energy, which can be absorbed and
transferred into the heat by other objects, as a kind
of the heat exchange process. Its transfer mode does
not require any medium, and the net heat radiation
between the two objects can be calculated in the
Stephen Boltzmann equation.
)(q
4
2
4
1121
TTFA −=
εσ
(1)
Where
q
is the rate of heat flow,
ε
is the
radiating rate of actual object and the numerical
value is between 0 to 1, σ is the Stephen Boltzmann
constant, which is about
428-
.m/1067.5 KW×
,
1
A
as the area of the radiating surface 1,
12
F
is the
shape coefficient from the radiation surface 1 to the
radiation surface 2,
1
T
is the absolute temperature of
radiation surface 1,
2
T
is the absolute temperature of
the radiation surface 2.
2.1.2 The Heat Convection
Thermal convection refers to the heat exchange
caused by temperature difference between the solid
surface and the contacting fluid surface. In this
experiment, adopted the way of water cooling is a
kind of transferring way of heat convection. Thermal
convection can be described by Newton cooling
equation.
)(q
"
BS
TTh −=
(2)
Where
h
is the transferring coefficient of
convection,
S
T
is the solid of surface temperature;
B
T
is the temperature of the around fluid .
2.2 The Basic Theory of The Thermal
Fatigue Crack
The fatigue process is generally divided into the
following stages, one is the formation of micro
crack; then is the extension of small crack, next is
the extension of large crack, the last one is the final
failure. The first two stages are called "period of
crack initiation”, the growth of large crack are called
as "period of crack extending". But one point should
be clear, it is almost impossible to accurately
determine the transition point of crack from crack
initiation to crack extending. The total fatigue life N
in the crack initiation period is determined by the
stress cycle numbers N
i
when fatigue crack initiation
and the stress cycle numbers N
P
when crack
propagation.
pi
NNN +=
(1)
One of the most important stage of the fatigue
process is fatigue crack initiation, its form mainly
depends on the material’s geometric structure, the
micro structure of the material and the type of
applied stress. In the analysis, it is customary to
assume that cracks usually occur at the maximum
point of the material, and the fatigue crack initiation
life in low cycle as follows.
6.0
6.0
12.0
mb
-1
1
ln
-
5.3
−−
⎥
⎦
⎤
⎢
⎣
⎡
+=Δ NN
E
φ
σσ
ε
(2)
Where
ε
Δ
is the total cyclic strain amplitude, N
is the number of load cycles,
ψ
is shrinkage rate of
the materials section,
m
R
is average stress, when in
the analysis of fatigue crack propagation, it’s usually
assuming that the fatigue crack propagation rate
a
d
/
N
d
is function of the range of stress intensity factor
KΔ
,then determining the relationship between the
crack growth rate and the propagation life as
follows:
2mm
1a
add )(
σ
Δ= C
N
(3)
the integrals:
⎟
⎟
⎠
⎞
⎜
⎜
⎝
⎛
⋅
Δ
⎟
⎠
⎞
⎜
⎝
⎛
−
==
∫
2
m
-1
th
2
m
-1
c
m
1
0
a-a
)(
2
m
1
1
d
σ
C
N
P
N
NP
(4)
m
1
a
⎥
⎦
⎤
⎢
⎣
⎡
Δ
Δ
=
σ
K
CC
(5)
Where a is the crack length,
c
a
is the critical
length of crack extension,
p
N
is the number of load
cycles, C, m are parameters related to the materials,
KΔ
is the range of stress intensity factor ,a
th
is the
critical length of the crack initiation.
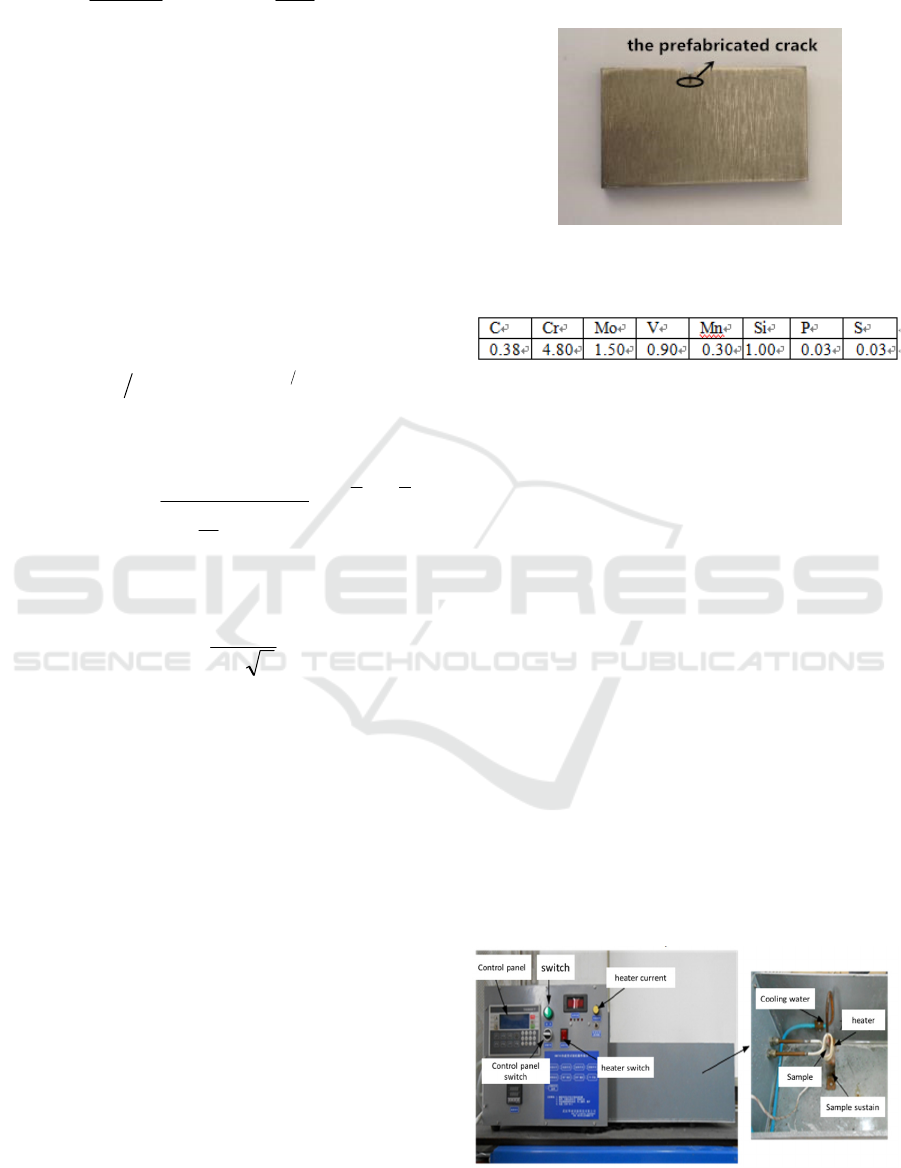
2.3 The Sample
H13 is most commonly used in die-casting mold,
its composition is shown in Table 1, and the size of
specimen is 32mm × 18mm × 3.5mm, as shown in
Fig.1, in the middle of each sample processes a V
notch by the way of line cutting, in order to the
concentration of the thermal stress, and shorten the
time of experiment. In the bottom of the groove,
presets a width of about 1mmasthe crack source of
the experiment. Before the experiment, polishing the
surface of the specimen with sandpaper, then the
specimen is tied up with copper wire to the test
bench of thermal fatigue testing machine, set up the
experimental parameters, and conducts the thermal
fatigue test. Finally, the propagation mode of crack
is observed and the experiment record is done.
Fig.1 H13 steel sample.
Tab.1 Chemical compositions of H13 steel.
2.4 Thermal Fatigue Testing
Thermal fatigue test can be completed on the
HMTH1thermal fatigue test machine as shown in
Fig.2, which can automatically control the heating
temperature, cooling time and record the numbers of
cycle. The high-frequency coil heating method is
used in the experiment, and the heating time is 3
seconds and the heating temperature is 680 ℃.Then
adopt the cooling way of spray water and the cooling
time is 6 seconds, the temperature is 95 ℃ after
cooling. The first experiment was conducted with
500 cycles of thermal fatigue, and then took out of
the specimen from the machine and removed the
surface oxide of the specimen with dilute
hydrochloric acid, then polished the surface and
analyzed the total length of crack expansion and the
path of crack propagation with Nikon
MA100inverted microscope and UPO image
software. After that, every 500 times is a hot and
coldcycle, and record the length of the fatigue crack
and direction of crack propagation after each cycle,
until the end of 10000 cycles.
Fig.2 Thermal fatigue testing machine.
3 ANALYSIS AND
OBSERVATION OF THERMAL
FATIGUE CRACK
3.1 The Analysis of Surface Crack of
the Die Mold
Thermal fatigue crack is one of the main failure
forms of hot work die/mold, which is commonly
known as thermal cracks. It is caused by the thermal
stress of the material. Under the function of the
thermal stress[14], due to the repeated and systolic
strain, making the materials produce a continuous,
local and permanent organizational changes. And the
heat cracks usually occur in the surface of mold
cavity, leading to the changes of the stress
distribution state, and when the thermal crack grows
to a certain length,as the plastic strain, resulting in
the stress relaxation and the crack stop expanding.
But along with the gradual increase of the
alternating hot and cold cycles, some small holes
appear around the tip of the crack and gradually
developing into micro cracks, and then will merge
with the cracks at the beginning of the formation
continue to expand. Eventually, those cracks
connected with each other to form a kind of serious
network cracks, leading to failure and seriously
affecting the surface quality of products as shown in
Fig.3.
Fig.3 Thermal fatigue crack of the hot work mold surface.
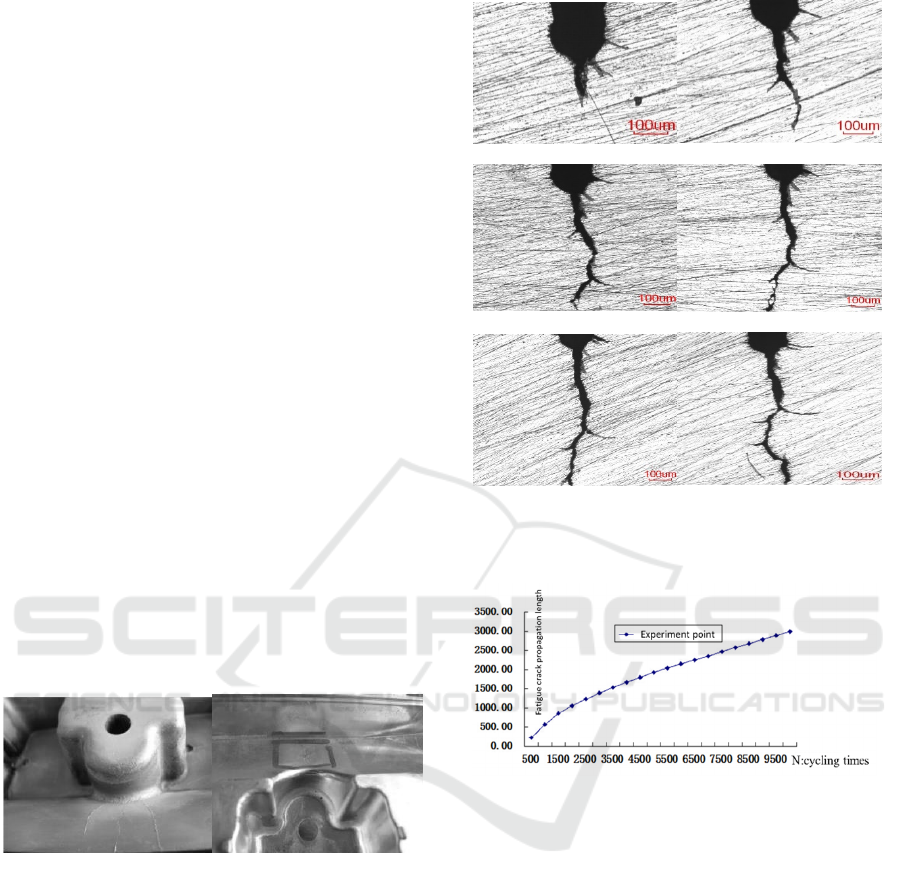
3.2 The Observation of Thermal
Fatigue Cracks
In this paper, due to the limited experimental
conditions and the practical application condition for
H13 die casting mold, and the crack initiation length
of thermal fatigue is defined as 0.3 mm, and only
take the first 3000 cycles to be accurately analyzed
as shown in Fig.4 and Fig.5.
(a)500 cycles (b)1000 cycles
(c)1500 cycles (d)2000 cycles
(e)2500 cycles (f)3000 cycles
Fig.4 Crack growth after different cycles of thermal
fatigue test.
Fig. 7 A diagram on the connection between N
cycling
times and crack propagation length.
The crack initiated at the local of the V type
notch, as the hot and cold alternating thermal stress
in the material. When the thermal fatigue cycles are
500 times, three cracks occurred at the gap, and the
main crack at the notch has expanded 225.29 μmas
shown in Fig.4(a).When the thermal fatigue cycles
are 1000 times, as shown in Fig.4(b), a crack in the
notch continues to expand, which has extended to
567.29 μ m, but the other two cracks don’t continue
to expand clearly. As the concentrate stress in the V
type notch, it’s easier to produce cracks, and a
second crack occurs based on the main crack; when
the thermal fatigue cycles up to 1500 times, as
shown in Fig.4(c)the thermal fatiguecrack has
reached to 860.82 μm, and a second thermal fatigue
crack has appeared again. As can be seen in
Fig.4(d), when the cycles are 2000 times, the length
of the crack up to 1057.54 μm. Finally, when the
thermal fatigue cycles reach to 2500 times and 3000
times, the thermal fatigue cracks have extended to
1229.06 μm and 1391.86 μm, and appears two
second cracks as shown in Fig.4(e) and
Fig.4(f).Combined with Fig.4 and Fig.5, it can be
concluded that with the increase of the thermal
fatigue cycles, after the thermal fatigue crack has
initiated, the rate of the primitively crack
propagation is very high, and then the speed
decreases gradually and tends to be stable at last.
4 THE NUMERICAL
SIMULATION OF THERMAL
FATIGUE
4.1 Numerical Simulation of Thermal
Stress
The parameters of H13 such as the coefficient of
linear expansion, the coefficient of thermal
conductivity, elastic modulus, ultimate strength, and
yield stress are shown in Tab.2
Table 2 The physical parameters of the H13.
CT
0
)( KW ⋅m
λ
10
)(
−
C
α
MpaE
)(Mpa
b
σ
)(Mpa
s
σ
20 25.0
6
100.10
−
×
227000 1790 1100
100 25.9
6
109.10
−
×
221000 1748 900
200 27.6
6
104.11
−
×
216000 1710 810
300 28.4
6
102.12
−
×
208000 1650 708
400 28.0
6
108.12
−
×
200000 1580 600
500 27.6
6
103.13
−
×
192000 1400 398
600 26.7
6
106.13
−
×
190000 1100 208
The temperature of the simulated sample will
change in the process of heating and cooling, and the
parameters of simulation are set to heat 3 seconds at
the temperature of 680 ℃, and cold 6 seconds at the
temperature of 95 ℃.
The analysis of thermal stress, actually that is the
coupling analysis between two physical fields of the
thermal and stress, and due to the change of load
temperature over time, it belongs to the transient
thermal analysis. ANSYS provides two analysis
methods of thermal stress, the direct method and the
indirect method [16].The direct method adopts the
coupling unit with temperature and displacement
degrees of freedom, then gets the results of the
analysis of thermal stress and structure-stress at the
same time; while the indirect method is carrying on
the thermal analysis at the first, and then obtaining
the node temperature, which is applied to the
analysis of structure stress as body load.
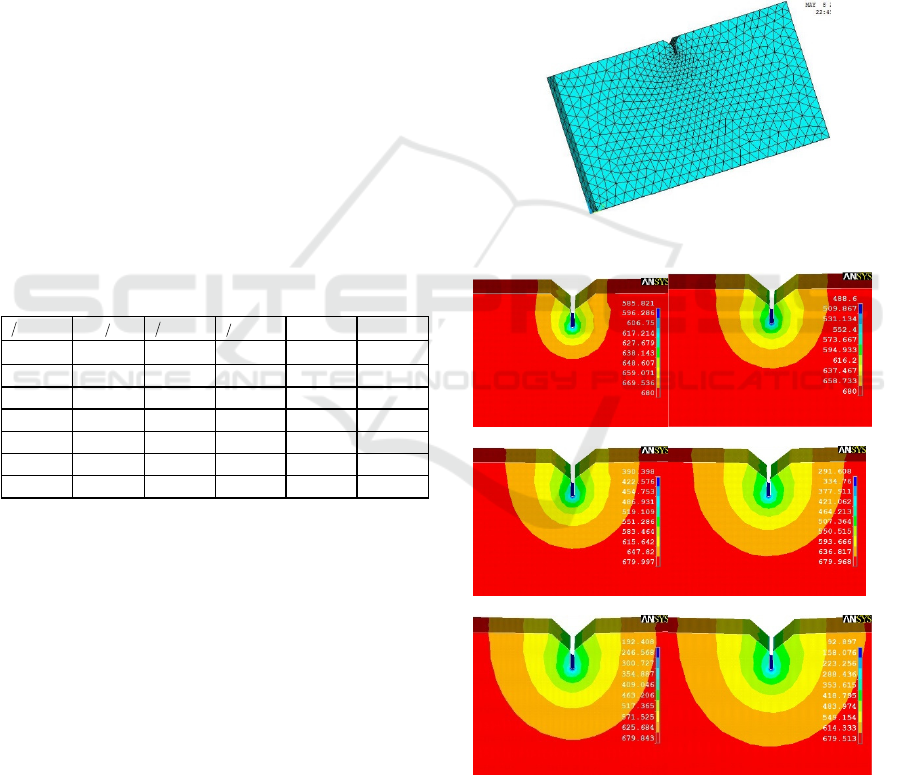
In this paper, using the direct method for the
thermal stress analysis, in the pretreatment, the unit
of Coupled Field, Scalar Tet 98 was used to define
the material parameters of H13 steel as shown in
Table 2. Then the three dimensional model is built
and meshed, adopting the way of free type mesh,
and refine the meshing of the V notch part of the
specimen as shown in the Fig.6,and then applying
cyclic load of the thermal fatigue. At last, obtaining
the temperature fields and the mises equivalent
stress fields respectively, as shown in Fig.7 and
Fig.8.
Fig.6 The meshed model.
(a) (b)
(c) (d)
(e) (f)
Fig.7 The different cooling time of the temperature fields:
(a) 0.1s, (b) 0.2s, (c) 0.3s, (d) 0.4s, (e) 0.5s, (f) 0.6s.
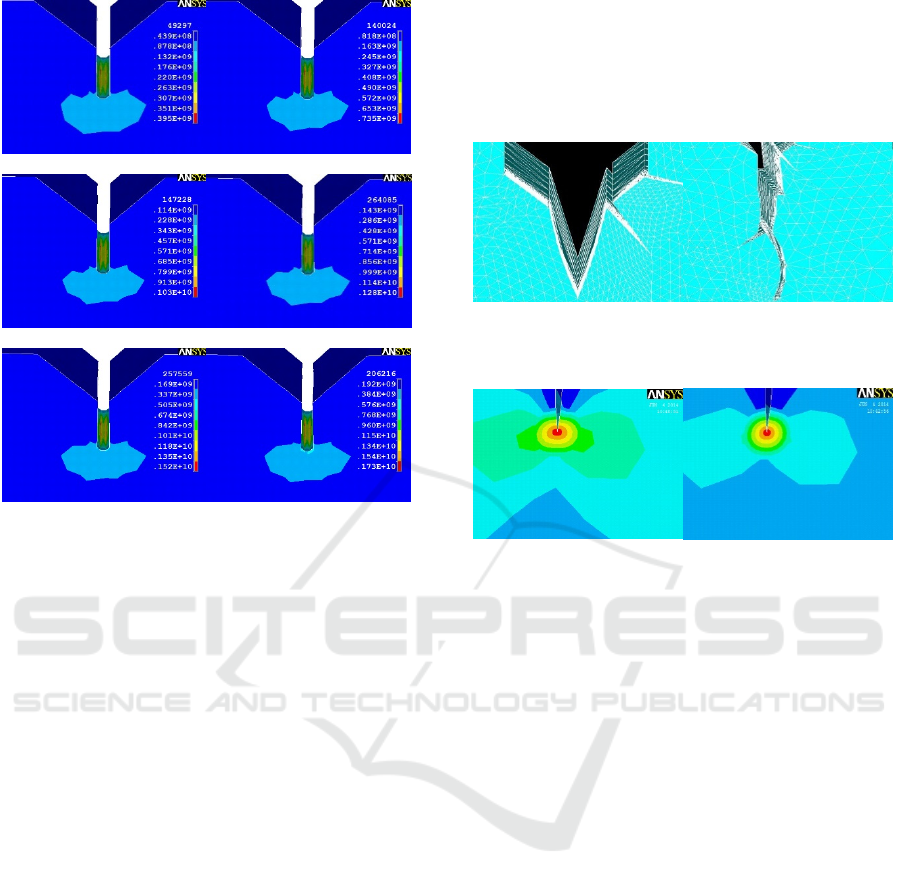
(a) (b)
(c) (d)
(e) (f)
Fig.8 The different cooling time of the mises equivalent
stress fields: (a) 0.1s, (b) 0.2s, (c) 0.3s, (d) 0.4s, (e) 0.5s,
(f) 0.6s.
As given inFig.7 and Fig.8, in each process of
the heat cycle, getting the temperature field and
stress field changing with time. It can be seen in the
process of cooling with water, the temperature in V
groove of the specimen reduces by the time changes
gradually. At the cooling time of 6 seconds, the
temperature in the position of crack tip reaches a
minimum value at 92.897 ℃,and the distribution of
temperature field basically makes the crack tip as the
center of a circle, presenting as a semicircle shape.
The more closer to the center position, the more
lower the temperature is, as the center of a circle
cooling in water, and it transfers heat in the way of
heat convection, leading to the lower temperature.
As presents in Fig.8, the maximum equivalent
stress is in the red region, and it is the position to be
easiest occurred crack initiation and propagation at
the different points of the time. But the maximum
equivalent stress of the v groove position (the red
zone) does not change with the time, and through the
verification of the experiment, which is basic
consistent with the position of the crack initiation,
therefore the position of thermal fatigue crack can be
predicted by the simulation effectively.
4.2 Numerical Simulation of Thermal
Fatigue Crack Propagation Path
The finite element simulation results of the thermal
fatigue crack propagation path and the Von mises
stress and strain are shown in Fig.9 and Fig.10.
(a)500 times (b)1000 times
Fig.9 Crack growth paths after different cycles of thermal
fatigue test. a 500 cycles. b 1000 cycles
(a)500 times(b)1000 times
Fig.10 The Von mises stress and strain in 500 cycles. a
The Von mises stress. b The Von mises strain.
Fig.9(a) shows the thermal fatigue propagation
path of the specimen under cycles of 500 times, and
the main crack has extended to 231.58 μm. During
the cycle of heating, the thermal strain produced due
to the heat expansion of the specimen, and the two
sides of specimen are bonded by copper wire,
causing the compressive stress. When the stress
exceeds the yield limit of the material, the
compressive plastic deformation will be induced.
While in the process of cooling, the specimen will
appear shrink deformation, but due to the
unrecoverable plastic deformation, resulting in the
tension stress, which is perpendicular to the crack
surface, causing the open of the crack. It can be seen
in Fig.10(a) and Fig.10(b),the Mises equivalent
stress and strain in the position of crack tip is the
largest, and it’s also the most easily extensible place
for cracks. With the thermal cycle times increased
gradually, the opening displacement of the crack
will increase gradually. The length of the main crack
increased to 580.62 μm, when the thermal fatigue
cycles up to 1000 times. Compared the Fig.10(a)
with Fig.4(a), and Fig.10(b) with Fig.4(b)
respectively, it can be found that the results of the
experiment is in accord with the ones of numerical
simulation analysis in the path of thermal fatigue
crack propagation and the position of crack

occurring. It indicated that the fatigue cracks can be
more accurately predicted in the path of thermal
fatigue crack propagation and the position of crack
occurring.Therefore, it will provide guidance for the
prevention of die casting mold’s failure in the actual
production.
5 CONCLUSION
The thermal fatigue experiment indicated that with
the increase of the thermal fatigue cycles, after the
thermal fatigue crack has initiated, the rate of the
primitively crack propagation is very high, and then
the speed decreases gradually and tends to be stable
at last.
The finite element simulation results indicated
that the thermal fatigue crack easily appears at the
area of maximum concentration of thermal stress
and also easily to be produced at the position with
larger difference of temperature. Besides, at the tip
of the thermal fatigue crack, it is easier to expand at
the position of the largest mises equivalent stress
and strain.
Compared with the results of the experiment and
the simulation, it can be found that the results of the
experiment is in accord with the ones of numerical
simulation analysis in the path of thermal fatigue
crack propagation and the position of crack
occurring. Therefore, it will provide guidance for the
prevention of die casting mold’s failure in the actual
production.
REFERENCES
1. Wang RB. Research on failure analysis and selection
andstrengthen treatment of die-casting die of the
aluminum alloy [J]. Die Mold Manufacturing, 2008.
2. Leo B. Prediction of life to thermal fatigue crack
initiation of die casting dies[J].International
Conference on Tooling, 1999, 5:225-234.
3. Chemvavsk A. Method of analysis of development of
a network of thermal cracks[J]. Strength of Materials,
1990, 22:404-412.
4. Zhu RC, Li YD, Wang CY, et al Thermal fatigue
analysis of aluminum alloy die casting mold[J].
Special Casting Nonferrous Alloys, 2010, 30:224-226.
5. Fu MW, Lu J,Chan WL. Die fatigue life improve-ment
through the rational design of metal-forming
system.Journal of Materials Processing Technology,
2009, 209:1074-1084.
6. Tian GH. Analysis of the factors affecting thedie-
casting die life[J]. Die Mould Industry, 2005, 1:54-
58.
7. Fu M W, Yong M S, Muramatsu T. Die fatigue
lifedesign and assessment via CAE simulation[J].
International Journal of Advanced Manufacturing
Technology, 2008, 35(9-10):843-851.
8. Zhang H, Lu Z. Thermal deformation of die casting
die and its counter-measures[J]. Special Casting &
Nonferrous Alloys, 2006, 26:229-230.
9. Srivastava A, Joshi V, Shivpuri R. Computer
modeling and prediction of thermal fatigue cracking in
die-casting tooling[J]. Wear, 2004, 256(1):38-43.
10. Damjan Klobčar, Janez Tušek. Thermal stresses in
aluminium alloy die casting dies[J]. Computational
Materials Science, 2008, 43(4):1147-1154.
11. Long A, Thornhill D, Armstrong C, et al. Predicting
die life from die temperature for high pressure dies
casting aluminium alloy[J]. Applied Thermal
Engineering, 2012, 44(2):100-107.
12. Ming Y, Sun Z L, Qiang Y, et al. FEM Simulation of
Initial Cracking Process Due to Thermal Fatigue[J].
Journal of Northeastern University, 2007,
28(12):1741-1744..
13. Paffumi E, Nilsson K F, Taylor N G. Simulation of
thermal fatigue damage in a 316L model pipe
component[J]. International Journal of Pressure
Vessels & Piping, 2008, 85(11):798-813.
14. Fajdiga G, Sraml M. Fatigue crack initiation and
propagation under cyclic contact loading[J].
Engineering Fracture Mechanics, 2009, 76(9):1320-
1335.
15. Remes H, Varsta P, Romanoff J. Continuum approach
to fatigue crack initiation and propagation in welded
steel joints[J]. International Journal of Fatigue, 2012,
40(40):16-26.
16.
Shang D G, Yao W X, Wang D J. A new approach to
the determination of fatigue crack initiation size[J].
International Journal of Fatigue, 1998, 20(9):683-687.
