
Study of the State of Charge for Lithium-ion Batteries Based
on Real-time Electrochemical Impedance Spectroscopy
G B Zhong
1
, C Cheng
2,*
, K Q Xu
1
, D Chen
2
and J Y Xiang
2
1
Electric Power Research Institute of Guangdong Power Grid Co. Ltd., Guangzhou
510080, Guangdong, China.
2
Narada Power Source Co. Ltd., Zhejiang 311300, Hangzhou, China.
Corresponding author and e-mail: C Cheng, Mindy.chengcheng@foxmail.com.
Abstract. The state of charge (SOC) prediction of Li-ion batteries is always a tough topic.
Many methods such as current integration, open circuit voltage etc have been widely used in
industry. The dynamic impedance |Z| and the phase angle θ, what contain not only the internal
resistance but also the electrochemical and concentration polarization if perturbation
frequencies are appropriate. In this paper, the 10Ah lithium-ion phosphate (LiFePO
4
) battery
was used for the real-time electrochemical impedance spectroscopy (EIS) research without
statics during charge/discharge. EIS analysis results indicated that the θ and |Z| have a strong
relevance with SOC especially at the frequencies of 0.025Hz and 1Hz when charging and
discharging, respectively. This provides a technical reference for SOC prediction of Li-ion
batteries.
1. Introduction
Li-ion batteries have been widely used on mobile phones, digital products, electrical vehicles and
large-scale energy storage, etc. Battery management system plays an important role on cell safety and
energy conversion efficiency. Therefore, the research on battery management system is becoming
more and more important. The exact estimation of SOC is the key to premise to sound operation of
battery management [1]. Various techniques that already been applied in industry such as current
integration, DC internal resistance, open circuit voltage are always imprecise [2]. To this, a reliable
and accurate SOC algorithm under real user conditions has not been proposed successfully but
urgent.
Compared with those of other Li-ion batteries, the voltage range of the discharge platform of
LiFePO
4
batteries is relatively small. Therefore, the open circuit voltage measurement is seldom
used. In addition, the ampere integral method cannot accurately estimate the initial SOC and the
cumulative effect of coulomb efficiency on the error [3]. Through analyzing the working principle of
Li-ion batteries and EIS measurement in detail, the advantages of EIS measurement over DC internal
resistance method are obvious, that EIS analysis can provide full information of electrochemical
interface, providing in-situ and non-destructive electrochemical reaction mechanism inside the
batteries. The measurement of EIS contains a series of AC signals at different frequencies, which can
reflect many electrochemical characteristic paraments of the battery and kinetic information of the
related reactions [4]. Thus, the EIS measurement will be more accurate to estimate the SOC of a
battery.
598
Zhong, G., Cheng, C., Xu, K., Chen, D. and Xiang, J.
Study of the State of Charge for Lithium-Ion Batteries Based on Real-time Electrochemical Impedance Spectroscopy.
In Proceedings of the International Workshop on Materials, Chemistry and Engineering (IWMCE 2018), pages 598-603
ISBN: 978-989-758-346-9
Copyright © 2018 by SCITEPRESS – Science and Technology Publications, Lda. All rights reserved
In normal case, establishing equivalent circuit to fit the impedance spectroscopy is usually
adopted [5]. The SOC prediction model is established though analyzing the electrochemical
parameters, for example the ohmic internal resistance R
ohm
, the charge transfer resistance R
ct
and
double-layer capacitance C
dl
, the Warburg impedance caused by concentration polarization and so
on. In this paper, the dynamic impedance |Z| and the phase angle θ are introduced. |Z| is a complex
impedance, whose square equals to the sum of squares of the real and imaginary parts. θ starts from
the origin of the coordinate axis to the slope of each point in the frequency domain, whose tangent
equals to the ratio of the imaginary part to the real part. |Z| and θ can reflect the change of ohmic and
polarization resistance inside the battery during charging and discharging. This paper mainly focuses
on the change of dynamic impedance |Z| and phase angle θ in the low frequencies region (<1Hz).
2. Experiment
The experimental battery is a commercial LiFePO
4
battery produced by Narada. Model: FE10A,
Nominal voltage/capacity: 3.2V/10Ah. In order to obtain the dynamic impedance at different SOC,
the 5V/5A LANHE equipment and 24V/10A Modulab-Xm (Solartron) electrochemical workstation
are used to conduct 0.2C charge-discharge experiment and dynamic impedance analysis respectively.
The standard charge test will not only affect the real-time impedance, but also increase the error
of SOC estimation. To address this problem, the charge and discharge capacity of this battery are
checked out for three times to take the average under 0.2C current density by nominal capacity
(10A), as shown in Table 1.
Table 1. The charge-discharge capacity in three times.
1st 2nd 3rd Average 0.2C
4
Char
g
e capacit
y
/mAh 12032 11779 11823 11878 2376
Discharge capacity/mAh 11676 11594 11656 11642 2328
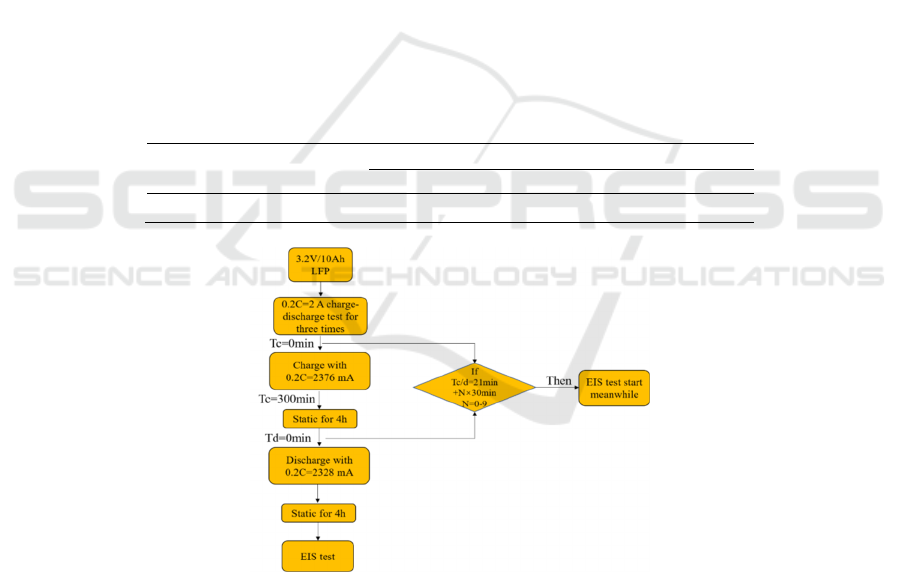
Figure 1. The flow chart of experiment test.
Many tests have been studied repeatedly to find the relationships between electrochemistry
paraments and SOC, such as placing different statics times, different charge/discharge current or
temperature [4]. However, in this experiment the LANHE machine and Modulab-Xm are used for
charging and discharging with no statics times and EIS analysis for every 10% SOC during charging
and discharging process simultaneously. There is 4h for standing between charge and discharge
processes to ensure that the battery is completely depolarized. 5mV potential disturbance and the test
frequency of 10K-0.01Hz are used in the EIS analysis. The accuracy of the test is guaranteed by
Study of the State of Charge for Lithium-Ion Batteries Based on Real-time Electrochemical Impedance Spectroscopy
599
setting the cut-off point of each impedance analysis as the cut-off point of each 10% SOC during
charge-discharge. Results show that the impedance analysis lasts about 9 minutes in this frequencies
domain. Inevitably, the impedance data at 100% SOC(Charge) and 0% SOC(Discharge) may not be
accurate because of the distinction from the time required for each EIS analysis at different SOC.
Here, we utilize the floating mode (L0) of the Modulab-Xm workstation to reduce and eliminate the
interference of alternating current (AC) signals during charging and discharging. The flowchart of the
whole experiment is shown in Figure1.
3. Results and discussion
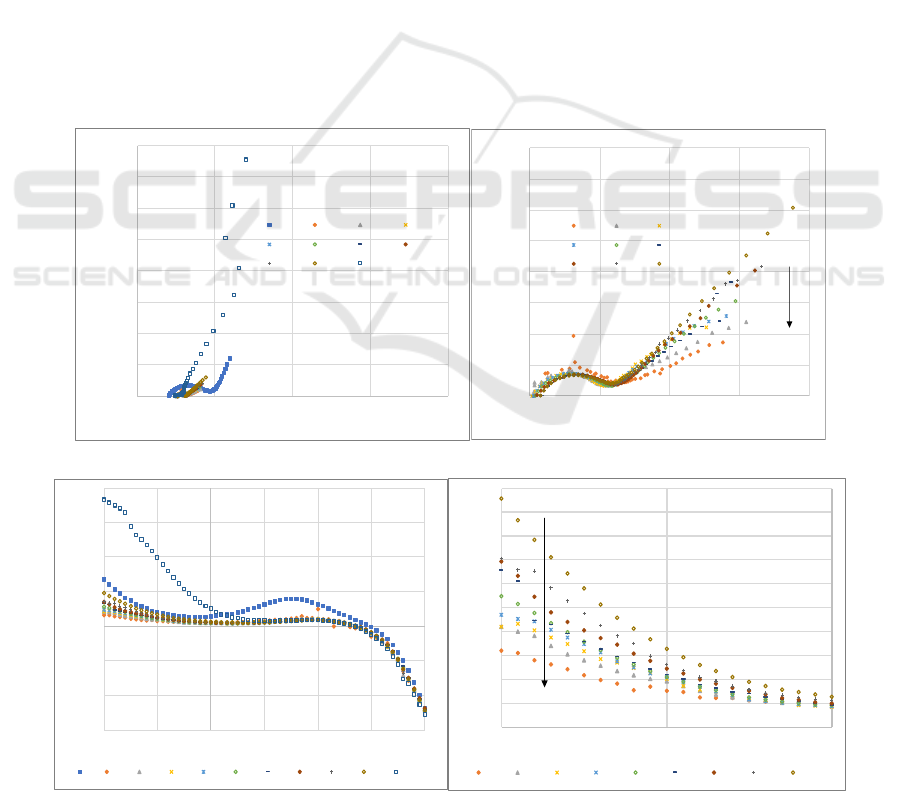
3.1. EIS analysis during charge
The Nyquist semicircle in Figure 2(A) indicate that the charge transfer resistance of 0% SOC/100%
SOC is maximum/minimum respectively. Figure 2(B) shows the different EIS diagrams when the
SOC cuts off from 90% to 10% during charge. Generally, the impedance is higher in full/empty
charge of battery than other states. In addition, the relevance between frequency and phase angle are
very strong when the frequency change from 1Hz to 0.01Hz. Figure 3 and Figure 4 show the
variation of phase angle with SOC at different frequencies during charge.
Research suggests that the smaller the disturbance frequency is, the more obvious the phase angle
responds to SOC [5-6]. After analyzing the SOC-θ graph at frequencies of 0.1Hz, 0.025Hz and
0.01Hz, we find that the linear relationship between them is the most obvious at the frequency of
0.025Hz. Therefore, when using the phase angle to predict SOC during charge, 0.025Hz is
researched as the key.
Figure 2. The EIS diagrams for different SOC during charge.
Figure 3. The Frequency-Phase angle diagrams for different SOC during charge.
-0.04
-0.035
-0.03
-0.025
-0.02
-0.015
-0.01
-0.005
0
0 0.01 0.02 0.03 0.04
Zim/Ω
Zre/Ω
0% 10% 20% 30%
40% 50% 60% 70%
80% 90% 100%
A
-0.004
-0.0035
-0.003
-0.0025
-0.002
-0.0015
-0.001
-0.0005
0
0.005 0.006 0.007 0.008 0.009
Zim/Ω
Zre/Ω
10% 20% 30%
40% 50% 60%
70% 80% 90%
SoC
B
-80
-60
-40
-20
0
20
40
60
0.01 0.1 1 10 100 1000 10000
Theta/degree
Frequency/Hz
0% 10% 20% 30% 40% 50% 60% 70% 80% 90% 100%
C
-20
-18
-16
-14
-12
-10
-8
-6
-4
-2
0
0.01 0.1 1
Theta/degree
Frequency/Hz
10% 20% 30% 40% 50% 60% 70% 80% 90%
D
SoC
IWMCE 2018 - International Workshop on Materials, Chemistry and Engineering
600
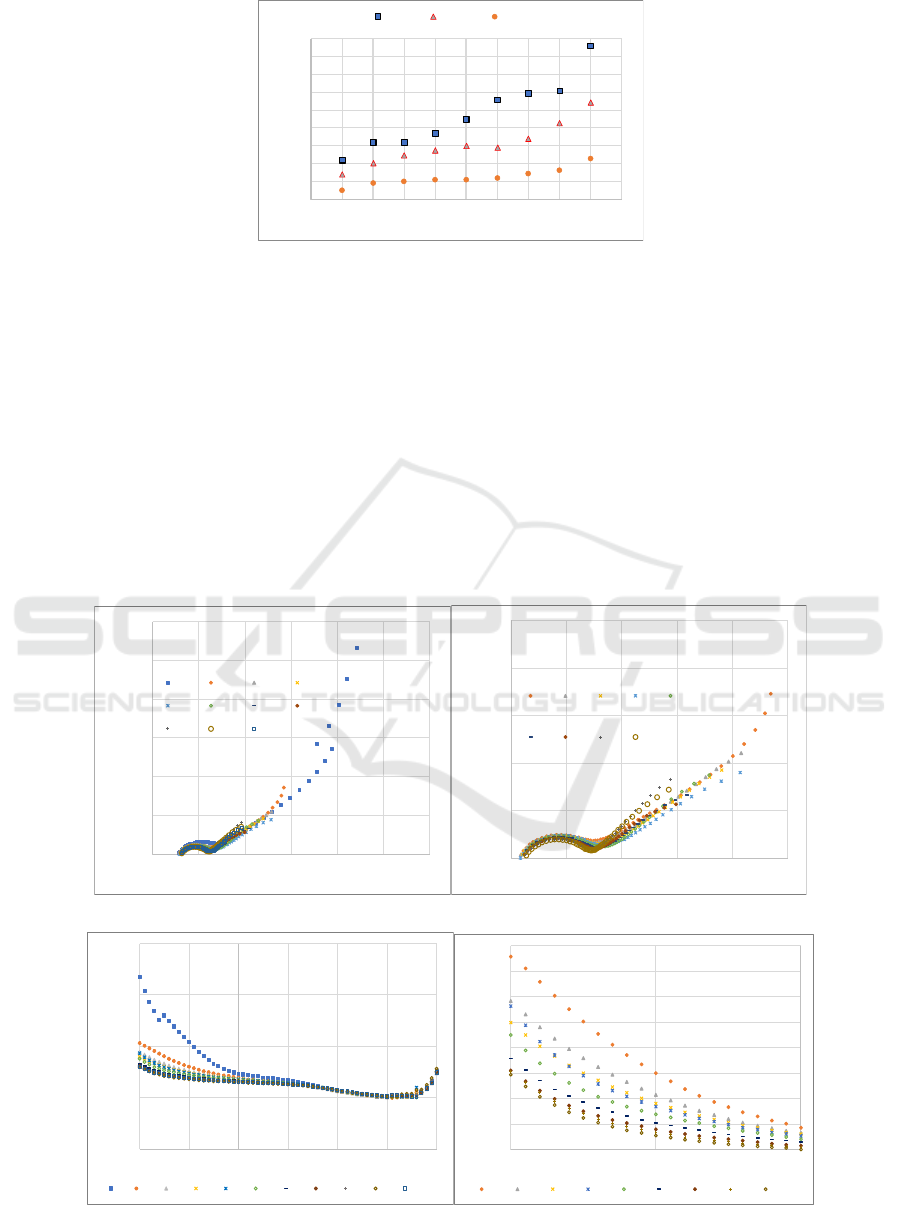
Figure 4.The variation of phase angle with SOC at different frequencies.
3.2. EIS analysis during discharge
Figure 5 and Figure 6 show the EIS diagrams and the Frequency -|Z| for different SOC during
discharge, which the |Z| represents the dynamic total impedance in the EIS analysing. Due to the time
required to complete the EIS analysis in this frequency domain are inconsistent at different SOC, the
impedance test in low frequencies is inaccurate when charging to 100% SOC or discharging to 0%
SOC. Unlike charging, the impedance of discharging at 0% SOC is the highest and no significant
relationships between the SOC and θ. However, the relevance between SOC and |Z| is strong in low
frequencies. Figure 7 shows the variation of dynamic impedance with SOC at above three
frequencies.
The results show that the dynamic |Z| impedance increase accordingly when the SOC reduce from
90% to 10% in a certain frequency range. The linear relationship between |Z| and SOC is the
strongest especially at the frequency of 1Hz.
Figure 5. The EIS diagrams for different SOC during discharge.
Figure 6.The Frequency-|Z| for different SOC during discharge.
-20
-18
-16
-14
-12
-10
-8
-6
-4
-2
0% 10% 20% 30% 40% 50% 60% 70% 80% 90% 100%
Theta/degree
SOC
0.01Hz 0.025Hz 0.1Hz
-0.012
-0.01
-0.008
-0.006
-0.004
-0.002
0
0.004 0.006 0.008 0.01 0.012 0.014 0.016
Zim/Ω
Zre/Ω
0% 10% 20% 30%
40% 50% 60% 70%
80% 90% 100%
A
-0.005
-0.004
-0.003
-0.002
-0.001
0
0.005 0.006 0.007 0.008 0.009 0.01
Zim/Ω
Zre/Ω
10% 20% 30% 40% 50%
60% 70% 80% 90%
B
0
0.005
0.01
0.015
0.02
0.01 0.1 1 10 100 1000 10000
|Z|/Ω
Frequency/Hz
0% 10% 20% 30% 40% 50% 60% 70% 80% 90% 100%
A
0.0065
0.007
0.0075
0.008
0.0085
0.009
0.0095
0.01
0.0105
0.01 0.1 1
|Z|/Ω
Frequency/Hz
10% 20% 30% 40% 50% 60% 70% 80% 90%
B
Study of the State of Charge for Lithium-Ion Batteries Based on Real-time Electrochemical Impedance Spectroscopy
601
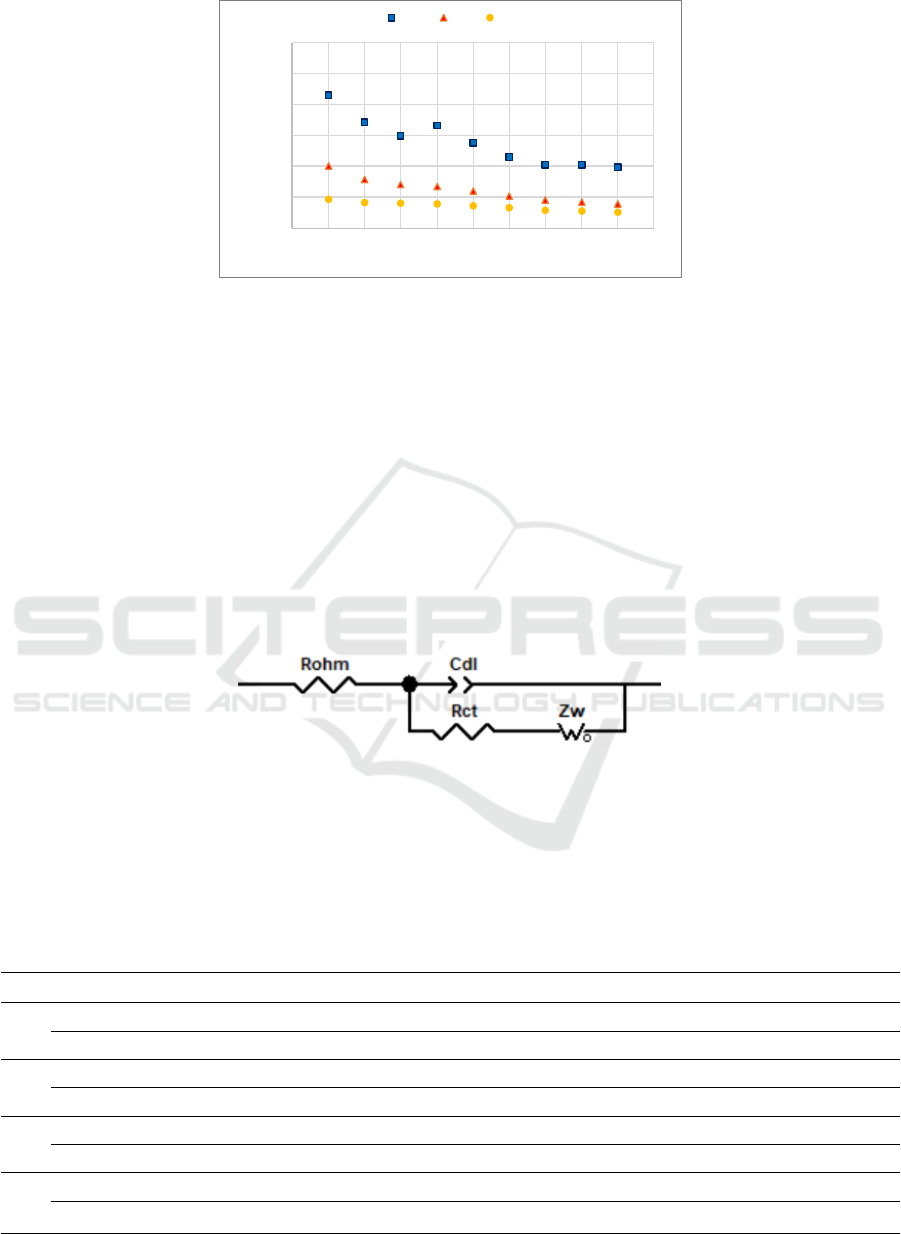
Figure 7.The variation of dynamic impedance with SOC at different frequencies.
3.3. The study on the variation of EIS parameters with SOC
The equivalent fitting circuit is set up according to the EIS diagram in the charging/discharging
process as shown in Figure 8. The ohmic internal resistance R
ohm
includes the connection and contact
internal resistance, the resistance of cathode/anode, separator and electrolyte. Both the charge
transfer resistance R
ct
and the Warburg impedance Z
w
caused by concentration polarization belong to
the polarization internal resistance. The electrochemical polarization is caused when the electrode
reaction cannot keep up with the charge accumulation speed, the larger the current density is, the
faster the charge accumulates, and the value of R
ct
will be greater. The Warburg impedance Z
w
is
related to the solid-state diffusion of Li-ions in the active material particles, which reflects the
Warburg diagonal in low frequency section. The double-layer capacitance C
dl
belongs to the
interfacial capacitance, the parallel connection of R
ct
/C
dl
represent the Nyquist semicircle.
Figure 8. The corresponding equivalent fitting circuit based on the EIS diagram.
The EIS plot is fitted by the equivalent circuit which established above. The changes of different
EIS parameters with SOC during charge-discharge are exhibited as Table 2 and Figure 9. When
removing the two points of 0%/100% SOC, we can find that the R
ohm
and C
dl
increase as the
augmentation of SOC. However, the linear relationships between R
ohm
and SOC are the strongest.
Table 2. The different impedance parameters obtained by equivalent circuit fitting.
SOC 0% 10% 20% 30% 40% 50% 60% 70% 80% 90% 100%
R
o
hm
Charge 3.95 5 5.05 5.1 5.11 5.14 5.21 5.17 5.21 5.2 4.81
Discharge 5.25 5.17 5.19 5.2 5.21 5.22 5.23 5.24 5.25 5.28 5.29
R
ct
Charge 5.52 0.97 0.87 0.86 0.92 0.9 0.91 0.96 0.87 0.9 0.89
Discharge 1.21 1.25 1.17 1.24 1.29 1.28 1.21 1.14 1.15 1.07 1.09
C
dl
Charge 6.28 2.2 4.17 4.8 5.29 5.17 5.66 6.3 5.22 5.87 8.25
Discharge 2.3 5.51 4.6 5.2 5.67 6.15 5.83 5.8 6.72 5.82 5.39
Z
w
Charge 41 3.52 3.31 4 3.61 4.48 6.11 5.42 6.21 8.37 86.1
Discharge 23.8 16.7 13.6 11.1 5.12 5.4 4.27 3.53 5.25 3.9 4.49
0.006
0.007
0.008
0.009
0.01
0.011
0.012
0% 10% 20% 30% 40% 50% 60% 70% 80% 90% 100%
|Z|/Ω
SOC
0.01Hz 0.1Hz 1Hz
IWMCE 2018 - International Workshop on Materials, Chemistry and Engineering
602
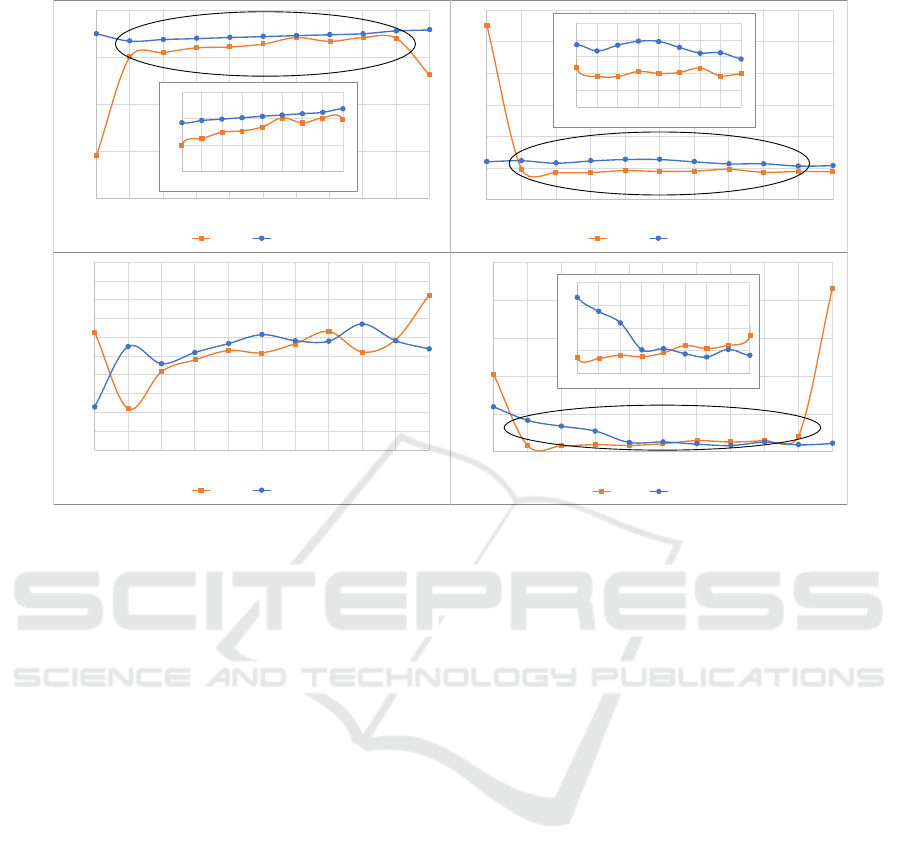
Figure 9.Changes of different EIS parameters with SOC.
The results indicate that it is the most accurate and reliable to predict SOC through the phase
angle θ and the dynamic impedance |Z| especially at 0.025Hz and 1Hz when charging and
discharging.
4. Conclusions
In normal case, establishing equivalent circuit to fit the electrochemical impedance spectroscopy is
usually adopted. The method of analyzing the variation of dynamic total impedance and different
electrochemical paraments with SOC have been used in this paper. During this process, the
3.2V/10Ah LiFePO
4
battery has been used in charge and discharge state without static. This method
not only fits the actual conditions well but also can reduce the error caused by fitting, thus increasing
the reliability of the prediction. EIS analysis results show that the phase angle and the dynamic
impedance is proportional/inversely proportional to SOC in a certain frequency domain when
charging/discharging respectively. This provides a technical reference for SOC prediction of Lithium
ion batteries in varied dynamic conditions.
Acknowledgements
This work was supported by Scientific Research Project of China Southern Power Grid (NO.
GDKJXM00000039).
References
[1] Pop V, Bergveld H J, Danilov D and et al. 2008 Springer Netherlands 181-220 9.
[2] Asakura K, Shimomura M and Shodai T 2003 Journal of Power Sources 119-121 902.
[3] Bergveld H J, Kruijt W S and Notten P H L 2008 Springer Netherlands 9-30 86.
[4] Mingant R, Bernard J, Moynot V S and et al. 2011 Ecs Transactions 41-53 33.
[5] Xie C J, Liu J B and Zhao H B 2013 Advanced Materials Research 509-512 823.
[6] Brandell D, Srivastav S and Lacey M 2015 Meeting of the International Society of
Electrochemistry in Taipei 55-61 56.
3.5
4
4.5
5
5.5
0 102030405060708090100
Rohm/mΩ
SoC/%
Charge Discharge
4.8
5
5.2
5.4
10 20 30 40 50 60 70 80 90
0
1
2
3
4
5
6
0 102030405060708090100
Rct/mΩ
SoC/%
Charge Discharge
0.5
0.7
0.9
1.1
1.3
1.5
10 20 30 40 50 60 70 80 90
0
1
2
3
4
5
6
7
8
9
10
0 102030405060708090100
Cdl/F
SoC/%
Charge Discharge
0
20
40
60
80
100
0 102030405060708090100
Zw/mΩ
SoC/%
Charge Discharge
0
5
10
15
20
10 20 30 40 50 60 70 80 90
Study of the State of Charge for Lithium-Ion Batteries Based on Real-time Electrochemical Impedance Spectroscopy
603
