
Study of Absorption and Fluorescence Spectra of
Iodomethane Molecules by Solvent Effect
F Yao, N Ning, J H Li, Y Wang, Y J Zhai and W H Fang
*
Key Laboratory of Nanohotonics and Biophotonics of Jilin Province, School of Scie
nce, Changchun University of Science and Technology, Changchun 130022, China
Corresponding author and e-mail: W H Fang, whfang@cust.edu.cn
Abstract.The absorption spectra and fluorescence spectra and their haracteristics of
iodomethane (CH
3
I) excited by ultraviolet light were analyzed experimentally. It was found
that methyl iodide had a good absorption of 280-375 nm ultraviolet light and obvious
fluorescence was emitted at 280-320 nm ultraviolet light excitation; CH
3
I-toluene mixed
solutions with different ratio on volume were excited at the light with the wavelength of
300nm. It was found that the fluorescence intensity gradually increased with the increase of
toluene volume ratio and a basic linear relationship was shown. We also measured the
fluorescence spectra of the CH
3
I-ethanol mixed solutions at different wavelengths of
ultraviolet light, and variation of the fluorescence intensity of the CH
3
I-ethanol solutions
with different mixing ratio is also different. In additional, we are giving the mathematical
expression of the fluorescence peak position of the mixed solution. This give some reference
significance of the solvent effect and the study of CH
3
I molecular dynamics by the spectrum.
1. Introduction
In the industrial field, CH
3
I is an important downstream industrial product of coal chemical industry.
It is also a precursor of many methylation reactions [1, 2]. CH
3
I is a typical molecular theoretical and
experimental model in the laboratory, which plays an important role in the kinetics of photolysis [3, 4]
and thermal cracking. However, CH
3
I is easily decomposed by heat and can produce toxic iodide flue
gas, which can be absorbed by respiratory tract, digestive tract and skin, so it is very important for
quantitative analysis. At present, the quantitative analysis by gas chromatography [5] is an analytical
method widely used in analytical laboratories. This method determines the content of the components
to be measured in a sample. Standard samples are also useful for spectrophotometric analysis of trace
amounts of CH
3
I. Based on the molecular fluorescence spectrum analysis (MFS)[6]
is the use of
certain substances produced by ultraviolet or visible light irradiation after can reflect the material
characteristics of the fluorescence, and carries on the qualitative and quantitative analysis, is widely
used and the promising a spectrum analysis technology. Using this technique, we studied the
corresponding absorption and fluorescence spectra [7, 8, 9] of CH
3
I. The results showed that CH
3
I [9]
can emit strong fluorescence under the excitation of 280-320 nm UV light. The fluorescence
characteristics were characterized in this paper.
Yao, F., Ning, N., Li, J., Wang, Y., Zhai, Y. and Fang, W.
Study of Absorption and Fluorescence Spectra of Iodomethane Molecules by Solvent Effect.
In Proceedings of the International Workshop on Materials, Chemistry and Engineering (IWMCE 2018), pages 519-529
ISBN: 978-989-758-346-9
Copyright © 2018 by SCITEPRESS – Science and Technology Publications, Lda. All rights reserved
519
2. Experimental device and experimental method
2.1. A subsection experimental device
The absorption spectrum of this experiment is based on the Gary 5000 UV-Vis-NIR
spectrophotometer, light source: xenon lamp, mercury lamp, among which the mercury lamp is used
for wavelength calibration to ensure the accuracy of the instrument for long-term use of the
wavelength, and the three light sources are automatically switched. Monochromator: Heteropoly
Littorow monochromator, dual monochromator design. Detectors: High-sensitivity photomultipliers
and semiconductor-cooled PbS. The fluorescence spectrum was measured using a Gary Eclipse
fluorescence spectrophotometer with a horizontal light source: a flashing xenon lamp with a pulse
width at half maximum of less than 2 microseconds, a power relative to 75 kW when continuously
illuminated, and a Cheney-Turner monochromator, ultra low Stray light.
2.2. Reagents
The CH
3
I, toluene and ethanol used in the test were all manufactured by AKCO Reagents. In the
experiment, CH
3
I was separately mixed with toluene and ethanol as solvents, and the corresponding
concentrations were formulated according to the volume ratio.
2.3. Test methods
When measuring the absorption spectrum of CH
3
I, toluene is used as a reference. When the
absorption spectrum of a CH
3
I-ethanol mixed solution is measured, ethanol is used as a reference.
When the absorption spectrum of the CH
3
I-toluene mixed solution is measured, toluene is used as a
reference. When measuring the fluorescence spectrum of CH
3
I, the width of the slit is 20 nm, and a
group of excitation light of a control group is selected according to the absorption band, followed by
excitation, and the spectrum is collected.
3. Experimental results
3.1. Absorption spectrum experiment
In this experiment, we used the different volume ratio of CH
3
I mixed solution to scan the whole
spectrum to get the absorption spectrum.
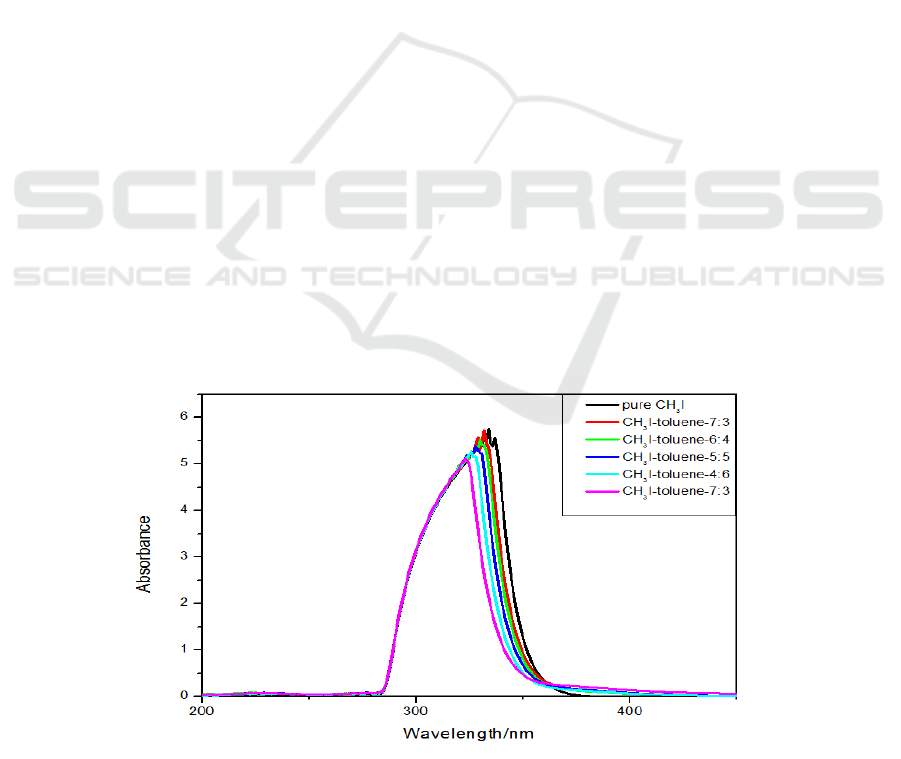
Figure 1. Absorption spectra of pure CH
3
I and mixed solutions of CH
3
I-toluene at different volume
ratios.
IWMCE 2018 - International Workshop on Materials, Chemistry and Engineering
520
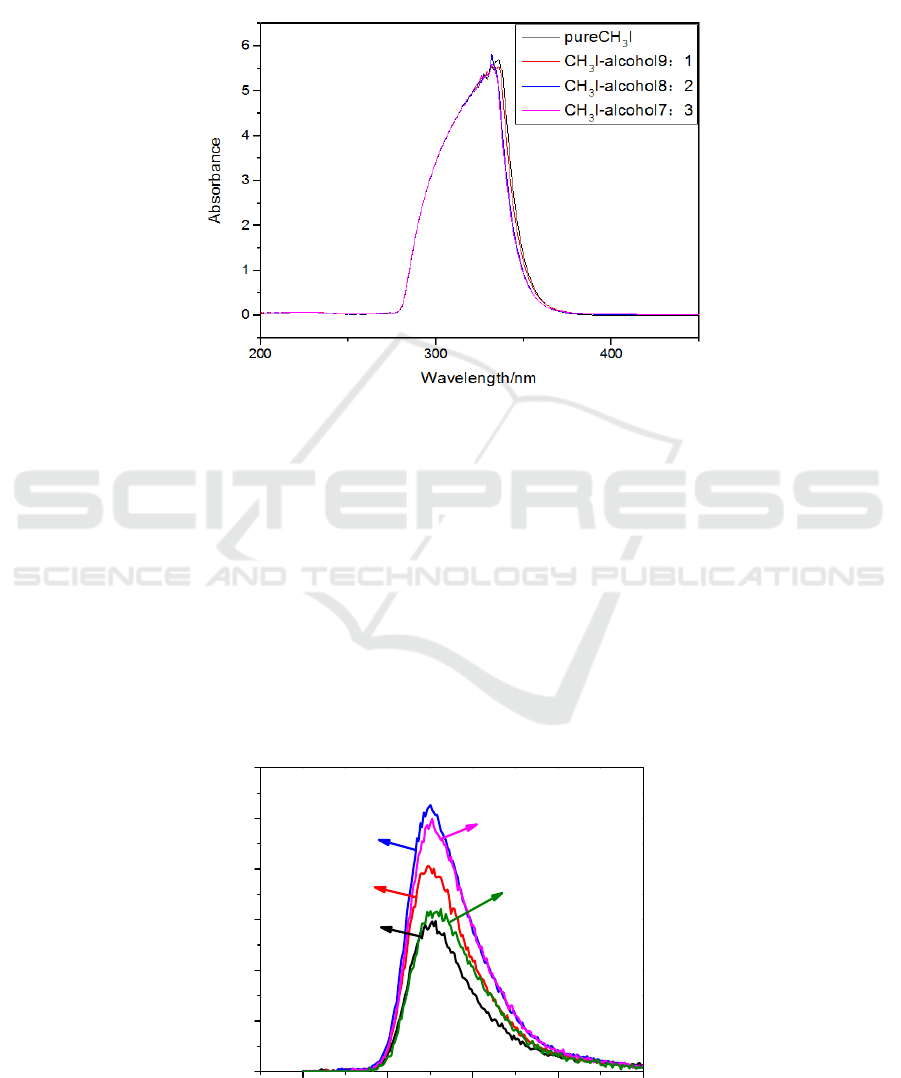
Figure 1 shows that in the spring, CH
3
I absorbs ultraviolet light from 280 to 375 nm, its
absorbance reaches a maximum at 337 nm, and there is almost no absorption after 375 nm, and the
absorption band width is 298 to 344 nm in luminosity. The process of rapid decline after reaching the
maximum.
Figure 2. Absorption spectra of pure CH
3
I and mixed solutions of CH
3
I-ethanol at different volume
ratios.
Comparing the absorption spectra of the CH
3
I-toluene mixed solution, only four control groups
were given in this experiment. It can be seen from the figure 2 that the ethanol solution has less
influence on the absorption spectrum of CH
3
I. The absorption peak of the mixed solution shifts blue
as the volume ratio of ethanol solvent increases.
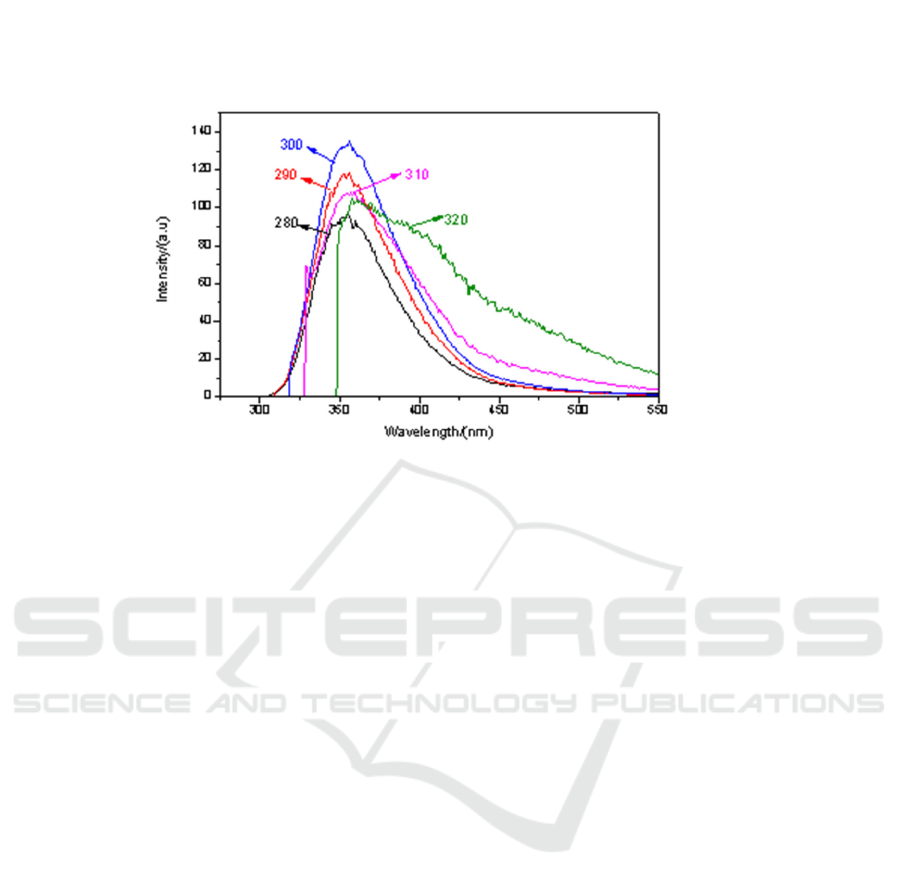
3.2. Fluorescence spectroscopic experiment of CH3I and its mixed solution
3.2.1. CH
3
I fluorescence spectrum experiment. We use 280-375 nm UV light as the excitation light,
and once every 10 nm [10]. The fluorescence spectrum is found at 280-320 nm UV. As Figure 3
shows that under the UV excitation light of 300nm, the fluorescence intensity of CH
3
I is the
strongest.
300 350 400 450 500
0
2
4
6
8
10
12
Intensity/(a.u)
Wavelength/(nm)
280
290
300
310
320
Study of Absorption and Fluorescence Spectra of Iodomethane Molecules by Solvent Effect
521
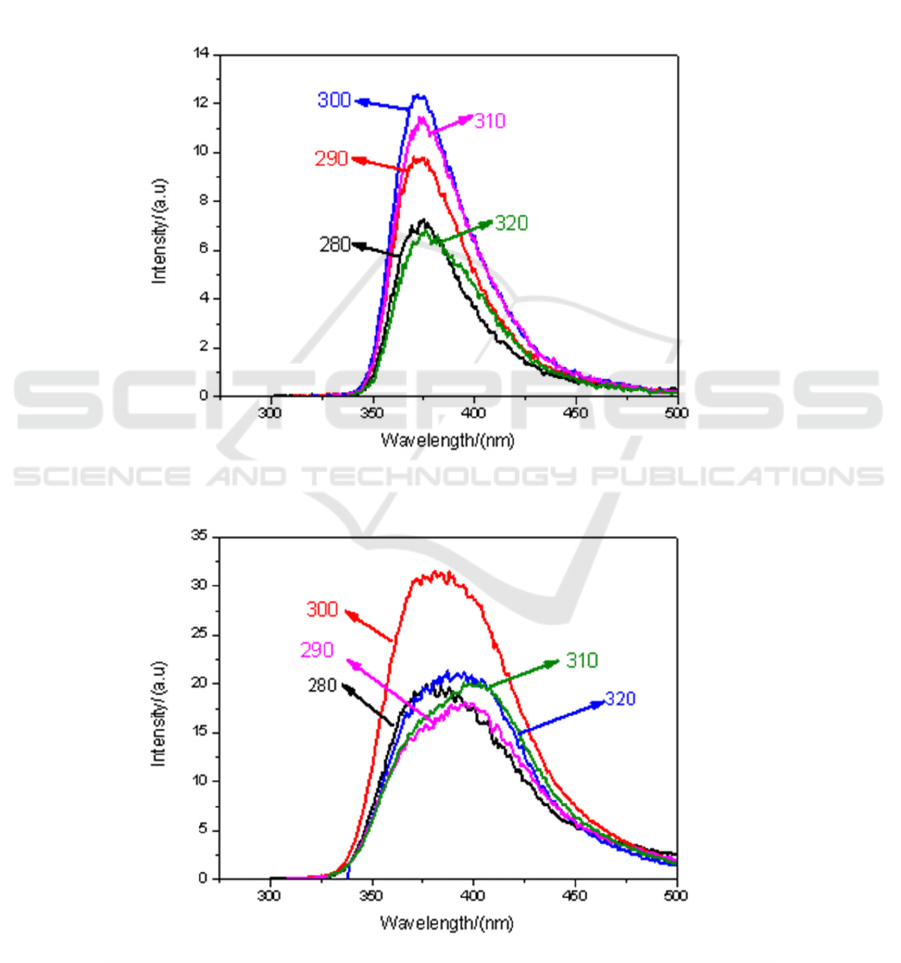
Figure 3. Fluorescence spectra of CH
3
I solution under different excitation light.
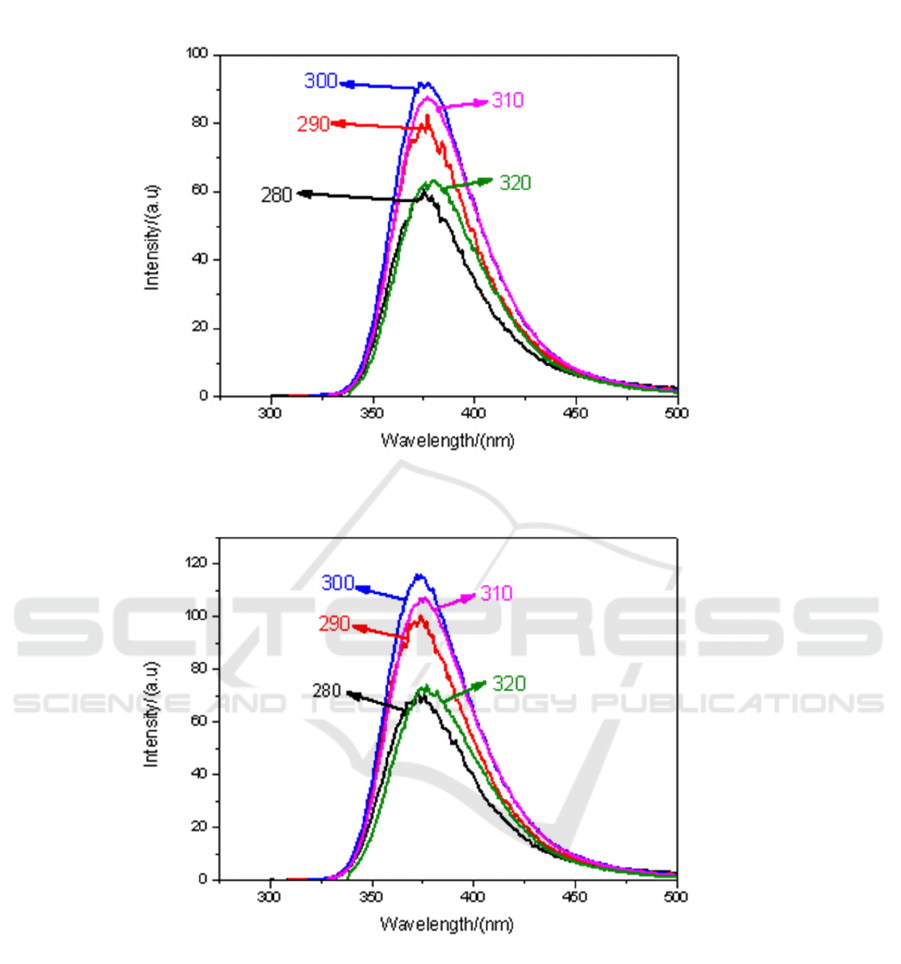
3.2.2. Fluorescence spectra of CH
3
I-ethanol solutions at different volume ratios. Under certain
wavelengths of UV excitation, CH
3
I and ethanol exhibit fluorescence characteristics. Mix the two at
different volume ratios, and excite them with different wavelengths of UV light to find out which
kind of excitation, and which kind of fluorescence ratio is the best. Figures 4(a) to (e) show the
fluorescence spectra of CH3I-ethanol solutions V
1
:V
2
in volume ratios of 1:9, 3:7, 5:5, 7:3, and 9:1
respectively, excited by ultraviolet light.
(a)
(b)
IWMCE 2018 - International Workshop on Materials, Chemistry and Engineering
522
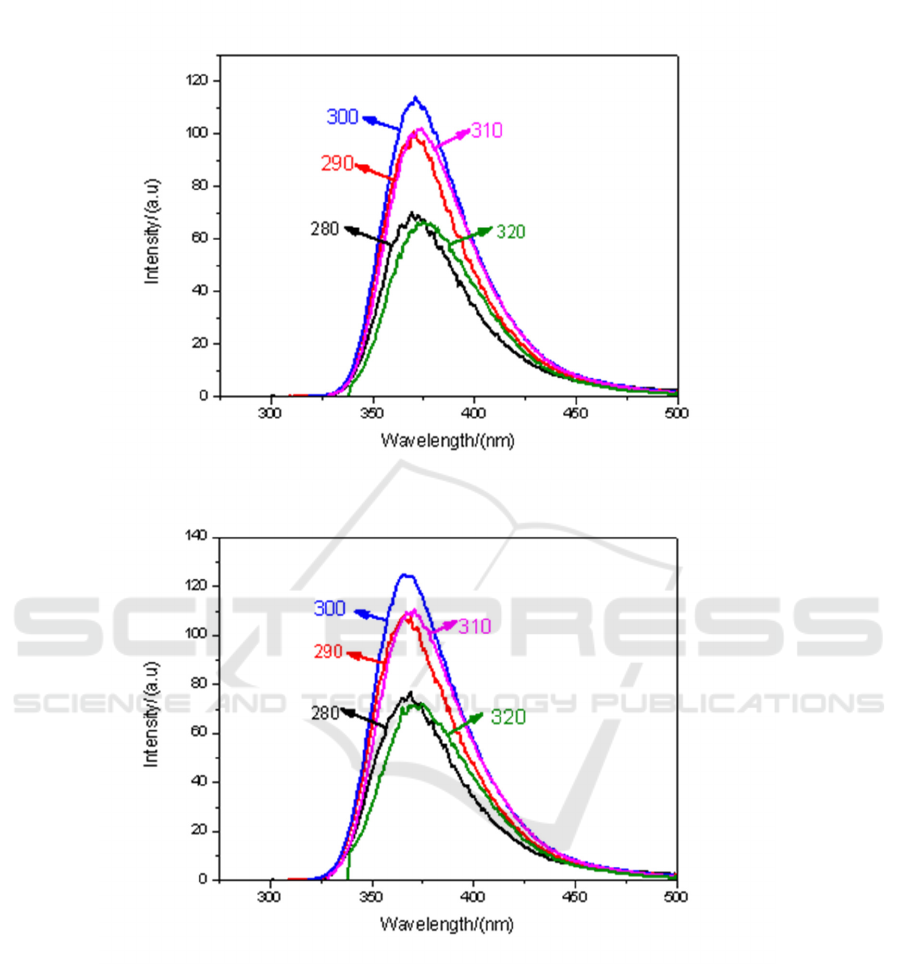
(c)
(d)
Study of Absorption and Fluorescence Spectra of Iodomethane Molecules by Solvent Effect
523
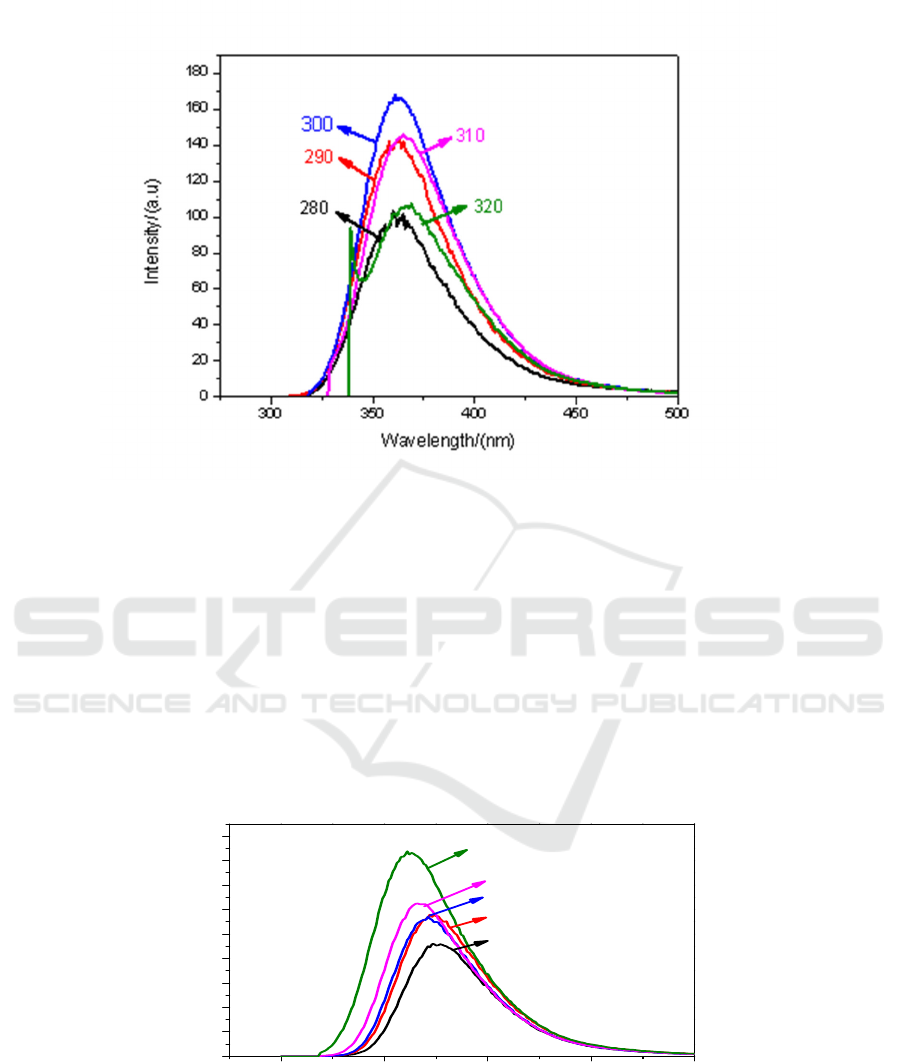
(e)
Figure 4. Fluorescence spectra of CH
3
I -ethanol solutions with different volume ratio under different
excitation light: (a) V1: V2 = 9:1; (b) V1: V2 = 7:3; (c) V1: V2 = 5:5; (d) V1: V2 = 3:7; (e) V1: V2
=1:9.
It can be seen from Figure 4. that with the increase of the volume ratio of ethanol solvent, the
fluorescence peak intensity of the mixed solution increases. When the volume ratio V1:V2 is 5:5
respectively, the fluorescence intensity is the strongest under the excitation light of 290 nm. In other
the fluorescence intensity was the strongest under the excitation light of 300 nm.
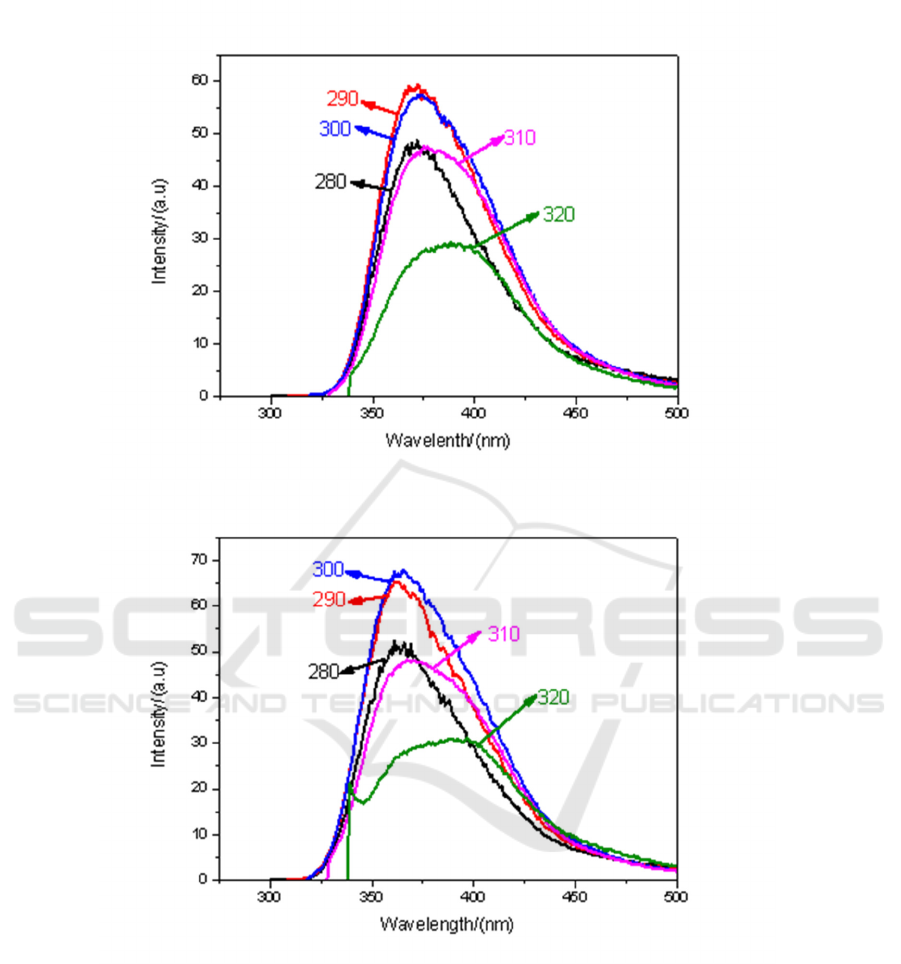
3.2.3. Fluorescence spectra of methyl iodide-toluene solution at different volume ratios. Under
different solvents, the fluorescence spectrum of CH
3
I mixed solution is also one of the topics we
discuss. Figure 5 (a) to (e) respectively show the fluorescence spectra of CH
3
I-toluene solutions in
volume ratios of 9:1, 7:3, 5:5, 3:7 and1:9, excited by ultraviolet light.
IWMCE 2018 - International Workshop on Materials, Chemistry and Engineering
524
(a)
(b)
Study of Absorption and Fluorescence Spectra of Iodomethane Molecules by Solvent Effect
525
(c)
(d)
IWMCE 2018 - International Workshop on Materials, Chemistry and Engineering
526
(e)
Figure 5. Fluorescence spectra of CH
3
I-toluene solutions with different volume ratio under different
excitation light: (a) V1: V3 = 9:1; (b) V1: V3 = 7:3; (c) V1: V3 = 5:5; (d) V1: V3 = 3:7; (e) V1: V3
=1:9.
It can also be seen from Figure 5. when the mixing ratio of 9:1, the fluorescence intensity is the
strongest under the irradiation of light with 300 nm.
In order to better demonstrate the effect of different volume ratio of mixed solution on the
fluorescence intensity and the position change corresponding to the strongest peak of fluorescence,
we chose 300nm excitation light to act on CH
3
I-toluene mixed solution to obtain the curve of
concentration and fluorescence intensity change. Figure 6 shows, 10% in the figure refers to
V1:V3=1:9, and so on.
300 350 400 450 500
0
20
40
60
80
100
120
140
160
180
Intensity/(a.u)
Wavelength/(nm)
%
10
%30
%50
%70
%90
Figure 6. The fluorescence peak intensity of mixed solutions of different concentrations in CH
3
I and
toluene at 300 nm excitation light.
From Figure 6 show as the volume ratio of solvent increases, the fluorescence intensity gradually
increases. When the volume ratio of CH
3
I -toluene mixed solution is V1:V3=1:9, the fluorescence
intensity is the strongest, which is almost the volume ratio V1:V3. = 2 times at 9:1.
Study of Absorption and Fluorescence Spectra of Iodomethane Molecules by Solvent Effect
527
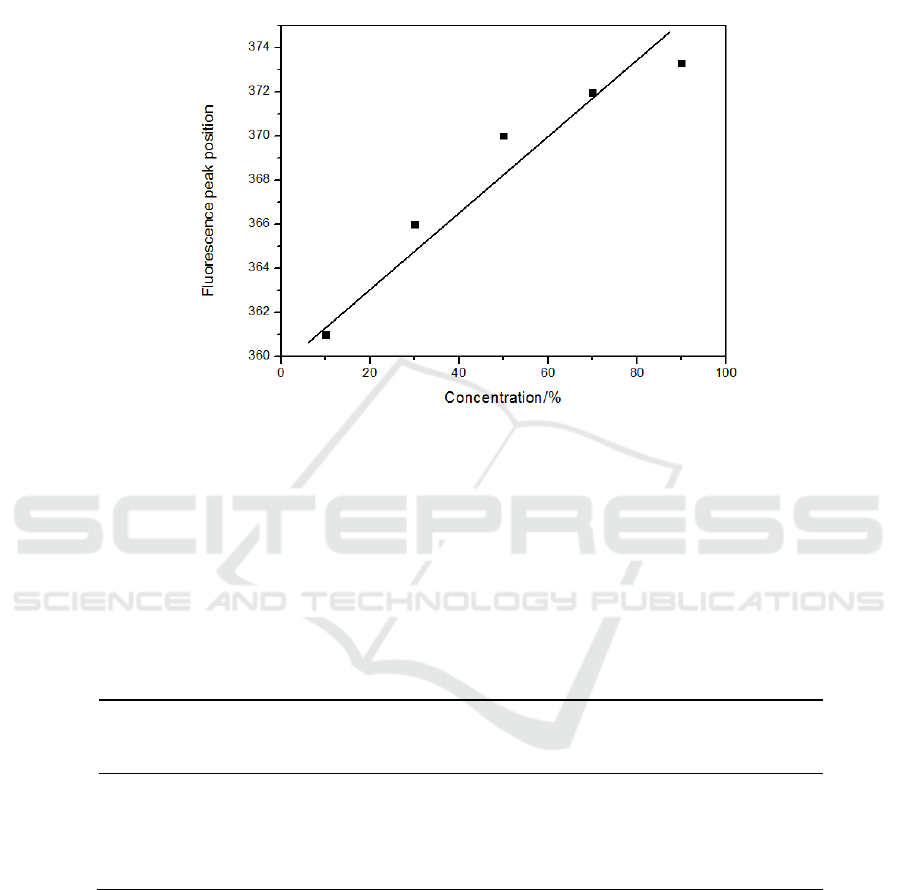
When the CH
3
I-toluene mixed solution was irradiated with 300 nm excitation light, the curve
showing the change of the peak intensity of the fluorescence with respect to the volume ratio was
shown in Figure 7.
Figure 7. Fluorescence peak position diagram of mixed solution of different concentrations of CH
3
I
and toluene at 300 nm excitation light.
From the above figure, it can be seen that with the increase of the volume ratio of the solvent, the
strongest fluorescence peaks are red-shifted and have a linear relationship.
Under UV excitation, the corresponding fluorescence position of the mixed solution with the
change of the volume fraction of CH
3
I is shown in Table 1.
4. Discussion and analysis
The relative intensity of the fluorescence from the excitation of the UV light after 320 nm is
relatively weak, it is almost not reflected in the superimposed image, so it is not drawn in this figure.
Because the wavelength corresponding to the maximum absorption intensity is close to the
absorption cutoff wavelength; the electron absorbs the photons and can return to the ground state
without radiation.
Spectrum, found that at a certain wavelength, there is the following mathematical relationship
between the fluorescence peak position λ = λ
1
· C
1
+ λ
2
· C
2
Table 1. Changes of the position of the strongest fluorescence peak of the
CH
3
I-toluene mixed solution with concentration and excitation wavelength.
Iodomethane
Volume
fraction/%
280nm 290nm 300nm 310nm 320nm
10
30
50
70
90
360
366
369
373
375
363
366
371
375
377
361
366
370
372
373
365
371
373
375
377
364
368
375
377
380
IWMCE 2018 - International Workshop on Materials, Chemistry and Engineering
528

λ:the fluorescence position of the mixed solution;λ
1
:the CH
3
I fluorescence position;λ
2
:the position
of the ethanol fluorescence;C
1
:the volume fraction of CH
3
I; C
2
:the volume fraction of ethanol in the
mixed solution.
5. Conclusions
In this paper, the UV absorption spectra and fluorescence spectra of CH
3
I solution were studied, and
the fluorescence spectra of different concentrations of CH
3
I solution, different volume ratio of mixed
CH
3
I-ethanol solution and CH
3
I-toluene solution were compared. Concluded the fluorescence
intensity of the CH
3
I-toluene solution is the strongest under the excitation light of 300 nm. This
provides adequate preparation for subsequent solvent effects and studies of enhanced stimulated
Raman scattering of CH
3
I.
Acknowledgment
This work is supported by the“111” Project of China (D17017), the National Natural Science
Foundation of China (21703017, 11604024), the Advance Recearch Project of Weapon and
Equipment (6140414020102), the Developing Project of Science and Technology of Jilin Province
(20180519017JH) , Nanophotonics and Biophotonics Key Laboratory of Jilin Province
(20140622009J),and the Project of Education Department of Jilin Province (JJKH20170611KJ,
JJKH20181101KJ, and JJKH20181106KJ). Science Foundation for Young Scientists of Changchun
University of science and technology (XQNJJ-2016-14).
References
[1] Nakajima S, Takaya H and Nakamura M 2017 Iron-catalyzed methylation of arylboron
compounds with iodomethane J. Chemistry Letters 46 (5) 711
[2] Li Y, Sun Y and Wang R 2014 The steam by-product of cyclohexanone is utilized J.
Chenmical Intermediate (10) 57-60
[3] Shao L 2014 Photodissociation dynamics of NO2 and CH3I with femosecond pump-probe
technique D. Jilin University
[4] Jiang B and Xie D Q 2012 Theoretical studies for photodissociation dynamics of small
molecules J. progress in chemistry 24(06) 1120-1128
[5] Hu D D 2017 Study on method of reducing errors in gas chromatographic analysis J.
Engineering Technology (3) 00319-00320
[6] Zhang Z W,Xinshun J and Cao G Q 2008 Molecular fluorescence spectroscopy and its
engineering applications J.physics bulletin (09) 56-57
[7] Wang Y J and Song Z F 1995 Spectral Analysis and Chromatogram Analysis Beijing
University Press
[8] Wei Y J, Li N and Qin S J 2004 Fluorescence spectra and fluorescence quantum yield of
sulfosalicylic acid Spectroscopy and Spectral Analysis 24(6) 647
[9] Wang S, Fang W, Li T, Li F, Sun C and et al 2016 An insight into liquid water networks
through hydrogen bonding halide anion: Stimulated Raman scattering J.Journal of Applied
Physics 119(16) 163104
[10] Xu H, Zhu T, Shi A M and Gu ED 2008 Study of 1-butanol absorption and fluorescence
spectra induced by UV-light J. Spectroscopy and Spectral Analysis 28(1) 178-182
Study of Absorption and Fluorescence Spectra of Iodomethane Molecules by Solvent Effect
529
