
Kinetic Modelling of the Hydrolysis of COS Catalyzed by
Titania Based CT6-8
R H Zhu
1,2,*
, H G Chang
1,2
, C Y Tu
1
, C R Wen
1,2
, J L He
1,2
, Z S Liu
1
, S J Zhang
1
,
X Ma
1
and X Y Li
1
1
Research Institute of Natural Gas Technology, Petro China Southwest Oil and Gas
Field Company, Chengdu, Sichuan, P. R. China
2
National Energy R&D Center of High Sulfur Gas Exploitation, Chengdu, 610213,
China
Corresponding author’s e-mail address: R H Zhu, zhurh@petrochina.com.cn
Abstract. The carbonyl sulfide (COS) hydrolys is kinetic over titania based sulfur recovery
catalyst CT6-8 was studied. Kinetic data were obtained by orthogonal experimental design
under the conditions of 280-350
o
C, contact time 3.5×10
-6
-10
-5
h, COS concentration 0.1-1%,
H
2
O concentration 5-30%, H
2
S concentration 2-5%, SO
2
concentration 1-2.5%, without both
internal and external diffusion limitation. The relationship between the reaction rate and the
experimental conditions was fitted by power function model and the COS hydrolysis reaction
kinetic equation was obtained as
2 2 2
7 65100/ 0.11 0.67 0.96 0.17
1.77 10
RT
COS H S SO COS H O
r e P P P P
.
1. Introduction
The Claus process works well for gas streams containing greater than 20% H
2
S and less than 5%
hydrocarbons in the world. The first stage of the Claus process is the thermal oxidation of 1/3 of the
initial H
2
S concentration at high temperature condition. The formation of COS and CS
2
is inevitable
for the present of hydrocarbon in the combustion step. The efficient hydrolysis of COS and CS
2
is
helpful to achieve the high levels of sulfur recovery rate. In the first reactor, the conversion of COS
and CS
2
is limited to 75% for COS and 50% for CS
2
by alumina catalyst while titania-based catalysts,
such as CRS-31 & CT6-8, are regarded as a more efficient way for COS and CS
2
hydrolysis [1].
CS
2
and COS are two problem compounds that often appear together in the first Claus converter.
The kinetic of CS
2
and COS hydrolysis have been studied in numerous research papers [2-5]. Tong
studied the hydrolysis of CS
2
and COS for a titania catalyst and found that the hydrolysis of CS
2
can
be best described by an Eley-Rideal model over the ranges of temperature from 270 to 330
o
C. In this
study, the feed gas contains only CS
2
or COS, H
2
O and N
2
[6,7]. In the first Claus converter, H
2
S and
SO
2
with high concentration, can strongly influence the hydrolysis of CS
2
or COS. We have reported
the hydrolysis of CS
2
in the presents of H
2
S and SO
2
, and got great different results compared with
the previous reports [8].
In this research, the kinetic measurements for the hydrolysis of COS using titania-based CT6-8
catalyst was obtained under controlled condition using a continuous flow fixed bed reactor. The
466
Zhu, R., Chang, H., Tu, C., Wen, C., He, J., Liu, Z., Zhang, S., Ma, X. and Li, X.
Kinetic Modelling of the Hydrolysis of COS Catalyzed by Titania Based CT6-8.
In Proceedings of the International Workshop on Materials, Chemistry and Engineering (IWMCE 2018), pages 466-470
ISBN: 978-989-758-346-9
Copyright © 2018 by SCITEPRESS – Science and Technology Publications, Lda. All rights reserved
reaction temperature varied from 280 to 350
o
C. The feed gas contains COS, H
2
O, H
2
S, SO
2
and N
2
to
simulate the gases encountered within the first Claus converter.
2. Experimental section
2.1. Catalyst
CT6-8 catalyst was produced by Research Institute of Natural Gas Technology, Petro China
Southwest Oil and Gas Field Company.
2.2. Experimental apparatus
A fixed-bed reactor used for this study was constructed with a stainless steel tube 12 mm ID and 300
mm in length. The concentration of water in the feed was controlled by a microscale water pump.
The flow rates of H
2
S, SO
2
, COS and N
2
were controlled by mass flow controller. In each experiment,
0.20 g catalyst was in use. The inlet and outlet gas were measured by Agilent 7890 gas
chromatograph with thermal conductivity cell detector. The conversion rate of COS was calculated as
Equation (1):
η
COS
=(1-Kv×φ/φ
0
)×100% (1)
Where φ
0
= COS concentration without water in the inlet gas, φ = COS concentration without water
in the outlet gas, Kv = volume adjusting factor [4], calculated as Equation (2) [8]:
)]([100)]([100Kv
22
22
SO
'
SH
'
SOSH
(2)
3. Results and discussion
3.1. Blank test
Prior to the measurement of the reaction test, blank runs using an empty reactor or reactor filled with
ceramic balls showed no detectable conversion of COS.
3.2. The effect of internal and external diffusion
For the purpose of kinetic study, it is important to ensure that the rate data obtained are under the
kinetic regime.
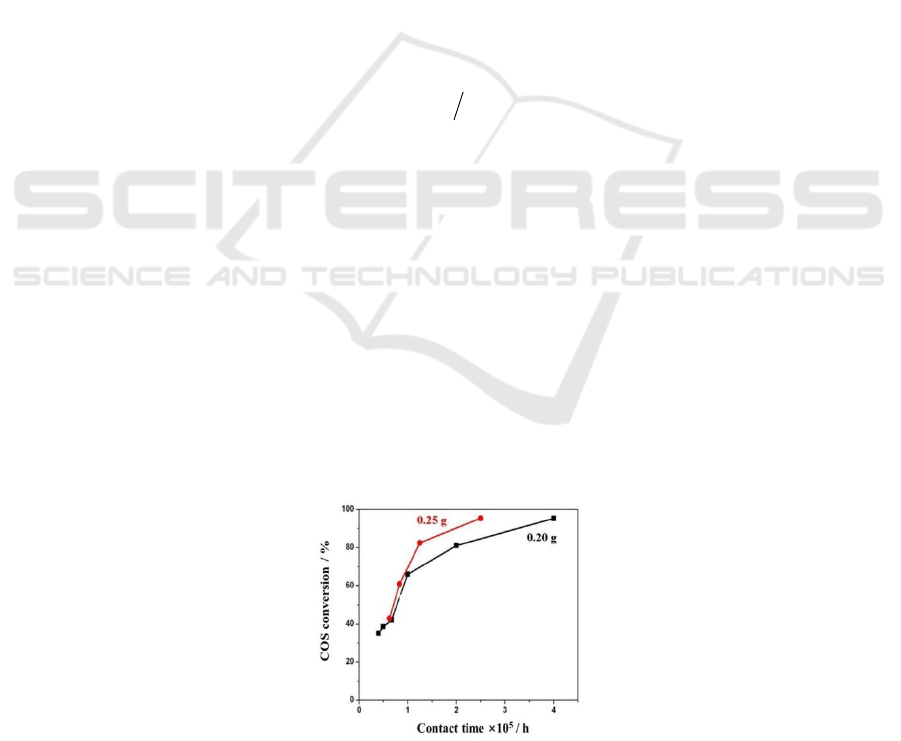
To eliminate the external diffusion effect, two group COS conversion rate test (with catalyst
loading amount of 0.20 g and 0.25 g) were carried out. As shown in Figure 1, when the contact time
is less than 1×10
-5
h, the COS conversion rate is almost the same. This shows that the conversion rate
is uncorrelated with the gas flow rate. Then, it can be supposed that the external diffusion effect has
been eliminated.
Figure 1. Variation of the COS conversion rate with the
contact time (reaction condition: 5.5% H
2
S, 2.5% SO
2
, 1% COS, 30% H
2
O, N
2
as balance gas, the
reaction temperature was 350
o
C and the size of the catalyst was 30-40 mesh)
Kinetic Modelling of the Hydrolysis of COS Catalyzed by Titania Based CT6-8
467
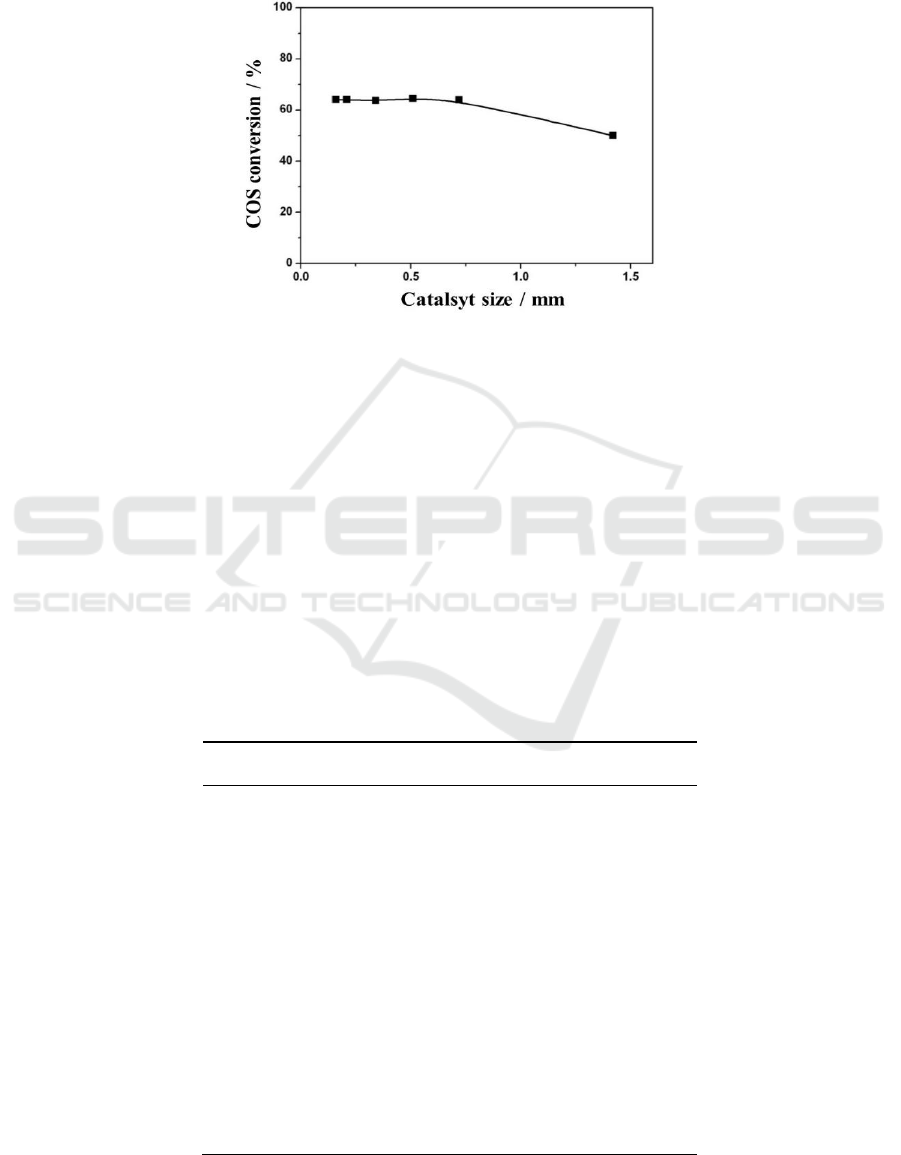
The catalysts were crushed to different size to test the effect of particle size on internal diffusion
effect. As shown in Figure 2, when the catalyst size was smaller than 0.6mm (30-40mesh), the COS
conversion rate remain unchanged with different size, which showed that the reaction was free of
internal diffusion with particles size.
Figure 2. Variation of the COS
conversion rate with the catalyst size (reaction condition: 5.5% H
2
S, 2.5% SO
2
, 1% COS, 30%
H
2
O, N
2
as balance gas, the reaction temperature was 350
o
C and GHSV was 10,000h
-1
)
3.3. Kinetic data results
Orthogonal table (L
16
(4
5
)) was applied to arrange the experiments with the aim to reduce the
experimental trials. Considered the actual situation in the first Claus converter, the reaction
conditions were selected as follows: temperature range 280-350
o
C, COS concentration 0.1-1%, H
2
O
concentration 5-30%, H
2
S concentration 2-5% and SO
2
concentration 1-2.5%.
Kinetic data were collected after the reaction system reached a stable condition. Parallel samples
were taken at least 3 times for each experimental point. H
2
S, SO
2
and COS partial pressure were
calculated according to the results of chromatographic data, atmospheric pressure and internal
pressure of the kinetic experiment apparatus. The partial pressure of H
2
O was calculated by the flow
rate of micro-metering pump and the total pressure. The kinetic data were shown in Table 1.
Table 1. COS kinetic data
T/
o
C
H
2
O
/kPa
H
2
S
/kPa
SO
2
/kPa
COS
/kPa
-r
exp
/mol/h.L
350
13.30
2.28
2.19
0.12
5.20
350
4.75
2.00
2.59
0.70
21.99
350
28.50
5.13
1.33
0.52
20.00
350
19.95
6.27
2.15
0.12
3.62
320
19.95
3.42
1.26
1.21
21.93
320
28.50
2.95
2.38
0.93
11.03
320
4.75
4.66
2.47
0.41
8.22
320
13.30
4.56
2.38
0.11
1.16
300
4.75
4.18
1.43
1.02
11.11
300
13.30
4.94
1.52
0.76
8.10
300
19.95
2.66
3.23
0.47
1.35
300
28.50
4.18
2.57
0.13
0.75
280
28.50
6.56
3.33
1.28
4.10
280
4.75
4.75
2.38
0.81
5.85
280
13.30
3.33
1.52
0.48
2.21
280
4.75
2.00
1.24
0.11
0.51
IWMCE 2018 - International Workshop on Materials, Chemistry and Engineering
468
3.4. Kinetic model and parameter analysis
In this study, we selected power function model as shown in Equation (3) due to the complexity of
the experimental conditions, easier data processing and parameter estimation.
1
2 2 2
/
1
E RT
a b c d
COS H S SO COS H O
r k e P P P P
(3)
The proposed model for the hydrolysis of COS is a non-linear functions of the parameters.
Microsoft excel was used to search for best values of the model parameters. The best fitting values of
the parameters were shown in Table 2. The value of k
1
and E were all greater than zero, which
compliance with the physics-chemistry rule.
Table 2. Best fitting values of the parameters in Equation (3)
Parameters
Values
k1
1.77×10⁷
E / kJ/mol
65.1
a
-0.11
b
-0.67
c
0.96
d
-0.17
The reaction series of COS is 0.96, which is close to 1, indicating that the reaction order of COS
is 1. The reaction order of H
2
S, SO
2
and H
2
O were -0.11, -0.67 and -0.17, indicating H
2
S, SO
2
and
H
2
O inhibit the reaction of COS due to the competitive adsorption with COS on surface active
position. Because of the strongest adsorption capacity of SO
2
, the greater hindrance of SO
2
to the
hydrolysis of COS.
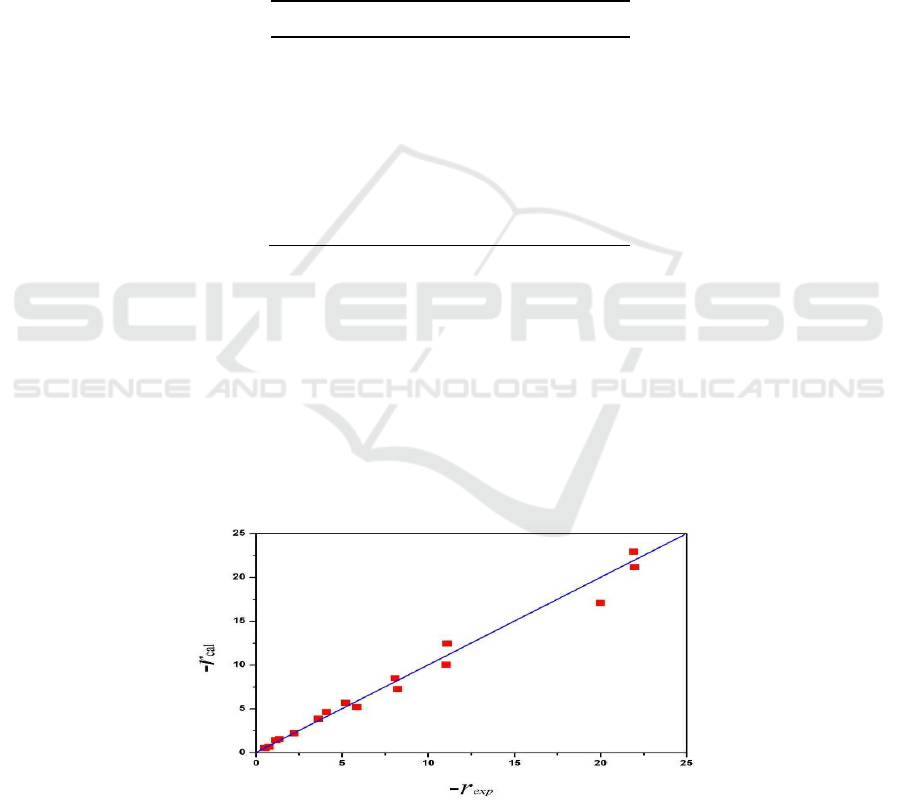
The reaction rate comparison of the experimental value (-r
exp
, as shown in Table 1) and the
calculated value (-r
cal
, calculated by Equation (3) and the values in Table 2) was shown in Figure 3.
The points evenly distributed on both sides of the diagonal, indicating that the deviation between the
calculated values and the experimental values is smaller to meet kinetic experiments requirement.
Figure 3. The reaction rate comparison of the experimental value and the calculated value
4. Conclusions
COS hydrolysis kinetic have been studied in the simulated first Claus converter condition
and the kinetic equation has been obtained as:
Kinetic Modelling of the Hydrolysis of COS Catalyzed by Titania Based CT6-8
469

2 2 2
7 65100/ 0.11 0.67 0.96 0.17
1.77 10
RT
COS H S SO COS H O
r e P P P P
. (4)
This study lays the foundation for optimization of the Claus reactor design and titania-
based catalysts improvements.
Acknowledgments
We are thankful for the financial support from post-doctoral research center of Petro China
Southwest Oil and Gas Field Company (No. 20100308-13).
References
[1] Clark P D, Dowling N I and Huang M 2001 Appl. Catal. B-Environ. 31 107
[2] Li K, Song X, Zhu T, Wang C, Sun X, Ning P and Tang L 2018. Environ. Pollut. 232 615
[3] Song X, Ning P, Tang L, Sun X, Mei Y, Wang C and Li K 2017. J. Chem. Eng. Jpn. 50 115
[4] Guo H, Tang L, Li K, Ning P, Sun X, Liu G, Bao S, Zhu T, Jin X, Duan Z and Li Q 2016.
Russ. J. Phys. Chem. B. 10 427
[5] Wang L, Wang S and Yuan Q 2010. Fuel. Process. Technol. 91 777
[6] Tong S, Dalla Lana I G and Chuang K T 1993. Can. J. Chem. Eng. 71 392
[7] Tong S, Dalla Lana I G and Chuang K T 1995. Can. J. Chem. Eng. 73 220
[8] Zhu R, Chang H G, He J L, Wen C R and Li J H 2012 Int. Conf. on Frontier of Energy and
Environment Engineering (Leiden: Netherlands Taylor & Francis) 674
IWMCE 2018 - International Workshop on Materials, Chemistry and Engineering
470
