
Numerical Study on the Gas-liquid Transportation in
μDMFC Anode Flow Channel with Different Wettabilities
Design
M M Li
*
, Z Li, J Geng and J H Shi
Nanjing University of Aeronautics and Astronautics, Nanjing, 210016, China
Corresponding author and e-mail: M M Li, limiaomiao@nuaa.edu.cn
Abstract. The gas-liquid flow in anode flow channel of micro direct methanol fuel cell
(μDM FC) is simu lated using the VOF method. The effect of channel sidewalls wettability on
the gas-liquid transportation is investigated. Results indicate that improving hydrophilicity of
the sidewall could promote removal of CO
2
bubbles when the wettability of the sidewall
keeps the same everywhere. When the wettability of the sidewall changes with height, the
hydrophilic/neutral combinations have the highest pressure drop, but the
hydrophilic/hydrophobic combinations have the lowest gas fraction in the channel.
Co mparing the two aspects, a conclusion was drawn that sidewalls with hydrophobic upside
and hydrophilic downside facilitate the CO
2
bubble removal and liquid transporting to GDL.
1. Introduction
In recent years, micro direct methanol fuel cell (μDMFC) based on MEMS technology is considered
as a promising power source candidate for portable electronic equipments due to its advantages such
as low temperature operation, high energy conversion, simple structure and convenience of refilling
the liquid fuel [1-3].
The electrochemical reaction taking place in the μDMFC anode is described as follows:
6e6HCOOHOHCH
2
RuPt
23
(1)
As shown in Figure 1, when the μDMFC is in operation, carbon dioxide (CO
2
) bubbles are
generated on the surface of the anode catalyst layer because of the oxidation of the carbon in the
methanol. The reaction-produced CO
2
bubbles emerge from the micro-pores of the gas diffusion
layer (GDL) and transport into the sub-micrometer anode channel, and then move along the flow
channel and out of the fuel cell, which lead to a liquid-gas two-phase flow in the anode flow field of
μDMFC. The CO
2
bubbles could block the channel if not removed efficiently. In that case, not only
less fuel reaches the catalyst layer but also the reaction sites are occupied by the bubbles, resulting in
a decline of the performance of the μDMFC. Hence the effective removal of CO
2
in the anode micro
channels plays - a critical role in the performance of the μDMFC.
Recently, researchers focus their attention on optimizing the channel by changing the wettability
of the surfaces. Zhang et al.
[4] investigated the effect of the wettabilities of the anode GDLs on CO
2
removal on these anode GDLs, and the visualizations of CO
2
gas bubbles dynamics on the anodes
shows that uniform CO
2
gas bubbles with smaller size formed on hydrophilic anode GDLs, and
Li, M., Li, Z., Geng, J. and Shi, J.
Numerical Study on the Gas-liquid Transportation in µDMFC Anode Flow Channel with Different Wettabilities Design.
In Proceedings of the International Workshop on Materials, Chemistry and Engineering (IWMCE 2018), pages 207-214
ISBN: 978-989-758-346-9
Copyright © 2018 by SCITEPRESS – Science and Technology Publications, Lda. All rights reserved
207
bubbles with larger size are not uniform over the hydrophobic anode GDLs. Ke et al. [5] studied the
effects of hydrophilic/hydrophobic properties on liquid distribution and gas behavior by commercial
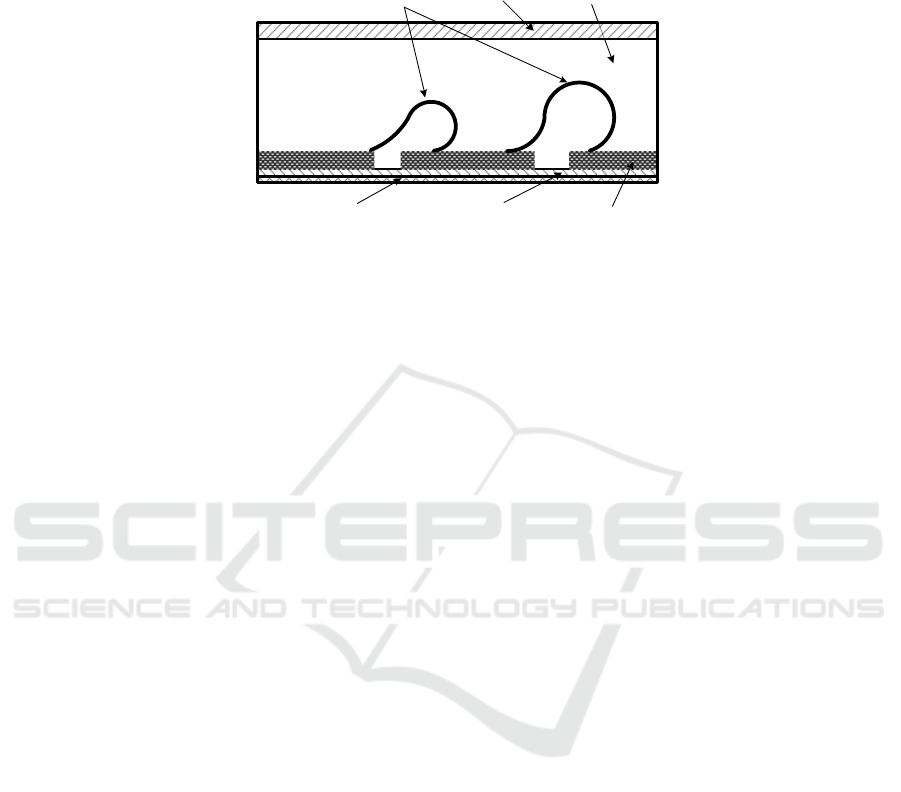
Gasket Flow channel
GDL(carbon fiber paper)Catalyst layer
Proton Exchange Membrane
CO
2
bubbles
Figure1. Schematic of the anode flow field of Μdmfc.
software Fluent. It was found that an anode channel with hydrophilic channel side-wall and
hydrophobic GDL surface avoided gas accumulation on the GDL surface, and facilitated the gas
discharging and liquid transporting to GDL. Hutzenlaub et al. [6] investigated the effect of both
channel wall and diffusion layer wettability by observing two-phase flow from the side at different
mean velocities of the fuel supply in 2011. By comparing hydrophobic and hydrophilic flow channel
surfaces experimentally, they found that the hydrophilic flow channel leads to a minimum pressure
drop along the channel. Comprehensive studies focusing on the effect of surface wettability
properties on water droplet movement in PEM fuel cells has been conducted numerically with VOF
method by Mondal et al. [7] and Zhu et al. [8].
In this paper, the effect of wettability of sidewalls on the gas-liquid transportation in μDMFC
anode flow channel is investigated numerically by using the VOF method. The numerical model and
the VOF method are briefly explained, and followed by description on the specific information of
simulation performed. The simulation results for different wettabilities of sidewalls are compared and
several useful conclusions are obtained.
2. Numerical method and numerical model
2.1. Numerical method and numerical model
Unsteady state and isothermal laminar flow conditions are assumed to prevail for both methanol flow
and CO
2
bubble motion inside the microchannel, since the flow Reynolds number is far less than
2000. The three-dimensional numerical model was implemented by using the commercial CFD
package, FLUENT, and the VOF method [9].
In the VOF technique, a single set of momentum equations is shared by both fluid phases, and the
interface between phases is tracked for each computational cell throughout the domain by computing
the volume fraction for the fluid k:
)interface fluidth at the( 1~0
)fluidth inside( 1
)fluidth outside( 0
),,,(
k
k
k
tzyxC
k
(2)
Where C
k
is the volume fraction function of kth fluid. For all the fluids, the sum of the volume
fraction function is equal to 1.
IWMCE 2018 - International Workshop on Materials, Chemistry and Engineering
208

1
1
n
k
k
C
(3)
The volume fraction function C
k
is governed by the volume fraction equation [9] which is solved
in every computational cell.
0)()(
kkkkk
uCC
t
(4)
Then, the two-phase fluid flows in the microchannel are modeled by the Navier-Stokes equation
which depends on the volume fractions of all phases through the fluid properties ρ and μ.
Fguupuuu
t
T
)]([)()(
(5)
where p is the static pressure,
F
is a momentum source term related to surface tension, ρ and μ
are the volume averaged density and dynamic viscosity. These are computed to account for the
variable volume fractions for the two-phase air-water system considered here:
)(
1221
C
(6)
)(
1221
C
(7)
where 1 and 2 represent air and water, respectively
Surface tension is accounted for by using the continuum surface force (CSF) model, and is
expressed in terms of the pressure jump across the interface, which depends on the surface tension
coefficient, and is implemented in the momentum equation as a body force
F
:
)
11
(
21
RR
p
(8)
))(2/1(
21
k
kvol
C
F
(9)
where ∆p is the pressure drop across the surface,
the surface tension coefficient, R
1
and R
2
are
the surface curvatures as measured by two radii in orthogonal directions. The curvature κk is
computed from local gradients in the surface normal to the interface,
)(
n
n
k
(10)
and the surface normal
n
is defined as the gradient of C
k
, the volume fraction of the kth phase.
k
Cn
(11)
2.2. Numerical model
Figure 2 and Figure 3 shows the computational domain representing a part of the microchannel.
Figure 2 is single-layer flow channel, Figure 3 is double-layered flow channel.Base case conditions
in this study correspond to a microchannel with 400μm×400μm square cross section and 12000μm
length. These dimensions are representative of flow channels used in μDMFC. A structured
orthogonal computational mesh with 30,000 cells is used for the baseline case. The grid dependency
was tested by increasing and decreasing the number of grid nodes by 20% for the baseline case, and
Numerical Study on the Gas-liquid Transportation in µDMFC Anode Flow Channel with Different Wettabilities Design
209
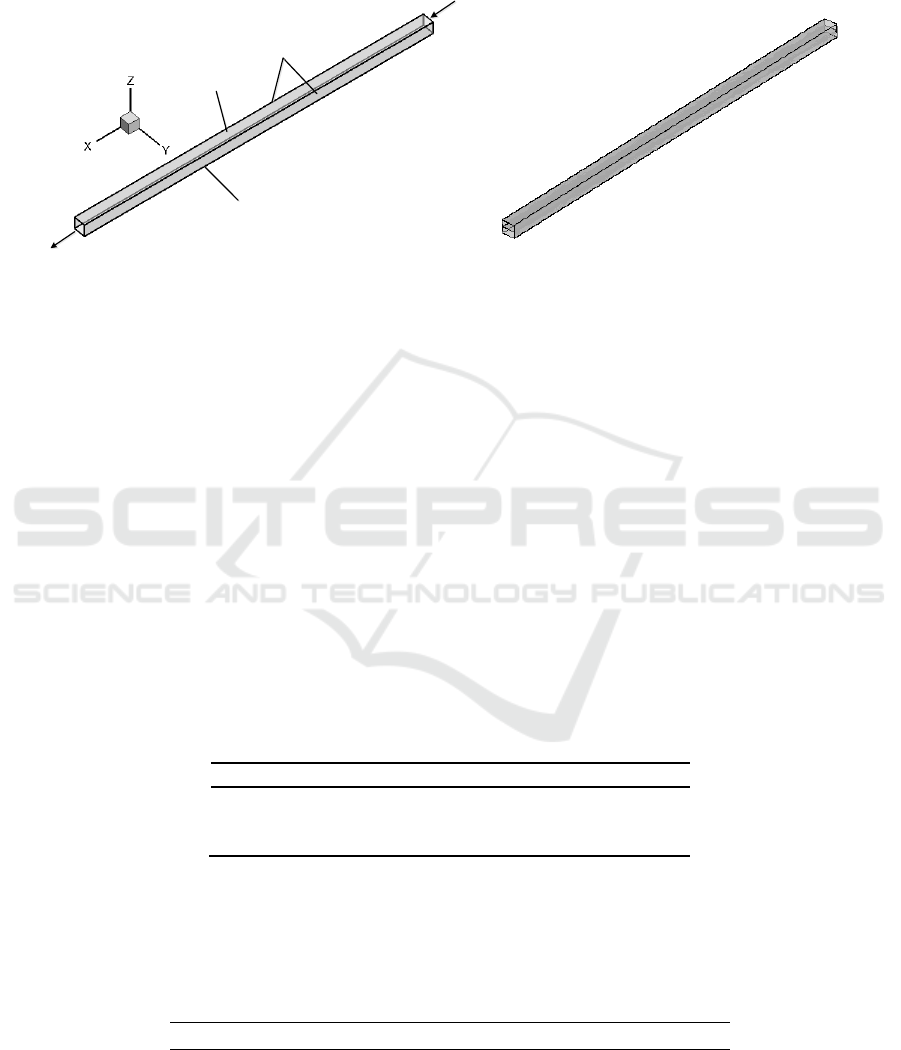
similar CO
2
bubble transport processes were obtained with all three grids. Therefore, the mesh used
in the simulation is considered adequately. Preliminary simulations were performed with time steps
of 10-5, 10-6 and 10-7 s, and all simulations were consequently performed using the time step of 10-
6 s.
Inlet
Outlet
Sidewalls
Topwall
Gas Diffusion
Layer
Figure 2. Computation domain of μDMFC anode
single-layer flow channel.
Figure 3. Computation domain of μDMFC anode
double-layer flow channel.
3. Boundary and Initial Conditions
All VOF simulations were performed in the current study by employing uniform velocity profiles for
the incoming gas and methanol solution in the channel, as shown in Figure 2. A convective outflow
condition is used at outlet. No-slip boundary condition is imposed on walls of the channel. Constant
surface tension and static contact angle are specified on the walls as a boundary condition.
For all simulations, a CO
2
inlet velocity of 0.1m/s is used and the liquid inlet velocity is set to
0.2m/s. The static contact angle of the GDL and topwall is set to 30
o
for all cases. However, the
contact angle of all sidewalls of the microchannel is set to different values for different cases,
representing different wettabilities of sidewalls.
The effect of wettability of sidewalls is studied from two aspects. Firstly, sidewalls have a single
wettability in each case, that is, the contact angle keeps the same on the sidewalls. The two-phase
flow in the channel was simulated under different wetting conditions. All the conditions are shown in
Table 1, in which contact angle of 30
o
and 60
o
correspond to hydrophilic sidewalls and contact angle
of 120
o
and 150
o
correspond to hydrophobic sidewalls.
Table 1. Computing conditions of single wettability.
Conditions
1
2
3
4
5
Contact angle
of sidewalls (
o
)
30
60
90
120
150
Secondly, a double-layer channel with wettabilities of sidewalls changing with height is
introduced as shown in Figure 3, the channel is divided to two parts with different wettability of
sidewalls. Simulations were performed under six conditions, representing six combinations including
hydrophilic/neutral (1), hydrophilic/hydrophobic (2), neutral/hydrophobic (3), neutral/hydrophilic (4),
hydrophobic/hydrophilic (5), and hydrophobic/neutral(6). All the conditions are shown in Table 2.
Table 2. Computing conditions of single wettability.
Conditions
1
2
3
4
5
6
Contact angle of
upside(
o
)
30
30
90
90
150
150
IWMCE 2018 - International Workshop on Materials, Chemistry and Engineering
210
Contact angle of
downside (
o
)
90
150
30
150
30
90
4. Results and discussion
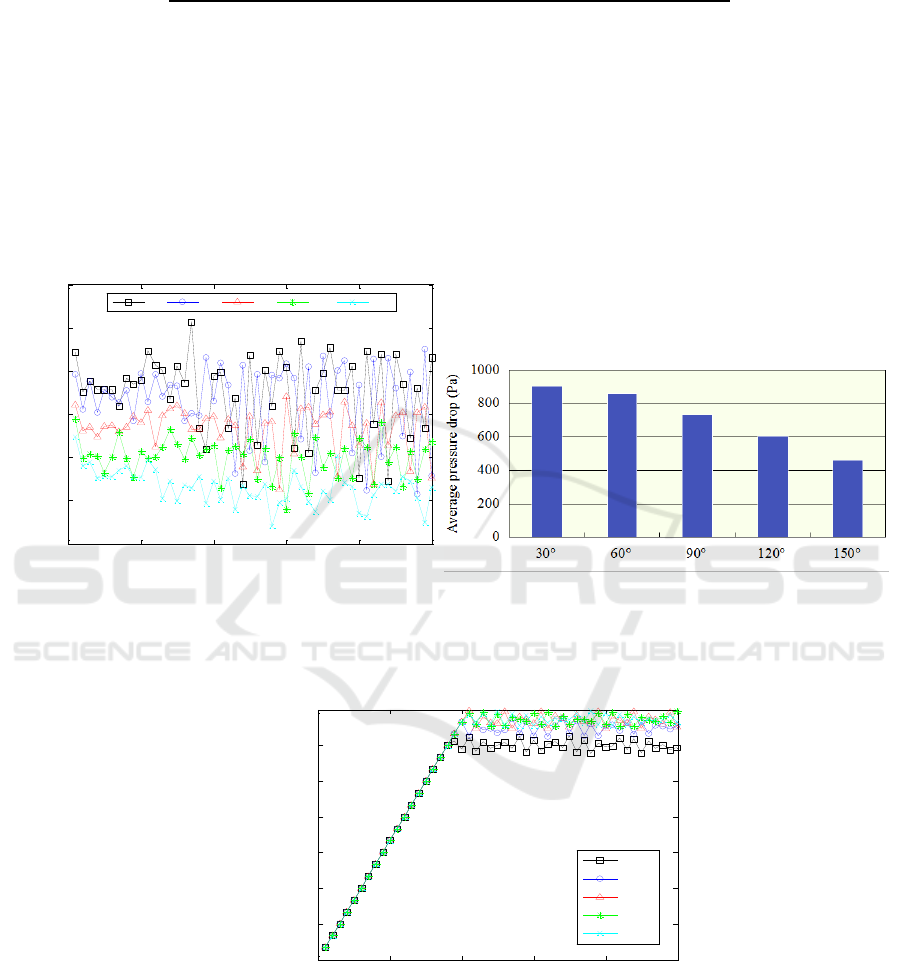
Firstly, Figure 4. shows the changing curves of pressure drops of the gas-liquid flow between the
inlet and outlet of the channel with different wettabilities. By data processing, Figure 5 gives
comparison of average pressure drops for the cases with different wettabilities. Different wettablities
of the sidewalls give significant differences in pressure drop of the flow in the channel from Figure 4
and Figure 5. Sidewall with contact angle of 30
o
corresponds to the highest average pressure drop,
while sidewall with contact angle of 150
o
corresponds to the lowest average pressure drop. It could be
found that the more hydrophilic sidewalls cause the higher pressure drop, which leads the faster
bubble removal
Figure 4. Pressure drops of the gas-liquid flow in
channel with different wettabilities.
Figure 5. Columnar section of average pressure
drops of the gas-liquid flow in channel with
different wettabilities.
Figure 6. Gas fraction of the channels with different wettabilities.
Figure 6 gives comparison of gas fraction for the cases with different wettabilities. It could be
distinguished that sidewall with contact angle of 30
o
has the lowest gas fraction of the channel.
According to the above results, it could be concluded that improving hydrophilicity of the sidewall
would promote removal of CO
2
bubbles.
Secondly, two-phase flow in a double-layer channel with wettabilities of sidewalls changing with
height is simulated. Figure 7 shows the evolving processes of pressure drops of the gas-liquid flow
0 20 40 60 80 100
200
400
600
800
1000
1200
1400
Time (ms)
P (Pa)
30° 60° 90° 120° 150°
0 20 40 60 80 100
0
5
10
15
20
25
30
35
Time(ms)
Gas fraction (%)
30°
60°
90°
120°
150°
Numerical Study on the Gas-liquid Transportation in µDMFC Anode Flow Channel with Different Wettabilities Design
211
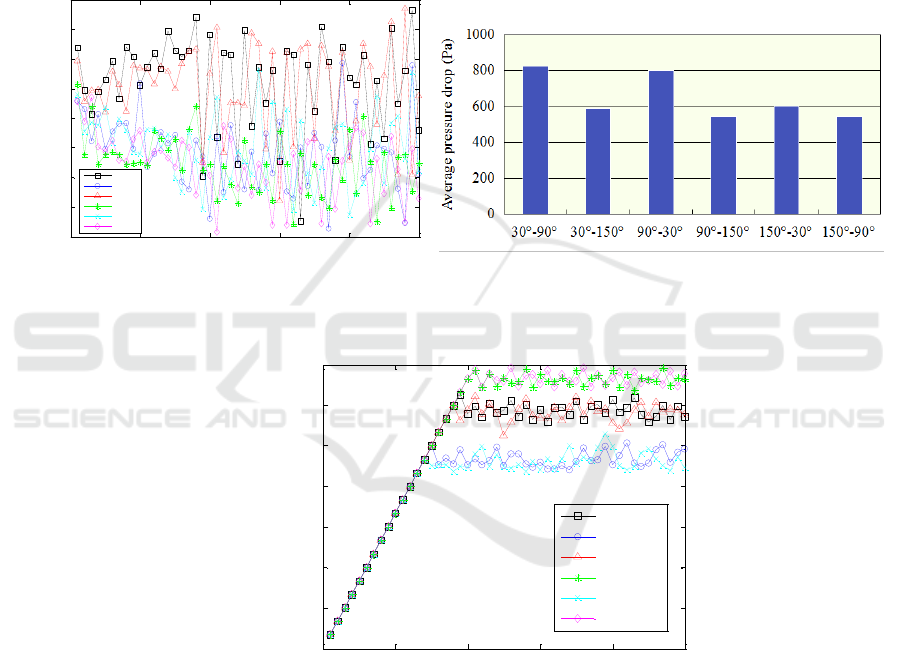
between the inlet and outlet of the channel with different wettability combinations. Since the curves
are not very intuitive, average pressure drops are obtained by data processing, as shown in Figure 8.
The exchange of the wettability combination order has little impact on the average pressure drop, e.g.,
the 30
o
-90
o
combination corresponds to the same average pressure drop with the 90
o
-30
o
combination.
From Figure 8, we also find that a more hydrophilic sidewall on average results in a higher pressure
drop between the inlet and outlet of the channel, which is, to some extent, similar with the conclusion
we obtained from the above point; That is Figure 8 shows the average pressure drop of the gas-liquid
flow in the flow channel with the difference of the contact angle between the upper and lower layers
of the double-layered flow channel. The average value of the contact angle of the sidewall and the
single-layer flow channel has the same variation trend. The average pressure drops slightly lower.
Figure 7. Pressure drops of the gas-liquid flow in
channel with different wettability combinations.
Figure 8. Columnar section of average pressure
drops of the gas-liquid flow in channel with
different wettability combinations.
Figure 9. Gas fraction of the channels with different wettability combinations.
Figure 9 gives comparison of gas fraction for the cases with different wettability combinations. It
could be found that the gas fraction is lowest when the sidewall is combined with hydrophilic and
hydrophobic parts. CO
2
bubbles could be removed from the channel in the shortest time as well.
However, when the sidewall is combined with neutral and hydrophobic parts, the gas fraction is
highest and the removal of bubbles costs the longest time. Similarly, the exchange of the wettability
combination order doesn’t change the gas fraction in general. Dissimilarly, the 30
o
-150
o
combination
and 150
o
-30
o
combination have the lowest gas fraction in the channel, which is different with the
wettability combinations with the highest pressure drop, i.e., the 30
o
-90
o
combination and the 90
o
-30
o
combination.
0 20 40 60 80 100
300
400
500
600
700
800
900
1000
1100
Time (ms)
P (Pa)
30°-90°
30°-150°
90°-30°
90°-150°
150°-30°
150°-90°
0 20 40 60 80 100
0
5
10
15
20
25
30
35
Time(ms)
Gas fraction (%)
30°-90°
30°-150°
90°-30°
90°-150°
150°-30°
150°-90°
IWMCE 2018 - International Workshop on Materials, Chemistry and Engineering
212
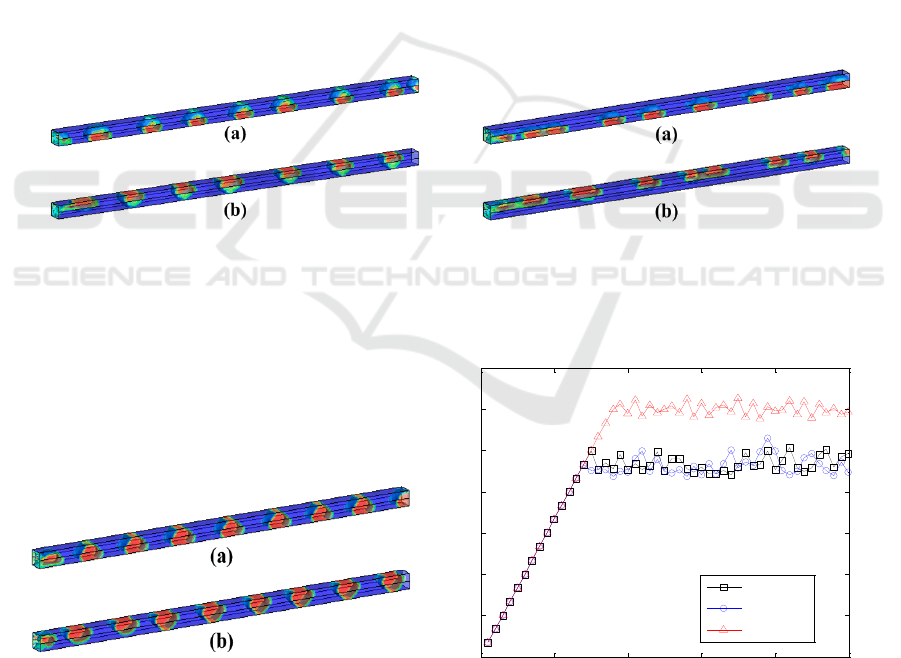
Figure 10, Figure 11 and Figure 12 show the gas-liquid flow in the channel with different
wettability combinations. Because hydrophilic sidewalls have an effect of repulsion on the bubbles
but absorption on the liquid, bubbles tends to contact with the less hydrophilic sidewalls. It gives an
explanation for the phenomenon that the gas-liquid flow in the channel tends to be layered when the
sidewall is combined with hydrophilic and hydrophobic parts. As shown in Figure 11, methanol
solution mainly exists within the scope of the altitude where the hydrophilic sidewalls exist, while
bubbles mainly flow within the scope of the altitude where the hydrophobic sidewalls exist. It partly
explains why the combination of hydrophilic and hydrophobic leads to the lowest gas fraction in the
channel.
In order to find out the best wettability scheme from all the schemes including single wettabilities
and wettability combinations, Figure 13 gives comparison of gas fraction for the cases which
promote CO
2
bubble’s removal in the two aspects respectively. It is distinguished that the gas
fraction of the gas-liquid flow is lower when the sidewall is combined with hydrophilic and
hydrophobic parts than that when the sidewall is hydrophilic only. So the combination of hydrophilic
and hydrophobic will facilitate the gas-liquid transportation in the channel. According to Figure 11,
bubbles mainly gather in the upper half of the channel when upper part of the sidewall is hydrophilic
and lower part is hydrophobic, which promotes methanol transportation to GDL. Therefore, sidewalls
with hydrophobic upside and hydrophilic downside do good to the improvement of the performance
of μDMFC.
Figure 10. Gas-liquid flow in the channel
combined with hydrophilic and neutral sidewalls
(a) hydrophilic upside and neutral downside (b)
neutral upside and hydrophilic downside.
Figure 11. Gas-liquid flow in the channel
combined with hydrophilic and hydrophobic
sidewalls(a) hydrophilic upside and hydrophobic
downside (b) hydrophobic upside and hydrophilic
downside.
Figure 12. Gas-liquid flow in the channel
combined with neutral and hydrophobic
sidewalls(a) hydrophilic upside and hydrophobic
downside (b) hydrophobic upside and
Figure 13. Gas fraction of the channels with
hydrophilic sidewalls and
hydrophilic/hydrophobic combined sidewalls.
0 20 40 60 80 100
0
5
10
15
20
25
30
35
Time(ms)
Gas fraction (%)
30°-150°
150°-30°
30°-30°
Numerical Study on the Gas-liquid Transportation in µDMFC Anode Flow Channel with Different Wettabilities Design
213

hydrophilic downside.
5. Conclusions
The effect of wettability of sidewalls on the gas-liquid transportation in μDMFC anode flow channel
is investigated numerically using the VOF method. The simulation results show that the wettability
of sidewalls of the microchannel have a strong impact on the removal of CO
2
bubbles. When the
wettability of the sidewall keeps the same everywhere, improving hydrophilicity of the sidewall
could promote removal of CO
2
bubbles. When the wettability of the sidewall changes with height,
the 30
o
-90
o
combination and the 90
o
-30
o
combination have the highest pressure drop, but the 30
o
-150
o
combination and 150
o
-30
o
combination have the lowest gas fraction in the channel. Comparing the
two aspects, a conclusion was drawn that sidewalls with hydrophobic upside and hydrophilic
downside facilitate the CO
2
bubble’s removal and liquid transporting to GDL.
Acknowledgement
Authors are pleased to acknowledge the financial support provided by National Natural Science
Foundation of China (Grants No 51505215) and the Natural Science Foundation of Jiangsu
Province (Grants No BK20130804).
References
[1] Kamarudin S K, Achmad F and Daud W R W 2009 Overview on the application of direct
methanol fuel cell (DMFC) for portable electronic devices International Journal of
Hydrogen Energy 34(16) 6902-6916
[2] Achmad F, Kamarudin S K, Daud W R W and et al 2011 Passive direct methanol fuel cells for
portable electronic devices Applied Energy 88(5) 1681-1689
[3] Thampan T, Shah D, Cook C and et al 2014 Development and evaluation of portable and
wearable fuel cells for soldier use Journal of Power Sources 259 276-281
[4] Zhang J, Yin G P, Lai Q Z and et al 2007 The influence of anode gas diffusion layer on the
performance of low-temperature DMFC J. Journal of power sources 168(2) 453-458
[5] Ke X, Yao K and Wang L 2008 Simulation of effects of hydrophilic properties of channel
walls on the characteristics of gas-liquid two-phase flow in anode channel of DMFC
Chemical Industry and Engineering Progress 27(2) 265
[6] Hutzenlaub T, Paust N, Zengerle R and et al 2011 The effect of wetting properties on bubble
dynamics and fuel distribution in the flow field of direct methanol fuel cells Journal of
Power Sources 196 8048–8056
[7] Mondal B, Jiao K and Li X 2011 Three-dimensional simulation of water droplet movement in
PEM fuel cell flow channels with hydrophilic surfaces J. International Journal of Energy
Research 35(13) 1200-1212
[8] Zhu X, Sui P C, Djilali N and et al 2011 Dynamics of Emerging Water Droplet Subjected to
Sidewall with Different Wettabilities in a Fuel Cell Cathode Channel Fuel Cells 11(3) 404-
412
[9] ANSYS FLUENT User’s Guide Version 14.0 ANSYS Inc. 2011 Canonsburg PA
IWMCE 2018 - International Workshop on Materials, Chemistry and Engineering
214
