
Research of Vortex Identification Algorithm and Its
Application to Aircraft Wake Flow Vortices
R Zhu
1
, Z Y Chen
1
, S Li
1
, Y Q Tan
1
, Y R Mo
1
, F Bao
1
and Z R Liu
*
Department of Power Engineering, School of Aerospace Engineering, Xiamen
University, Xiamen 361005, China
Corresponding author and e-mail: Z R Liu, lzr1222@126.com
Abstract. Vortex identification is very critical for PIV (Particle Image Velocimetry) post-
processing to obtain the precise vortex formation. The research focuses on studying &
comparing several popular vortex identification methods which are based on velocity gradient
tensor derived the second invariant Q , the characteristic equation discriminant
, the
complex eigenvalue imaginary part
ci
and the pressure second eigenvalue
2
. By comparing
and analyzing different vortex identification algorithms to detect the vortex region, the
criteria with the best display effect is applied to the aircraft vortex data of the four vortices
system to study the influence of the initial vortex and the initial position of the vortex on the
dissipation of the main vortex. The research results indicate that the higher small-vortex
initial circulation will speed up primary vortex dissipation and the wake vortex strength may
reach weakest as the small-vortex initial circulation is of an appropriate value. The closer the
initial position of small-vortex to primary vortex will also speed up vortices interactions but
non-linearly related to primary vortex dissipation, and if the distance is too close, it will cause
the small vortex to be thrown off by the main vortex.
1. Introduction
The research on vortex is always frontier
multidimensional & nonlinear complicated mechanism and its importance to engineering applications
[1]. The PIV testing technology is essentially an image analysis technology. The speed field obtained
by the PIV is only an intermediate product for studying the complex flow and needs further post-
processing to extract important flow field information. In fact, some recent vortex identification
criteria based on wavelet analysis have been proved to be very effective [2, 3]. The vortex
identification algorithm for 2D PIV velocity field is deduced and programmed in Matlab in this paper.
The vortex identification method for 3D velocity field is also deduced and programmed in Tecplot to
be compared with 3D numerical experiments results. Applying optimal method to aircraft wake flow
optimizes flow formations.
In the actual PIV measurement process, due to improper exposure of the collection device, uneven
concentration of tracer particles, noise interference, etc., the peak value of the correlation function in
the analysis process is likely to be indeterminate, resulting in spurious vectors in the velocity field.
Zhu, R., Chen, Z., Li, S., Tan, Y., Mo, Y., Bao, F. and Liu, Z.
Research of Vortex Identification Algorithm and Its Application to Aircraft Wake Flow Vortices.
In Proceedings of the International Workshop on Materials, Chemistry and Engineering (IWMCE 2018), pages 143-151
ISBN: 978-989-758-346-9
Copyright © 2018 by SCITEPRESS – Science and Technology Publications, Lda. All rights reserved
143
The data obtained from the FMPL laboratory's Dynamic Studio software was used to confirm the
data and replace the erroneous data. Finally, the initial data of vortex structure detection was obtained.
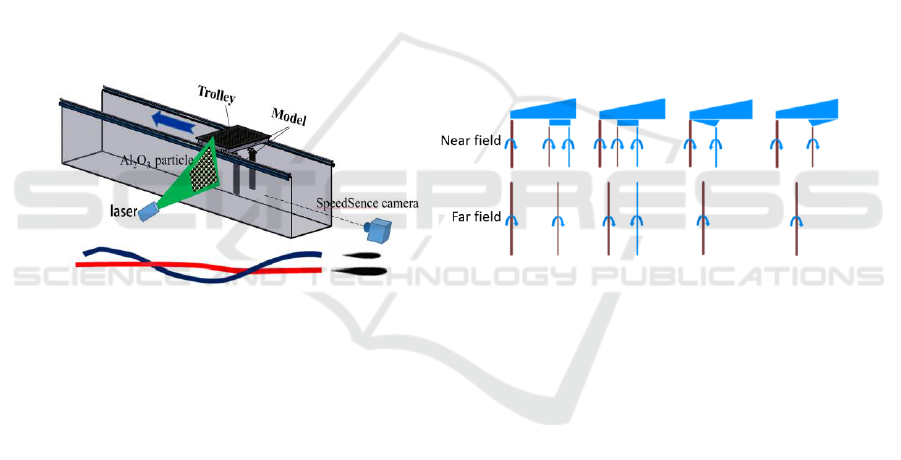
2. PIV experiments
According to experimental equipment performance and measurement requirements, the frequency of
the high-frequency camera is set to 100 Hz, the image used for cross-correlation analysis is 1 608
pixels by 1 176 pixels, and the size of the Interrogation Window is 16 pixels by 16 pixels. The
picture contains 134 × 98 data points. The laser is irradiated from the side of the sink and the laser
cuts the vertical sink axis. The trailer drags the model along the axis of the sink. The PIV camera
shoots at the end of the sink and records the development of the wake vortex on the laser cut surface.
Set the trolley drag speed to 0.1m/s, and data was collected after the dragging model passed through
the laser cut plane. Each set of experiments was collected for 10 seconds and a total of 1,000 original
particle images were processed. Then the PIV software was used to process the images recorded by
the camera to obtain the velocity vector field and vorticity field in the measurement area. In order to
ensure the reliability of the experimental data, each group of PIV experiments was repeated twice.
In PIV experiments, two wing models with different sizes are used to generate primary vortex and
secondary vortex (Figure 1). As water flows through two wing models the two wingtip vortices are
created by airfoils upper-lower surface pressure difference, the secondary vortex performs twisting
motion around primary vortex due to primary vortex shear [4].
A B C D
Figure 1. Model installation. Figure 2. Vortices interactions & transformations.
The trails of two vortices are presented in Figure 1, the red curve represents primary vortex trail
and blue curve represents secondary vortex trail.
interactions & transformations according to where the small vortex generated as shown in Figure 2,
the thickness of line represents vortex strength. A, B, C are traditionally typical flap installations [5].
3. Vortex identification algorithm
If instantaneous streamlines are projected to plane which is vertical to vortex center and look like
round or helix in relative reference system, this domain can be identified as vortex [6]. However, this
definition is not applicable to pure-shear flow, so based on velocity gradient tensor the second
invariant Q, the characteristic equation discriminant
, the complex eigenvalue imaginary part
ci
and the pressure second eigenvalue
2
are proposed. These criteria have more accurate mathematical
definition and physical interpretation, and can weaken the influence of shear flow on vortex
identification.
3.1. Basic theory
Velocity gradient tensor
is:
IWMCE 2018 - International Workshop on Materials, Chemistry and Engineering
144

1 1 1
0
2 2 2
11
22
11
22
U V U W U U
U V W
x x y x z y
x x x
U V W V U V W V
y y y x y y y z
U V W
W U W V W
z z z
x z y z z
U
1
2
11
0
22
11
0
22
V U W
x z x
U V V W
y x z y
U W V W
z x z y
(1)
In above equation the first item is rate-of-strain tensor represented by S, the second item is
vorticity tensor represented by [7]. The velocity gradient tensor
can be presented as:
ij ij ij
US U
,
1
2
j
i
ij
ij
U
U
S
xx
,
1
2
j
i
ij
ij
U
U
xx
. (2)
The reference [8] defines the characteristic equation of velocity gradient tensor
:
32
0P Q R
. (3)
The first invariant is
i
i
U
P
x
, the second invariant is
1
2
jj
ii
i j j i
UU
UU
Q
x x x x
, the third invariant
det
i
j
U
R
x
(det means determinant).
3.2. Q criteria
Fluid viscous resistance, baroclinity and earth Coriolis force are three main factors that generate
vortex. The vortex ist local phenomenon in time and space, but in fact some local characteristics
can be used to evaluate the overall characteristics of vortex in realistic applications. The Q criteria
which connects the second invariant Q of velocity gradient tensor with vortex was proposed for
identifying vortex under incompressible or low-pressure conditions [9]. Some engineering
applications always see the low-pressure as the mark of vortex, because fluid rotation generates
centrifugal force which achieves balance with pressure, to create a low-pressure area at vortex center.
According to reference [10] and mass conservation equation:
0
i
i
U
U V W
x y z x
, thus the first
invariant P=0, so:
1 1 1
2 2 2
j j j
i i i
ij ij ij ij
i j j i j i
U U U
U U U
Q S S
x x x x x x
(4)
3.3.
criteria
According to reference [11], if the eigenvalue
1
,
2
,
3
are real numbers the streamlines will not have
center point on characteristic-plane. For incompressible flow, the possible condition which causes the
percentage of vorticity tensor higher than strain tensor in flow transformations under Q criteria is:
32
0
32
QR
. Q, R are the second, third invariants of velocity gradient tensor.
3.4.
ci
criteria
ci
criteria are based on
criteria, when
>0 the characteristic equation has one real root
, two
conjugate imaginary roots
and
, so:
1 r
,
2 cr ci
i
,
3 cr ci
i
Research of Vortex Identification Algorithm and Its Application to Aircraft Wake Flow Vortices
145
Set:
3
1
2
R
,
3
2
2
R
, solving simple cubic equation, so:
12
3
2
ci
. Investigating if
to estimate the existence of vortex and judging vortex rotational direction based on the plus or minus
of vorticity.
3.5.
2
criteria
2
criteria proposes that the vortex center pressure is lowest while ignoring the influences of unstable
stress and viscosity. The conditions are the three eigenvalues of symmetric tensor to have:
,
and
2
<0. Q criteria can look for the domains where vorticity tensor higher than strain tensor, and
2
criteria can only do it on specific planes.
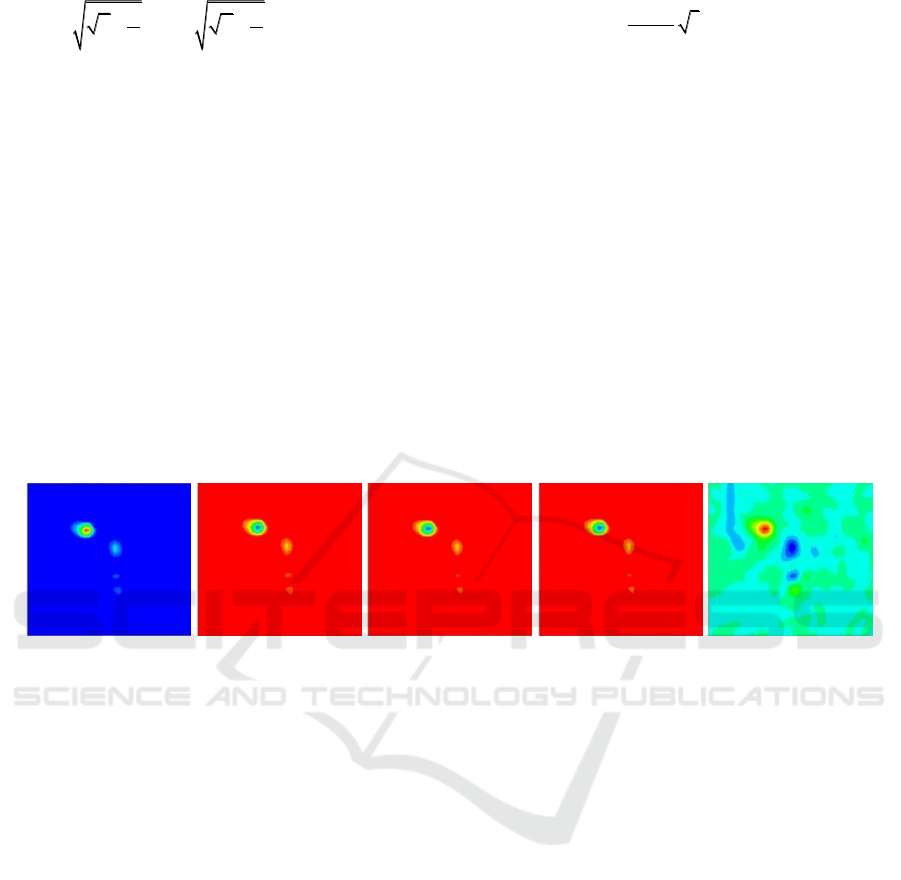
4. Comparisons of vortex identification algorithms
Vortex identification comparisons are shown in Figure 3. The vortex identification methods based on
the second invariant Q decomposed from velocity gradient tensor, the characteristic equation
discriminant
, the complex eigenvalue imaginary part
ci
and the pressure second eigenvalue
2
further weaken the influence of pure-shear on vortex identification. The identified vortex area (Figure
3 (a)-(d)) is much smaller than traditional vorticity method (Figure 3 (e)) and shows clearer vortex
formations.
(a) Q criteria
2
criteria (c)
criteria (d
ci
criteria (e) vorticity
Figure 3. Comparison of traditional vortex identification criteria based on flapping wing aircraft.
By comparing the above graphs, we can see that the
criteria further reduces the influence of
pure shear flow on vortex identification relative to other criteria (see Figure 3 (e)). The purpose of
this paper is to study the application of vortex identification algorithm. The key lies in mastering the
whole process of PIV data post-processing. Therefore, the
criteria is selected as the criteria for the
analysis of Aircraft wake vortices and four-vortex systems.
5. Applications of vortex identification algorithms
5.1. Aircraft wake vortex visualization
Figure 4-Figure 7 are wake vortex visualizations based on wake vortex data. Figure 4 is 3D track
figure of single-vortex center. Extracting
value from single-vortex data obtained in PIV
experiments to be vortex center. Figure 4. shows the motion trail of wake vortex and position
mutation of vortex center due to small disturbance but not presents the strength transformations of
wake vortex.
Figure 5 is 3D track figure of a twin-vortex system which indicates the 8 cross sections of twin-
vortex trail motions. The blue isoclines show the twin-vortex motions while
as minus, the red
dotted lines show the trails of twin-vortex centers. Figure 5 presents the twin-vortex twist under R-L
instability, but
criteria cant tell the direction of main vortex and secondary vortex and unable to
identify them.
IWMCE 2018 - International Workshop on Materials, Chemistry and Engineering
146
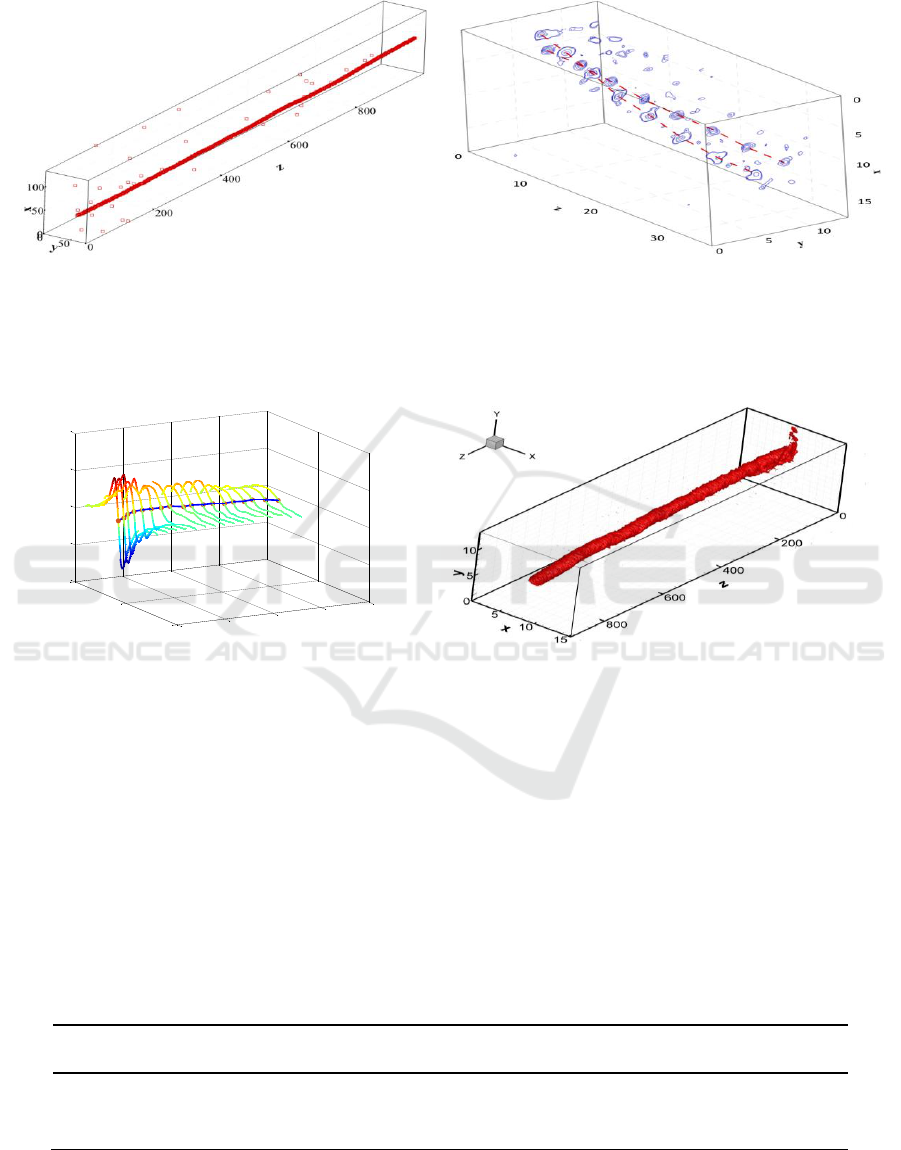
Figure 6 is 4D figure of tangential velocity of twin vortices. Extreme points of
create a
waterline, extracting tangential velocity of all points of it to make the figure with 18 sets of data.
Figure 4. 3D track figure of single-vortex center. Figure 5. 3D track figure of twin-vortex system.
Vortex core is within-area where tangential velocity is highest [12]. In Figure 6. the vortex core
energy is relatively concentrated as two vortices generated, energy peak shown in darkest colour; the
primary vortex interacts with secondary vortex and transmits energy quickly to other areas thus
weakens vortex core energy till dissipation.
Figure 6. 4D figure of tangential velocity. Figure 7. 3D track figure of single vortex-tube.
Creation method of Figure 7 is similar to Figure 5., overlapping series of contour surfaces based
on PIV experimental data to form 3D vortex-tube figure. Figure 7 not only clearly presents the wake
vortex motion track but also exhibits the vortex-tube energy change according to vortex-tube position
and size. As Figure 7 indicates, at the first beginning vortex-tube motion track is linear, the wake
vortex formations basically unchanged; vortex formations start to have twist due to long wave
instability which causes shear-led vortex core energy dissipation but still maintain basically linear.
5.2. 4-vortex system identification
This paper applies
criteria to a wake 4-vortex system to study the influence of initial position &
strength of secondary vortex on main wake vortex dissipation with flow visua lization analysis to
better understand flow mechanism. The PIV experimental sets are shown in Table 1 and Table 2.
Table 1. Initial position sets of secondary vortex.
Experiment
NO.
Angle of attack (Main
wing)
Angle of attack (Small
wing)
Distance
A
10°
6°
40mm
B
10°
6°
45mm
C
10°
6°
50mm
0
10
20
0
5
10
15
20
-0.4
-0.2
0
0.2
0.4
Z
X mm
Y m/s
Research of Vortex Identification Algorithm and Its Application to Aircraft Wake Flow Vortices
147
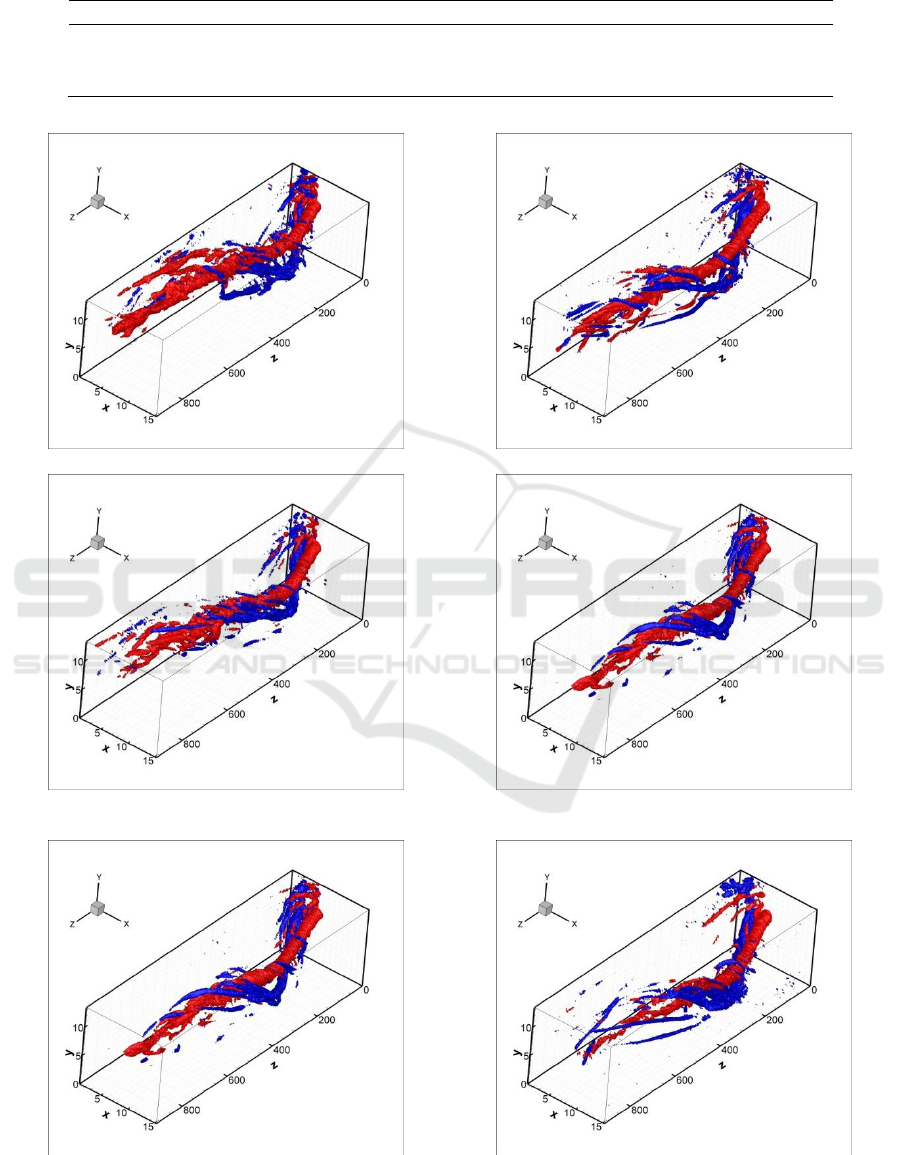
Table 2. Initial strength sets of secondary vortex.
Experiment NO.
Angle of attack (Main wing)
Angle of attack (Small wing)
Distance
D
10°
4°
50mm
C
10°
6°
50mm
E
10°
8°
50mm
(a) A: M.A.A. 10°, S.A.A. 6°, D 40mm (b) D: M.A.A. 10°, S.A.A. 4°, D 50mm
(c) B: M.A.A. 10°, S.A.A. 6°, D 45mm (d) C: M.A.A. 10°, S.A.A. 6°, D 50mm
(e) C: M.A.A. 10°, S.A.A. 6°, D 50mm (f) E: M.A.A. 10°, S.A.A. 8°, D 50mm
Figure 8. Twin-vortex formations under various experimental sets.
IWMCE 2018 - International Workshop on Materials, Chemistry and Engineering
148
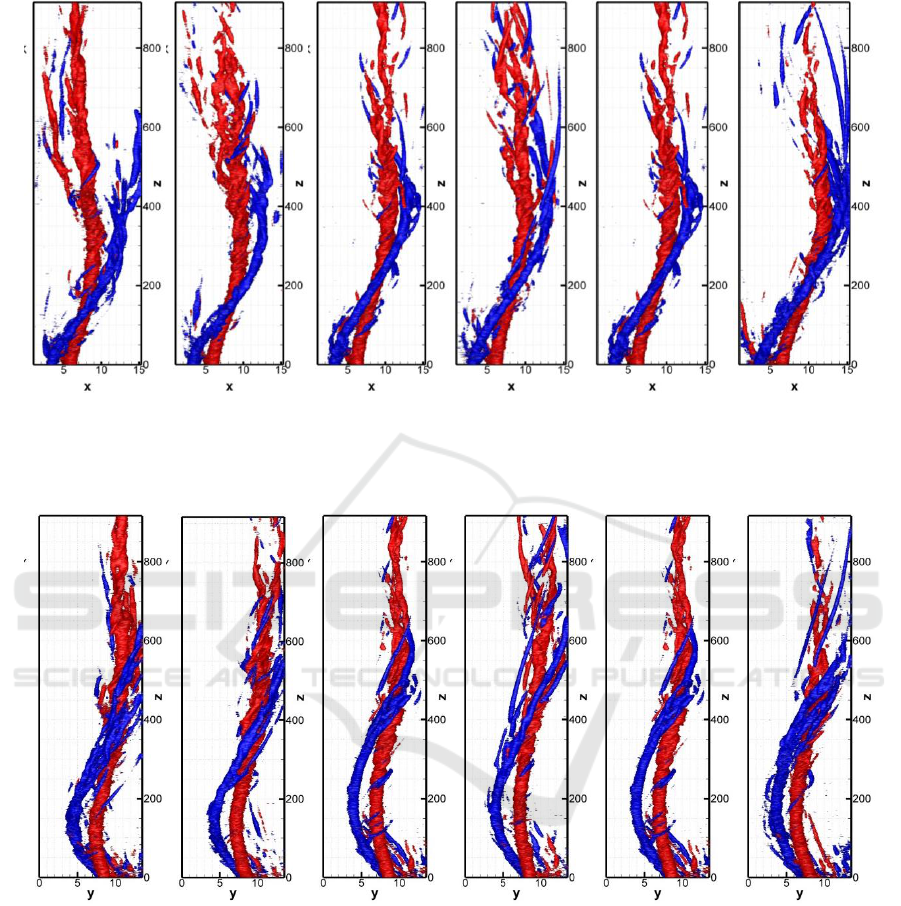
(a) (b) (c) (d) (e) (f)
A: D 40mm B: D 45mm C: D 50mm D: S.A.A. 4° C: S.A.A. 6° E: S.A.A. 8°
Figure 9. Twin-vortex x-z views under various experimental sets.
(a) (b) (c) (d) (e) (f)
A: D 40mm B: D 45mm C: D 50mm D: S.A.A. 4° C: S.A.A. 6° E: S.A.A. 8°
Figure 10. Twin-vortex y-z views under various experimental sets.
In experimental sets A, Figure 9 (a) shows that the secondary vortex has been thrown off due to
smaller distance during process of stripping effect. Figure 8 (c) (Sets B with proper distance)
indicates the trend that secondary vortex is induced to rotate around main vortex under Rayleigh-
Ludwieg instability influence [13]. Experiment C (Figure 9 (c), Figure 10 (c)) has max twin-wing
distance, the main vortex and secondary vortex interact lately then vortex core breaks while
dissipating energy.
Processing PIV velocity field data of experiments (D, C, E) to study the strength relations
between main vortex and secondary vortex. Figure 9 (d), (e), (f) have the similar main vortex tube
Research of Vortex Identification Algorithm and Its Application to Aircraft Wake Flow Vortices
149

shapes but secondary vortex tube sizes up as its strength (angle of attack) increases under same twin-
wing distance. As shown in Figure 10 (d), (f), the main vortex strength is not obviously weakened by
secondary vortex in experiment D but greatly weakened in experiment E thus reveals that stronger
secondary vortex will speed up main vortex dissipation. Figure 9, Figure 10 also shows that the drift
distance and twist deformations triggered by twin-vortex interactions increase as secondary vortex
strength up.
In order to distinguish the spatial development of the main vortex and the secondary vortex, we
define the red represents anticlockwise main vortex (positive), the blue represents clockwise
secondary vortex (negative). The magnitude of the vorticity cannot be inferred directly from the
colour of the vortex contour. The specific comparison requires the use of circumstantial analysis.
The
2
1
is the ratio of secondary vortex initial circulation to main vortex initial circulation, is
the attenuation rate of main vortex circulation. Performing correlation analysis to the first image, the
vorticity less than zero is added together to obtain
2
, and the vorticity greater than zero is added to
obtain
1
. (Table 3).
Table 3. Main vortex vorticity attenuation.
Experiment
2
1
Distance
(%)
A
-0.68
40mm
23.8
B
-0.68
45mm
24.4
C
-0.68
50mm
20.7
D
-0.54
50mm
18
E
-0.88
50mm
21.7
According to Table 3., the experiment B has the biggest attenuation rate, which reveals that there
is an ideal distance to achieve the best dissipation effect as angle of attack kept same. While twin-
wing distance and main wing attack angle kept same, the secondary wing attack angle increases will
cause stronger secondary vortex which speeds up dissipation. However, for real flight conditions, the
small wing hardly generates strong-enough vortex that can effectively influence dissipation. So
choosing the optimal distance and secondary wing attack angle should be best way to dissipate vortex
energy.
6. Conclusions
This paper focuses on research of local vortex identification methods of the second invariant Q, the
characteristic equation discriminant
, the complex eigenvalue imaginary part
ci
and the pressure
second eigenvalue
2
which are deduced with velocity gradient tensor ' U' . The main conclusions are
as follow:
1. Q criteria,
criteria,
2
criteria and
ci
criteria are equivalent under incompressible conditions;
2. Q criteria and
2
criteria are equivalent,
criteria and
ci
criteria are equivalent under 2D
conditions while zero threshold as vortex boundary;
3. Q criteria,
criteria,
2
criteria, and
ci
criteria have basically same results of identifying vortex
center positions and vortex core sizes while non-zero threshold as vortex boundary;
4.
criteria is more suitable for data processing because it can further weaken influence of pure-
shear flow.
Wake vortex visualizations based on identification methods (programmed in Matlab & Tecplot)
clearly exhibit the vortex center track, vortex core size and vortex domain, which help to better
understand interactions & dissipation of wake vortices. Vortex-tube visualizations are made to study
the influence of original circulations & positions of twin-vortex on wake vortex dissipation.
Conclusions revealed by visualizations:
5. Secondary vortex with stronger circulation will speed up main vortex dissipation;
IWMCE 2018 - International Workshop on Materials, Chemistry and Engineering
150

6. Secondary vortex with appropriate circulation will lead to minimum wake vortex strength;
7. The smaller twin-vortex distance will make 2 vortices interact earlier.
References
[1] Raffel, M. et al., Post-Processing of PIV Data. Particle Image Velocimetry, pp.177208.
[2] Simoni, D., Lengani, D. & Guida, R., 2016. A wavelet-based intermittency detection technique
from PIV investigations in transitional boundary layers. Experiments in Fluids, 57(9).
[3] Camussi, R., 2002. Coherent structure identification from wavelet analysis of particle image
velocimetry data. Experiments in Fluids, 32(1), pp.7686.
[4] Kolá, V., 2007. Vortex identification: New requirements and limitations. International Journal
of Heat and Fluid Flow, 28(4), pp.638652.
[5] Majda, A.J. & Bertozzi, A.L., Computational Vortex Methods. Vorticity and Incompressible
Flow, pp.190255.
[6] Alekseenko, S.V., Kuibin, P.A. & Okulov, V.L., Equations and laws of vortex motion. Theory
of Concentrated Vortices, pp.968.
[7] Liu, C. et al., 2016. New omega vortex identification method. Science China Physics,
Mechanics & Astronomy, 59(8).
[8] Epps, B., 2017. Review of Vortex Identification Methods. 55th AIAA Aerospace Sciences
Meeting.
[9] Kolá
Identification in Two-Dimensional and Three-Dimensional Flows. Computational Fluid
Dynamics 2010, pp.225231.
[10] Bao, F. et al., 2014. An Investigation on the Lift Mechanism of Flapping-Wing Air Vehicle.
Advanced Materials Research, 971-973, pp.353358.
[11] Bao Feng, Liu Jinsheng, Zhu Rui, et al. 2015. Experimental Study of Aircraft Tail Vortical
Rayleigh-Ludwieg Instability[J].Acta Aeronautica et Astronautica Sinica, 2166-2176.
[12] Carmer, C.F. v. et al., 2008. Identification of vortex pairs in aircraft wakes from sectional
velocity data. Experiments in Fluids, 44(3), pp.367380.
[13] Kolá
Identification in Two-Dimensional and Three-Dimensional Flows. Computational Fluid
Dynamics 2010, pp.225231.
Research of Vortex Identification Algorithm and Its Application to Aircraft Wake Flow Vortices
151
