
Classification of High Resolution Remote Sensing Images Based on
PCA, HSV and Texture Feature
Binbin Chen, Chuanrong Li
*
and Zengguang Zhou
Key Laboratory of Quantitative Remote Sensing Information Technology, Chinese Academy of Sciences, Beijing 100094,
China.
Email: crli@aoe.ac.cn
Keywords: Principal component analysis (PCA), multi-scale texture, classify, high resolution, SVM
Abstract:
Land cover classification of high spatial resolution data integrating textural information and spectral
features remains limited, and the traditional extraction methods of high spatial resolution image have
shortcomings of low accuracy and classification efficiency. In order to explore the practical application
methods and effects of high-resolution remote sensing images in vegetation classification, this paper
presents a support vector machine classification method for high-resolution image classification, combined
using the spectral, principal component, HSV color space and texture features of the study object, which is
based on the image data of Wuwei, one city in Gansu Province, China. The threshold values of NDVI are
determined to separate vegetation area and non vegetation area. Surface objects in vegetation area mainly
include special medicinal herbs, wheat, sorghum, sunflower and fruit tree. The overall classification
accuracy is measured as high as 96.01%, and the Kappa coefficient is 92.49%. The results of ground truth
check show that the method has high precision and good effect, which can be used to distinguish the
vegetation of the same species. Meanwhile, the method could be used to extract the vegetation coverage
information accurately and quickly, which can provide a reference for high resolution image classification.
This method would have an extensive application prospect in crop information extraction from mass
satellite data.
1 INTRODUCTION
Remote sensing technology is used to obtain the
target information through analysis and
interpretation on electromagnetic radiation data of
surface reflection or ground object emission. With
the development of remote sensing technology, a
large number of high-spectral-resolution and high-
spatial-resolution satellites have been launched, and
their data gradually become the main data source for
remote sensing applications. High-resolution images
are not only rich in spectral information, but also
have prominent features such as structure, shape and
texture. They provide vivid and effective data
sources for ecological environment protection, land
survey and fine agriculture (Zhao et al., 2015;Wu et
al., 2016;Lu et al., 2015). However, due to the
richness of detailed information, the influence of
interference factors such as small target and
boundary becomes more obvious. At the same time,
spectral features are used to classify high-resolution
remote sensing images because of the phenomenon
of "same objects with different spectra" and
"different objects with the same spectrum" will
cause lower classification accuracy, and "Salt and
Pepper" phenomenon is more serious in
classification.
With the development of remote sensing
technology, the classification methods for high
resolution remote sensing images are getting more
and more attention, especially based on combination
of texture and spectrum. A large number of studies
show that the comprehensive utilization of the
spectrum and texture features can contribute to
improving the feature extraction (Blaschke,
2010;Chen et al., 2008;Li et al., 2006). Zhang Sen et
al. studied on classification with spectral images,
texture features of objects and corresponding DEM
information, and the results show that the texture
can effectively improve the classification accuracy
516
Chen, B., Li, C. and Zhou, Z.
Classification of High Resolution Remote Sensing Images Based on PCA, HSV and Texture Feature.
In Proceedings of the International Workshop on Environment and Geoscience (IWEG 2018), pages 516-521
ISBN: 978-989-758-342-1
Copyright © 2018 by SCITEPRESS – Science and Technology Publications, Lda. All rights reserved
(Zhang et al., 2016). Zhao Liang comprehensively
utilized the spectrum and the texture features to
achieve a high accuracy extraction (Zhao et al.,
2016).
As mentioned above, this paper takes the
Worldview-3 multispectral remote sensing imagery
as data source, and its principal component analysis
and color space transformation images. On this basis,
the multi-scale texture features of the principal
component analysis results are discussed. Finally,
fusion multispectral, principal component analysis,
color space transformation and texture feature for
feature extraction.
2 STUDY AREAS
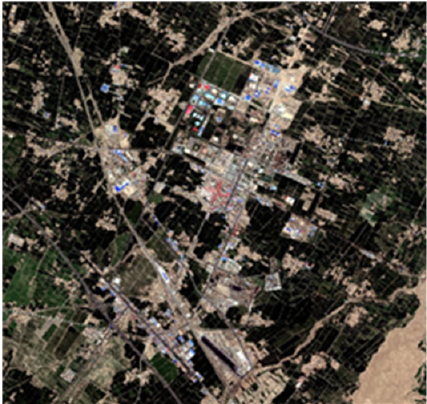
The study area locates in the southeast of Wuwei
City, Gansu Province, China. The remote sensing
data of WorldView-3 was acquired on June 19, 2016.
The ‘WorldView-3’ is the fourth generation of high
resolution optical satellite developed by the Digital
Global corporation, and is the world's highest
resolution commercial remote sensing satellite.
WorldView-3 high resolution images include three
kinds of image data: full-color images (0.3m), Vis-
NIR multi-spectral image (1.24m) and SWIR multi-
spectral image (3.7m). This paper uses its 1.24m
Vis-NIR multi-spectral image (shown in Figure 1),
including bands of coastal zone (427.4nm), blue
(481.9nm), green (547.1nm), yellow (604.3nm), red
edge (722.7nm), near-infrared 1 (824.0nm), near-
infrared 2 (913.6nm).
Figure 1: The study area.
3 RESEARCH METHODS
ANDRESULTS
Firstly, remote sensing image preprocessing is
performed on the Worldview-3 image in the study
area, including radiometric calibration, geometric
correction and cropping. The radiometric calibration
coefficient adopts the latest absolute radiometric
calibration coefficient released by the United States
Digital Earth Corporation on February 22, 2016.
After preprocessing, the principal component
transform of the multispectral data in the
experimental area was performed. The gray scale co-
occurrence matrix method was utilized to extract the
multi-scale texture feature of the first principal
component of PCA. At the same time, the HSV
color space transform, finally multi-scale texture
feature data fusion multispectral data for SVM
classification and accuracy evaluation.
3.1 Principal Component Analysis
Principal component analysis is also called K-L
transform. By performing a linear transformation on
the multispectral image, the spectral space X
composed by the multispectral image is multiplied
by a linear transformation matrix A to generate a
new spectral space Y, i.e. a new Multi-spectral
image. Its expression is:
Y=A*X (1)
In the formula: X is the pixel vector of multi-
spectral feature space before transform;
Y is the pixel vector of transformed
multispectral feature space;
A is an n × n linear transformation
matrix.
A large number of studies have shown that after
PCA transform, the components of multispectral
images will have the least correlation between them,
which can help to highlight the main information,
suppress the noise and enhance the image, which is
beneficial to feature selection. The first principal
component of the transformed feature space
concentrates the largest amount of information,
often accounting for more than 80%, followed by
the second principal component. Principal
component analysis can effectively reduce the data
set dimensions. The first two components of the
image of the study area are shown in Figure 2.
Classification of High Resolution Remote Sensing Images Based on PCA, HSV and Texture Feature
517
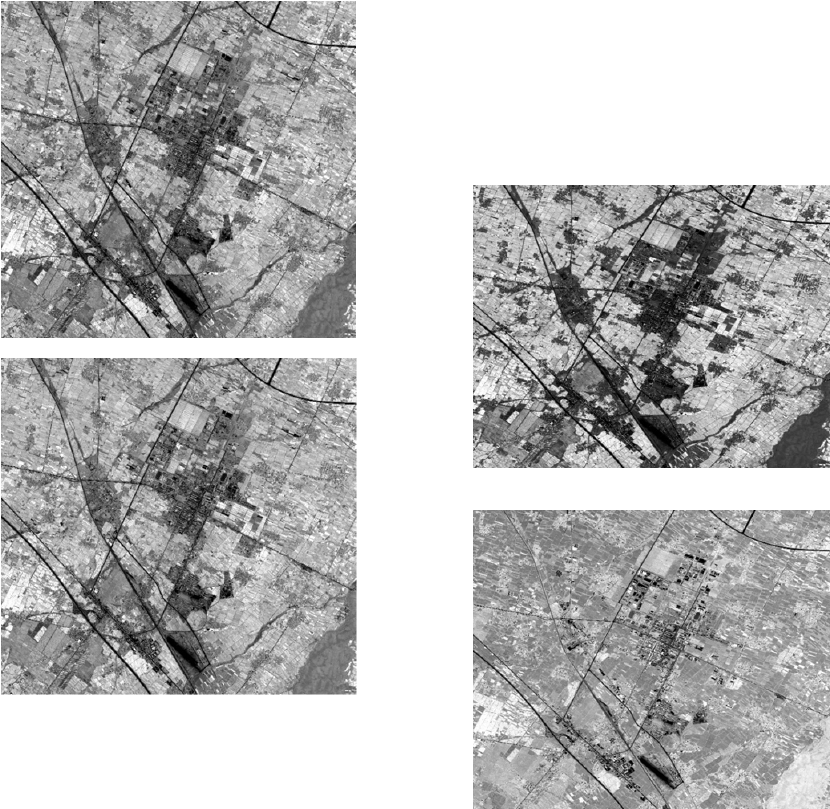
a) pc1
b) pc2
Figure 2: Principal components after PCA.
3.2 Gray Level Co-Occurrence Matrix
Gray Level Co-occurrence Matrix is the most
important texture feature extraction method based on
statistical analysis, which calculates the probability
that two pixels of a certain direction and a certain
distance in an image transition from one gray level
to another, then reflects the image comprehensive
information in the interval, direction, change rate
and speed etc. (Xu, 2010). Its expression is as
follows:
, , ,
,
,
,
|
,
,
,
1,2, ⋯ ,
, 1,2,⋯,
,,
0,1, ⋯ , 1(2)
Grayscale co-occurrence matrix texture
information mainly includes mean value, variance,
entropy, angle second moment, homogeneity,
contrast, dissimilarity, correlation and partial texture
information. In this paper, the principal component
analysis of multispectral images is performed in
advance, then the first principal component is
selected for texture feature extraction. The size of
the moving window in the gray level co-occurrence
matrix analysis is 3 × 3, and the moving step takes 1
pixel. Parts of the texture features are shown in
Figure 3.
a) homogeneity
b) contrast
Figure 3: Gray level co-occurrence matrix.
3.3 HSV Transformation
The HSV color model has three basic elements: Hue
(H), Saturation (S) and Value (V). The HSV color
feature can express the global features of an image.
It is also one of the classic color features used in
image classification (Zhong, 2015). In this paper, we
select the near-infrared 1, red and blue bands of the
image to do HSV transformation. The spectral
characteristics of green plants in the near-infrared
band are high reflectance, which is the key area of
their spectral study. The spectral absorption zone of
vegetation in red band can enhance the contrast
between vegetation and no-vegetation coverage, and
IWEG 2018 - International Workshop on Environment and Geoscience
518
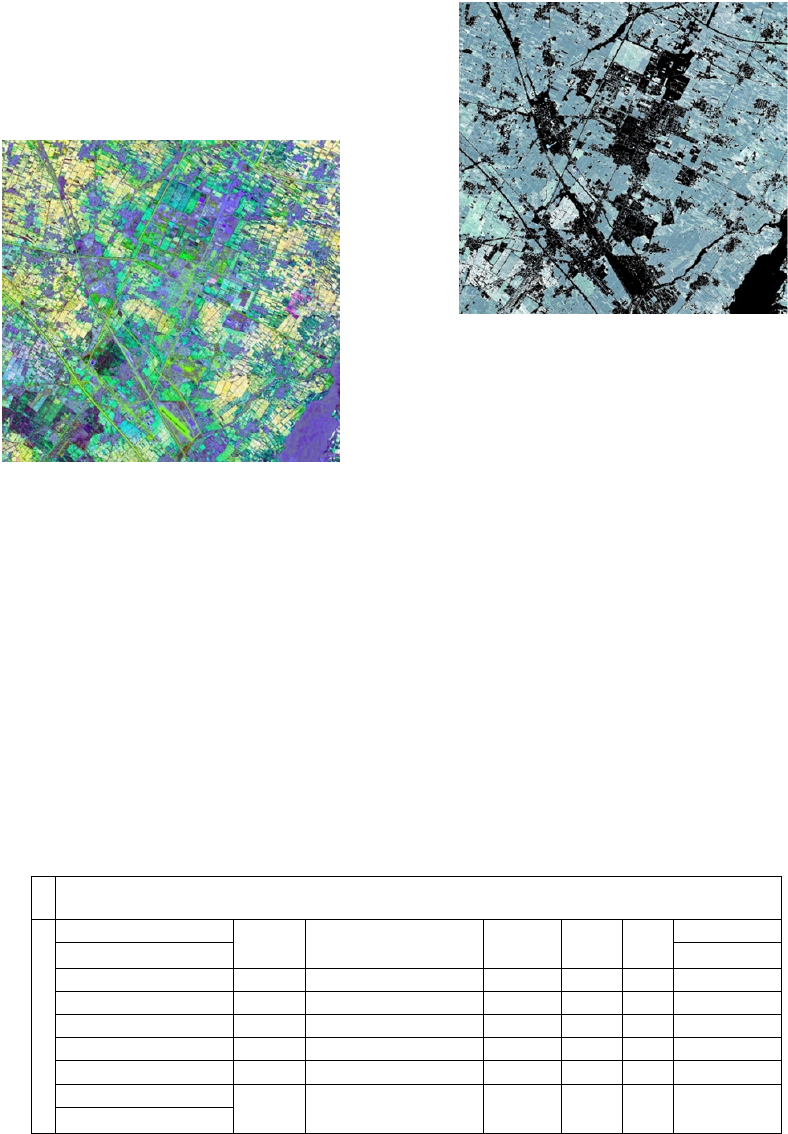
at the same time enhance the contrast between
different types of vegetation. Blue band is a strong
absorption area of vegetation, which can effectively
distinguish the flowering vegetation from others.
The transformed image is shown in Figure.4. In the
transformed image, vegetation appears as a pink,
yellow, green and other bright colors due to different
types and different growth stages; non-vegetation
roads, houses, etc. appear blue.
Figure 4: HSV color space model.
Masking operation can effectively remove the
effects of irrelevant data. In this paper, the main
research object is cropland. At the same time,
because the study area is located in the inland of
northwestern China, there are insufficient vegetation
on the ground besides the crops, so we choose the
best vegetation growth state indicator factor NDVI
to do the masking operation. After testing, when the
threshold of NDVI is set as 0.3 in the study area, it
can effectively remove the buildings, roads and bare
land. If the NDVI value of a local object is less than
0.3, it is considered as a non-research object, and the
NDVI masking of the image is shown in Figure 5
(the black area is the mask area).
Figure 5: Masking.
3.4 Support Vector Machine (SVM)
SVM is a machine learning algorithm based on
statistical learning theory. The core idea of SVM is
to transform the linearly inseparable problem of
low-dimensional space into a high-dimensional
space for accurate classification by using kernel
transformation. It can minimize the empirical error
and maximize classification interval, thereby
enhancing the generalization ability of the model. A
large number of studies show that SVM classifier
has obvious advantages over other remote sensing
image processing methods in feature adaptation,
learning speed and training sample requirements
(Mountrakis et al., 2011).
Table 1: Accuracy evaluation.
Reference image
Classification results
Sorghum Special medicinal herbs sunflower wheat total
User accuracy
(
%
)
Sorghum 58361 98 390 2886 61735 94.53%
Special medicinal herbs 5 4087 39 0 4131 98.93%
sunflower 319 8 8257 13 8597 96.05%
wheat 0 0 0 19735 19735 100.00%
total 58685 4193 8686 22634 94198
Production accuracy
99.45% 97.47% 95.06% 87.19%
(
%
)
Classification of High Resolution Remote Sensing Images Based on PCA, HSV and Texture Feature
519
The first three principal components and eight
common texture features of the first principal
component are analyzed by the gray level co-
occurrence matrix (GLCM), which are composed of
HSV images converted by bands 7 (near red), 5
(red ), 2 (blue), and original multispectral image is
converted into a multi-dimensional image that
combines spectral features and texture features.
Finally, the image is introduced into the
classification of Support Vector Machine (SVM)
classification.
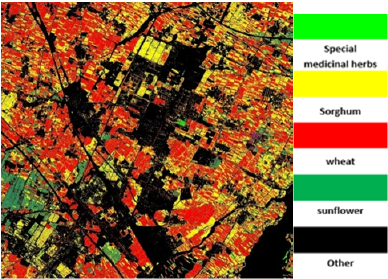
3.5 Results
The masked samples in the study area mainly
include the main types of special medicinal herbs,
wheat, sorghum, sunflower and orchard. The types
of masks are set as others. The samples are selected
and the study area is classified by using the SVM
classification method. The kernel of the
classification selection is Radial Basis Function. The
results are shown in Figure 6, and the classification
accuracy of the classified results was evaluated
using the ground survey plots (Table 1):
Figure 6: Classification result.
Orchard shows spectral mixture in remote
sensing images, due to intercropping techniques, and
can not be effectively evaluated for classification
accuracy. The classification accuracy was evaluated
only for four main crops: sorghum, special
medicinal herbs, sunflowers and wheat. The
production accuracy of sorghum, special medicinal
herbs, sunflower and wheat by ground truth test can
reach 99.45%, 97.47%, 95.06% and 87.19%,
respectively (see Table 1). Sorghum, special
medicinal herbs and sunflower are highly
distinguishable from other vegetation, and wheat
and sorghum have a certain degree of confusion.
However, the confusion areas are mainly
concentrated in the upper spectral mixing area of
field ridge and boundary, thus have little effect on
the overall classification accuracy. Since the
accuracy verification uses the ground survey area
and the coverage area is small, the classification
result evaluation accuracy is high, and the
verification accuracy of the whole image will be
slightly lower.
4 CONCLUSIONS
Based on the principal component analysis of the
image of the study area, this paper combines the
texture features of the first principal component of
PCA transform, the second and third principal
components of PCA transform, multispectral and
color space transform. Image classification is
conducted using SVM classifier. Overall accuracy of
the classification can reach 96.01%. Kappa
coefficient is 0.9249. The results show that:
The SVM classification method based on multi-
scale texture features of PCA and spectral
information data can be effectively applied to high-
resolution vegetation classification and fine
recognition. The result can achieve higher
classification accuracy.
The SVM classification method based on multi-
scale texture features of PCA and spectral
information data is relatively simple, fast and
adaptable. It can be used in remote sensing
applications such as emergency response and
disaster relief with rapid classification and
interpretation requirements.
Due to the mixed spectrum of field ridge or
boundary, wheat and sorghum are partially
misclassified when they are classified using the
proposed method. The future work is to further
improve the classification accuracy by introducing
more features and pre-performing image
segmentation, and to explore significant image
features of various types of objects to improve
processing speed and efficiency of classification
method.
IWEG 2018 - International Workshop on Environment and Geoscience
520
ACKNOWLEDGMENTS
The authors acknowledge anonymous reviewers for
their review and suggestions. This work was
supported by The Innovation Program of Academy
of Opto-Electronics(AOE), Chinese Academy of
Science (CAS)(Y50B11A1CY, Y70B16A15Y).
REFERENCES
Blaschke T 2010 Object based image analysis for remote
sensing Isprs Journal of Photogrammetry & Remote
Sensing 65(1) 2-16
Chen M, Su W, Li L, et al. 2008 A comparison of pixel-
based and object-oriented classification using SPOT5
imagery Wseas Transactions on Information Science
& Applications 6(3) 321-326
Li J J, He L H, D J F, et al. 2006 Extract enclosure culture
in lakes based on remote sensing image texture
information Journal of Lake Sciences 18(4) 337-342
Lu Y W, Li Q Z, Du, et al. 2015 A Method of Coastal
Aquaculture A rea Automatic Extraction with High
Spatial Resolution Images Remote Sensing
Technology and Application 30(3) 486-494
Mountrakis G, Im J, Ogole C 2011 Support vector
machines in remote sensing: A review International
Journal of Photogrammetry & Remote Sensing 66(3)
247-259
Wu T, Hu X, Zhang Y, et al. 2016 Automatic cloud
detection for high resolution satellite stereo images
and its application in terrain extraction IsprsJournal of
Photogrammetry & Remote Sensing 121 143-156
Xu W H 2010 Texture Analysis and Classification of
Remote SensingImage Based on Fractal Theory
CentralSouth University
Zhang S, Chen J F, Gong J Z 2016 Object-oriented
classification based on C5.0 algorithm Science of
Surveying and Mapping 41(6) 117-121
Zhao L, Meng L K, Zhang Y, et al. 2016 Research on joint
spectraland texture featuresSVM tidal classification
andextractionalgorithm Engineering of Surveying and
Mapping 25(1) 43-46
Zhao S H, Wang Q, YOU D A, et al. 2015 Application of
high resolution satellites to environmental protection
REMOTE SENSING FOR LAND & RESOURCES
27(4) 1-7
Zhong W D 2015 Submitted in Partial Fulfillment of the
Requirement For the MS Degree in Computer
Technology Central China Normal University
Classification of High Resolution Remote Sensing Images Based on PCA, HSV and Texture Feature
521
