
Studies on Groundwater Impacts by CSG Productions in Australia
Surat Basin
Ming Li
1,*
, Quan Wang
2
, Ming Zhang
1
, Xiangwen Kong
1
, Zhaohui Xia
1
, Hongjun Wang
1
, Zehong
Cui
1
and Jietang Lv
3
1
Research Institute of Petroleum Exploration & Development, Beijing, China;
2
China's oil and gas exploration and development company, Beijing, China;
3
China Institute of Geological Environment Monitoring, Beijing, China.
liming211@petrochina.com.cn,
Keywords: Coal seam gas (CSG), Surat Basin, groundwater, aquifer, hydraulic connection
Abstract: The Surat Groundwater system include shallow, intermediate, coal seam and deep groundwater system. The
shallow groundwater resources in Surat basin has been developed over the years for irrigation, stock,
domestic and other uses. Extraction water from this aquifer is critical to support the local irrigation. With
the large-scale CSG production beginning in the Surat basin, the hydraulic connection between the shallow
groundwater and coal seam water become a key problem. This paper first gives an introduction on geology
and hydrogeology of the region and then gives a brief view of CSG production affects the groundwater level
based on the Condamine interconnectivity test analysis, the monitor results of groundwater level and
groundwater level drawdown numerical model predictions. Results show that groundwater levels provide
little to no effect relative to CSG production. Further study and simulation work will continue to research
CSG and groundwater connections.
1 SURAT BASIN CSG
INTRODUCTION
The Surat basin is part of the Cretaceous-Jurassic
Great Artesian basin (GAB). The basin overlies the
Permo-Triassic Bowen Basin and is a relatively
undeformed intra-cratonic basin with overall layer-
cake stratigraphy (Exon, 1976). The regional seismic
section illustrates that the Surat basin is draped over
basement highs and separated by an unconformity
from the underlying Permian-Triassic sediments of
the Bowen Basin (SRK Consulting 2005). Coals
intersected in the Surat Basin are a member of the
Walloon Coal Measures (Figure 1). Most CSG
blocks are in the eastern margin of the Surat Basin.
AA Block is one of CSG blocks in the eastern most
of Surat basin. Most groundwater analysis comes
from AA CSG blocks.
The Walloon coal measures are Low-rank coal
measures with R
0
of 0.6% and are further divided
into the Juandah coal measures and the Taroom coal
measures. The Walloon coal measures are underlaid
by the Eurombah Formation and Hutton Sandstone
and overlaid by the Springbok Sandstone and its
equivalents, such as Kumbarilla Beds (Figure 2).
The complex architecture of Walloon Coal Measures
is a result of the highly variable depositional
environment. The relatively stable alluvial flood
plain allowed river channels to freely migrate and
disturb coal swamp development rapidly and
laterally (Scott, 2004).
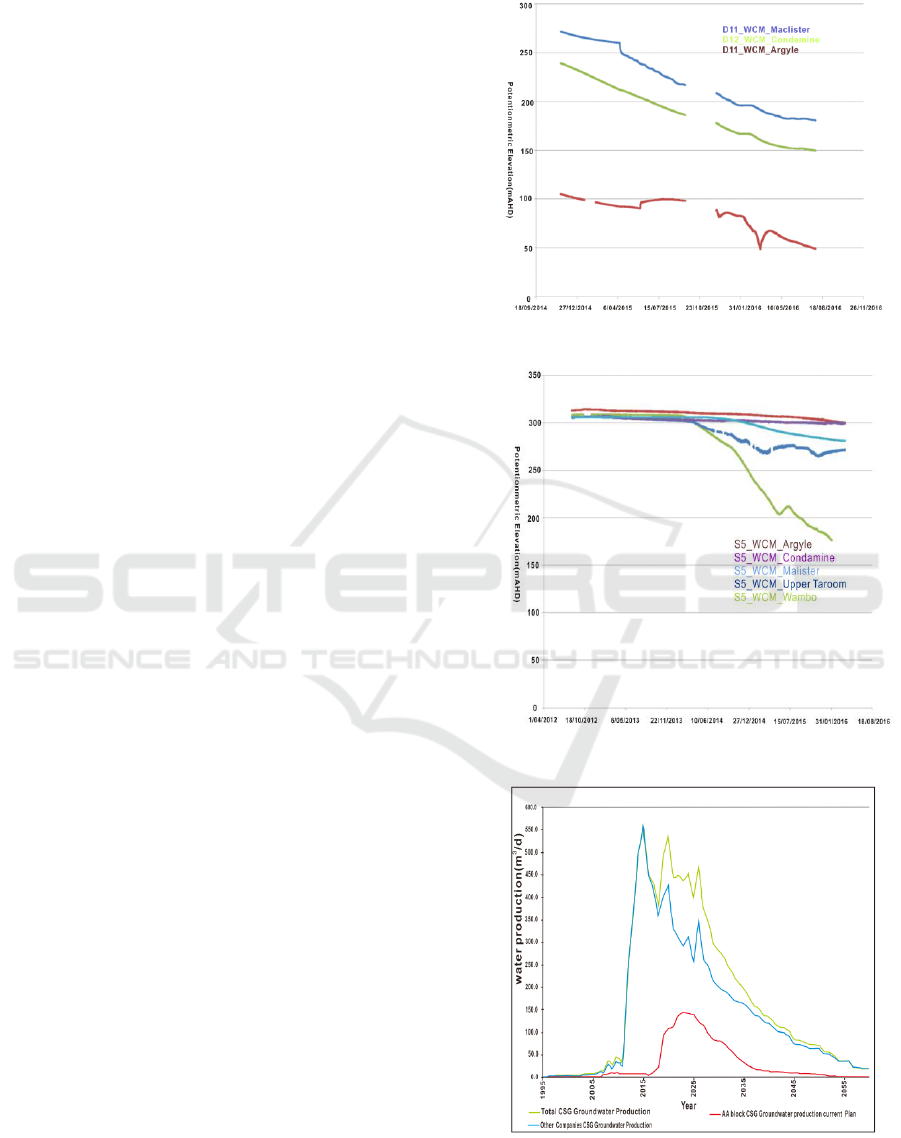
Many LNG projects are being constructed in
Australia. Among them, The CSG-LNG projects are
located in the east Australia (Figure 3). The gas
resources come from the Wallon Coal measures of
Surat Basin. This paper provides interconnectivity
analysis between the coal seams and the shallow
Condamine aquifers, the monitor results of
groundwater level and groundwater level drawdown
numerical model prediction.
214
Li, M., Wang, Q., Zhang, M., Kong, X., Xia, Z., Wang, H., Cui, Z. and Lv, J.
Studies on Groundwater Impacts by CSG Productions in Australia Surat Basin.
In Proceedings of the International Workshop on Environment and Geoscience (IWEG 2018), pages 214-218
ISBN: 978-989-758-342-1
Copyright © 2018 by SCITEPRESS – Science and Technology Publications, Lda. All rights reserved
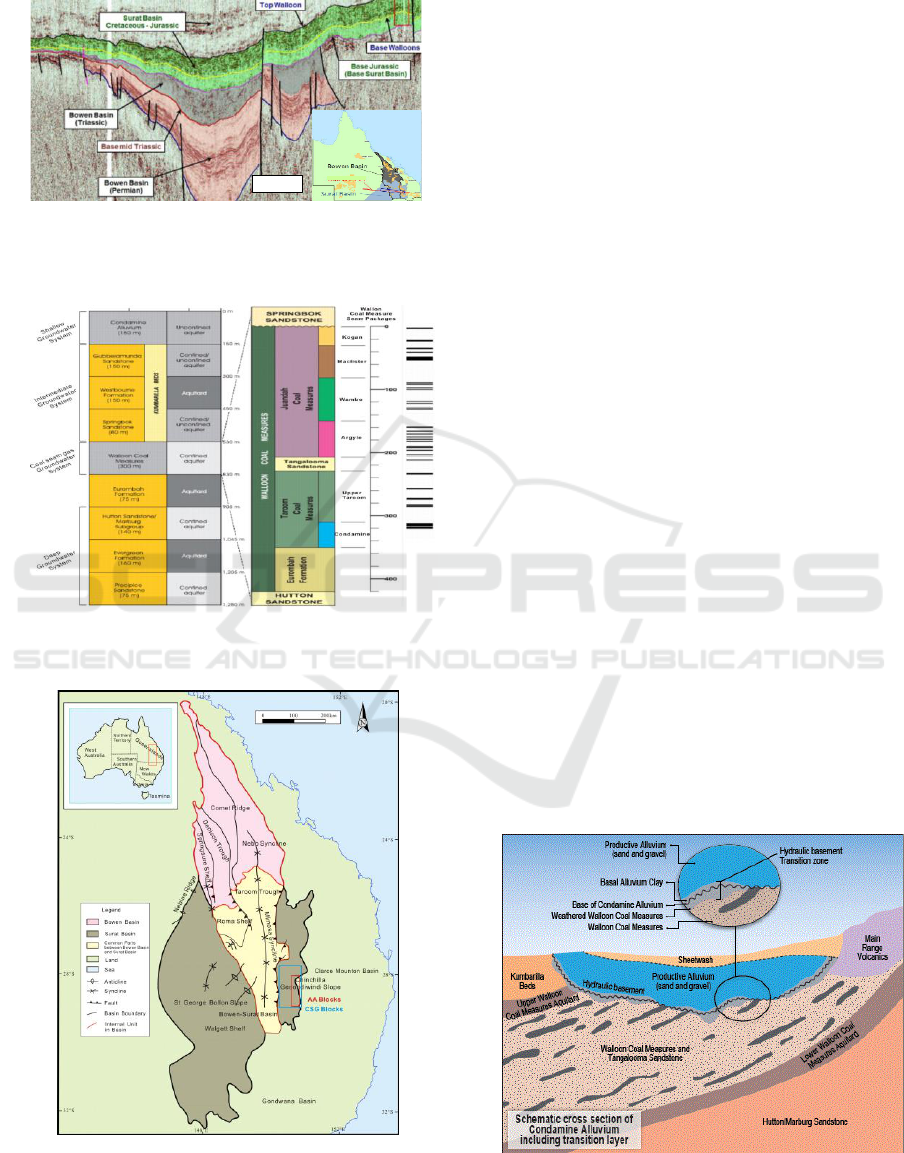
Figure 1: Regional seismic line across the center of
the Surat Basin.
Figure 2: Stratigraphy and groundwater systems in
Surat Basin.
Figure 3: CSG Blocks in Surat Basin.
2 SURAT BASIN
HYDROGEOLOGY REVIEW
AND GROUNDWATER
IMPACTS ANALYSIS
The Surat Basin is located on the eastern margin of
the GAB (Great Artesian Basin), which is
Australia’s largest contiguous groundwater resource.
The formations are exposed along this eastern
recharge zone include the Gubberamunda Sandstone,
Hutton Sandstone and Precipice Sandstone, and they
are found within the project development area. From
the recharge zone, subsurface groundwater flow
within the GAB is generally towards the southern,
southwestern, western and northern margins of the
GAB. In some areas, natural groundwater discharge
occurs via flowing artesian springs (Barnett and
Muller, 2008).
The aquifers in Surat Basin can be classified as
four aquifer units: shallow, intermediate, coal seam
and deep groundwater systems according to the
stratigraphy features. (Figure 2).
Shallow Groundwater Systems are quaternary
unconfined or water layer aquifers. They are named
as the Condamine Alluvium aquifers. Condamine
Alluvium aquifers generally have some general
characteristics that make good resource aquifers,
such as high permeability, high hydraulic
conductivity, substantial thickness, sandstone-like
storage characteristics, consistent characteristics
over large distances, and good quality groundwater,
but still they have some claystones as heterogeneous
layers in (Figure 4). The shallow groundwater
system provides the primary source of irrigation
water.
Figure 4: Surat Basin schematic groundwater model.
Basement
Studies on Groundwater Impacts by CSG Productions in Australia Surat Basin
215
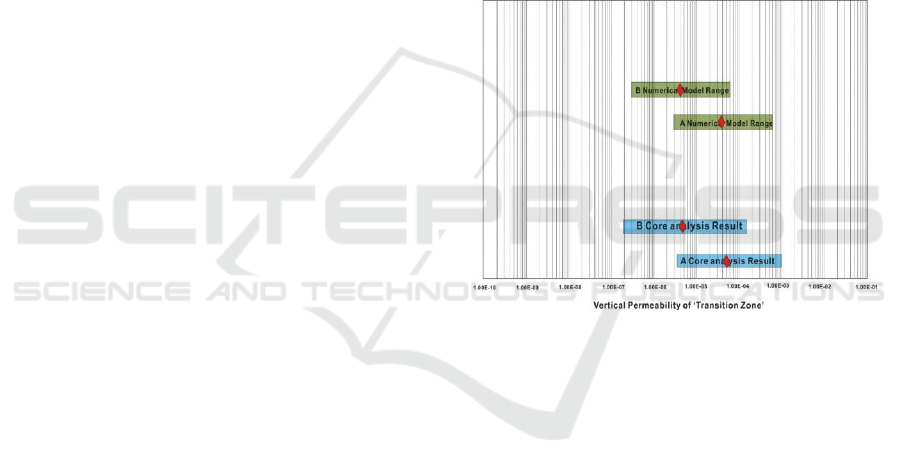
Intermediate Groundwater Systems include
confined aquifers located above the coal seam
formations.
Coal Seam Groundwater Systems are confined
aquifers associated with coal seam formations. It
include Walloon Coal Measures, but are variable
and have commonly with low permeability and/or
low water quality.
Deep Groundwater Systems: confined porous
aquifers located below the Walloon Coal Measures
formation. They include the Marburg Formation,
Hutton Sandstone and Precipice Sandstone (Arrow
Energy 2012; CSIRO 2008; Henning, 2005).
Groundwater movement in the major confined
aquifers of the Surat Basin is predominantly
horizontal. The lower permeability units between
these aquifers (aquitards) restrict vertical
interconnection between the groundwater systems.
In this situation, there is no impact to groundwater
by CSG production; however, vertical inter-aquifer
flow may occur in areas where the aquitards are
thinner or eroded. In addition, if significant
groundwater pressure differences occur across
different formations, then inter-aquifer groundwater
flow can occur. In these cases, groundwater
influence by CSG production should be calculated
and taken actions to ensure the safety of irrigation,
stock, and domestic uses of groundwater. Three
analysises of observing groundwater impacts by
Surat CSG production shows in the following
sections.
2.1 The Condamine Interconnectivity
Analysis
The groundwater resources of the Condamine
Alluvium Aquifer been used for irrigation, stock and
domestic uses. Communities have expressed concern
that groundwater extraction from the CSG wells
could lead to reduced groundwater availability from
the Condamine Alluvium aquifer. The objective of
investigations is to provide scientific evidence about
whether CSG development near Condamine
Alluvium would have impact on groundwater
supplies for irrigation (Scott et al., 2004).
Four underground water-monitoring bores were
drilled on two separate intensively farmed properties
in the Condamine Alluvium area. Aquifer pumping
tests in the bores were undertaken at two locations:
‘A’ in 2013 and ‘B’ in 2014, adjacent to the existing
irrigation bores.
The analysis on the core porosity, permeability,
mineralogy and geophysical logs of groundwater
monitoring bores showed the formation layers and
the lithology type. Then the density, porosity and
permeability of the layers can be determined. The
result shows the vertical permeability of “transition
zone “of A and B is about 3.5x1E
-6
-1.0x1E
-6
m/day
and 2.0x1E
-7
m/day-1.6x1E
-4
-1.6x1E
-4
m/day
respectively (Figure 5).
The results from A and B are consistent with the
vertical permeability used in the current numerical
model and vertical permeability from B indicates the
site is less permeable than A. These results verified
that there is only a low level of hydraulic connection
between the Condamine Alluvium and the
underlying Walloon Coal Measures.
Figure 5: The comparison plot between Model and
core analysis.
2.2 Groundwater Level Monitor
Analysis
There are many water monitor wells drilled to
survey the water level alteration. Since 2009, the
potentiometric elevations of 15 wells have been
draw down little by little. Figure 6 (different color
lines are different coal seams) shows two CSG fields
potentiometric elevation drawdown results. D11 and
D12 well are from D Field of Block AA, S5 well is
from S Field in Block AA. Noticeable
potentiometric elevation drawdown(20m-135m) in
the different coal seams of Wallon coal measures
appears according to Figure 6a and Figure 6b results,
which indicate the produced water only come from
Walloon confined aquifer, not from the flux between
the underlying and overlying aquifers. The Walloon
Coal Measures are low permeability sediments and
IWEG 2018 - International Workshop on Environment and Geoscience
216
there are shale zone between different groundwater
systems (Schlumberger 2011).
2.3 The Groundwater Level Drawdown
Predication Analysis
In order to know the groundwater level alternations,
the numerical groundwater model was analyzed to
provide estimates of drawdown in response to the
abstraction of groundwater associated with CSG
activities.
The MODFLOW EVT software packages are
used to model the cumulative groundwater case. The
cumulative case models all current and proposed
water extraction from CSG activities from 1995
onwards.
Total modelled extraction from CSG projects
showed in Figure 7. The extraction include CSG
water extraction from block AA and other
company’s CSG extractions by considering their
CSG development plans. The result suggests a
cumulative peak extraction of around 550 ML/d in
2015, or around 20 years into the ‘predictive’
simulation, which runs from 1995 onwards
(Department of Natural Resource and Mines 2012).
Figure 8 identifies areas where the predicted
cumulative maximum impact drawdowns based on
the predication simulation result exceed 5 m in each
of the affected aquifers. As expected, the impacted
area is greatest in the WCM and gradually reduces
in the various underlying and overlying aquifers.
Predicate result suggest predicted maximum
cumulative drawdown impacts of more than 5 m in
the Springbok Sandstone, Walloon Coal Measures,
Hutton Sandstone, Precipice Sandstone (GHD 2013;
Geoscience Australia and Habermehl M.A 2010). The
cumulative drawdowns of other aquifers are
indistinct. The cumulative model result shows there
are no pronounced impacts for the groundwater
alteration in Surat Basin by considering all the CSG
activities from 1995 onwards.
Figure 6a: D Field groundwater monitor map.
Figure 6b: S Field groundwater monitor map.
Figure 7: CSG and other extraction in Surat Basin.
Studies on Groundwater Impacts by CSG Productions in Australia Surat Basin
217
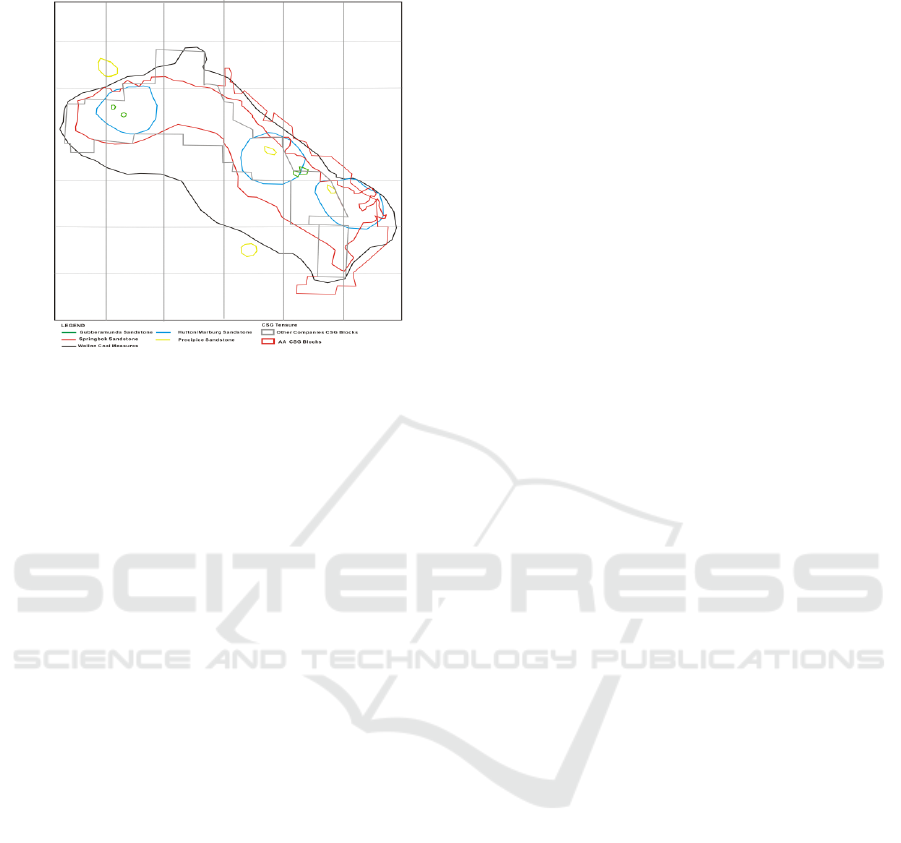
Figure 8: Maximum 5m Drawdown Contours.
3 CONCLUSIONS
There are a low level of hydraulic connection
between the Condamine Alluvium and the
underlying Walloon Coal Measures according to
core analysis and Condamine Interconnectivity
study result.
The potentiometric elevations drawdown result
from water monitor wells near CSG fields shows the
produced water only from Walloon confined aquifer,
not from the flux between the underlying and
overlying aquifers.
According to predicating result from
groundwater model based on CSG and other
extraction in Surat basin, there are no pronounced
impacts for the groundwater alteration in Surat
Basin. Further study and simulation work will go on
with the change of CSG and other activities.
REFERENCES
Arrow Energy 2012. Water Management Strategy – Surat
Gas Project
Barnett BG and Muller J 2008 Upper Condamine
Groundwater Model Calibration Report. A report for
the Australian Government from CSIRO Murray-
Darling Basin Sustainable Yields Project. CSIRO,
Australia. 51
CSIRO 2008 Implications for climate change for
Australia’s national reserve system. Department of
Environment, Water, Heritage and the Arts. Australian
Government
Department of Natural Resource and Mines 2012 Upper
Condamine Alluviums groundwater system –
Background summary, September 2012
Exon NF 1976 Geology of the Surat Basin in
Queensland.,Bureau of Mine Resources.
Geoscience Australia and Habermehl M.A 2010 Summary
of advice in relation to the potential impacts of coal
seam gas extraction in the Surat and Bowen Basins,
Queensland. Phase One Report Summary for
Australian Government Department of Sustainability,
Environment, Water, Population and Communities.
Canberra, Australian Capital Territory
GHD 2013 Arrow Energy Surat Gas Project Groundwater
Modelling Report. Report prepared for Arrow Energy,
June 2013
Henning A 2005 A summary of the hydrogeology of the
Southern Euromanga and Surat Basins of the Great
Artesian Basin. CO2CRC/CSIRO Petroleum,
Australia, June 2005. COO2CRC Report Number
RPT05-2004
Schlumberger 2011 Groundwater modelling of the Surat
Basin. Final report for Arrow Energy Ltd. April 2011
Scott S, Anderson B, Crosdale P, Dingwall J and Leblang
G. 2004. Revised Geology and Coal Seam Gas
Characteristics of the Walloon Subgroup – Surat Basin,
Queensland, PESA Eastern Australian Symphosium II,
September 2004
Scott SG 2004 Revised geology and Coal seam gas
characteristics of the Walloon subgroup- Surat
Basin,Queensland
SRK Consulting 2005 Bowen and Surat basins regional
structural framework study. Queensland: Queensland
Government
IWEG 2018 - International Workshop on Environment and Geoscience
218
