
The Distribution of Precipitation in the Qilian Mountains
Chuancheng Zhao
1,2
and Shuxia Yao
1, *
1
Lanzhou City University, Lanzhou 730070, China;
2
State Key Laboratory of Cryospheric Science, Cold and Arid Regions of Environmental and Engineering Research
Institute, Chinese Academy of Sciences, 320 Donggang West Road, Lanzhou 730000, China.
Email:yaoshuxia@163.com
Keywords: Precipitation, spatiotemporal distribution, topography, Qilian Mountains
Abstract: Precipitation in the mountains plays a significant role in providing water for the sustainable development of
oasis cities downstream. The precipitation data of 49 national meteorological stations that surround the
Qilian Mountains were analysed during the period from 1980 to 2013. The results show that the
precipitation is affected not only by the source of water vapour, but also by the topography. The distribution
of mean annual precipitation decreased from southeast to northwest. The value of precipitation is high
around Qinghai Lake. Considering the seasonal distribution, the summer precipitation accounts for above
half of annual precipitation, whereas the winter precipitation accounts for below 10% of annual precipitation.
1 INTRODUCTION
Precipitation is a critical component of the global
water cycle frequently influencing the availability of
water resoureces (Ngongondo C S 2006;
Michaelides S et al., 2009). Understanding its
spatiotemporal distribution at various scales is an
important step toward a better recognizing the
hydrological cycle and associated phenomena such
as drought and flood. Such information may be
finally used to address current climate variations and
future climate change to dryland agriculturalists and
policymakers (Crochet et al., 2007, Batisani et al.,
2010; Westerberg et al., 2010). Generally, the
precipitation data has been obtained by in situ
observation, remote sensing and numerical
modelling (Michaelides S et al., 2009). Although
remote sensing and numerical modelling have
proved the spatially complete coverage resolution,
such approaches are subjected to different types of
errors such as inherent measurement, retrieval errors,
and sampling uncertainty. Meanwhile, the accuracy
of remote sensing and numerical modelling need to
be calibrated or verified using the ground
measurement (New et al., 2001; Xie et al., 2003).
The precipitation data from rain gauge measurement
is considered to be the most accurate even though
they suffered from different types of errors such as
sampling, inherent measurement, and uncertainty in
sub-catchment (Chen et al., 1997).
Mountains exert a major role in maintaining the
water supply for ecological environment and the
sustainable development of oasis cities downstream,
as they are the main contributor to runoff (De et al.,
2009; López-Moreno et al., 2011). Due to the
complex terrain, the distribution pattern of
precipitation is frequently linked to the
morphological parameters such as altitude and
airflow direction in mountain regions (Daly et al.,
2002; Sinclair 2010). Furthermore, used
meteorological stations are sparsely distributed and
most of them are located in foothill regions.
Therefore, the precipitation pattern is hardly
discernible in the summit area. Investigation of
spatiotemporal distribution of precipitation makes it
very challenging for hydrological cycle and climate
change in mountains regions.
The aim of this study is to clarify the
spatiotemporal distribution of precipitation in the
Qilian Mountains during the period 1980-2013 using
the data from 49 meteorological stations. We
analyze (i) the annual and seasonal distribution of
precipitation and (ii) the relationship between
precipitation and topography in mountain regions.
194
Zhao, C. and Yao, S.
The Distribution of Precipitation in the Qilian Mountains.
In Proceedings of the International Workshop on Environment and Geoscience (IWEG 2018), pages 194-198
ISBN: 978-989-758-342-1
Copyright © 2018 by SCITEPRESS – Science and Technology Publications, Lda. All rights reserved

2 S
T
2.1
S
The Qi
l
103°00'
E
region o
f
of the T
i
Tian et
a
northeas
stretche
s
west, an
d
to the n
o
Qilian
M
(e.g. Tu
a
are hig
h
number
the Qil
i
(includi
n
River) i
n
the alpi
n
p
osition
Euro-As
East A
s
circulati
o
al.,2009
)
b
etween
b
oth sp
a
ranges
fr
Winter
relativel
y
concent
r
2.2
D
We acq
u
Climate
Admini
s
measure
In total,
study ar
e
while
m
(below
meteoro
l
missing
too shor
t
results,
t
from the
T
UDY AR
E
S
tud
y
Area
l
ian Mounta
i
E
), are locat
e
f
northwester
n
i
betan Platea
u
a
l., 2017). It
b
t and the Q
a
s
approximat
e
d
approximat
e
o
rth (Zhang e
t
M
ountains is
b
a
njie Peak, 5,
8
h
er than 40
0
of modern g
l
i
an Mountai
n
n
g Shiyang
R
n
the arid nor
t
n
e regions (
Z
of the Qilia
n
ia continent,
s
ian monso
o
o
n above t
h
)
. The mea
n
150–410 m
m
a
ce and time.
fr
om -0.3 ℃
t
is quite col
d
y
hot. Th
r
ated in May t
D
ata
u
ired the prec
i
Centre of
C
s
tration - CM
A
the precipita
t
58 meteorol
o
e
a are availa
b
m
ost of the
m
3000 m a.s.
l
l
ogical statio
n
data, and fo
u
t
records. In
o
t
hese meteor
o
e
analysis.
E
A AND
D
i
ns (36°30'–
3
e
d in the ar
i
n
China, at th
e
u
(Figure 1) (
Q
b
orders the H
e
a
idam Basin
i
e
ly 850 km fr
o
e
ly 250-400
k
t
al., 2015).
T
b
etween 2000
8
26 m a.s.l.),
0
0 m a.s.l..
T
l
aciers in th
e
n
s, and
m
a
n
R
iver, Heihe
t
hwestern Ch
i
Z
hang et al.
n
Mountains
the moisture
o
n, westerly
h
e Tibetan
P
n
annual pr
e
m
and is unev
e
The mean a
n
t
o 8.1 ℃ (W
d
and dry,
w
e precipita
t
o September.
i
pitation data
f
C
hina (Chin
a
A
). The mete
o
t
ion with reso
o
gical station
s
b
le for the per
i
m
are located
l
.; Figure 1)
n
s with mor
e
u
r meteorolo
g
o
rder to ensur
e
o
logical statio
n
D
ATA
3
9°30'N, 93°
i
d and semi
-
e
northern m
a
Q
iang et al., 2
0
e
xi Corridor i
n
i
n the south
w
o
m the east t
o
k
m from the s
o
T
he altitude o
f
and 6000 m
a
m
ost of the p
e
T
here is a
g
summit par
t
n
y inland r
i
River and S
h
i
na originate
f
, 2007). Du
e
in the interi
o
co
m
es fro
m
circulation
P
lateau (Tia
n
e
cipitation v
a
e
nly distribut
e
n
nual temper
a
a
ng et al., 2
0
w
hile summ
e
ion is m
a
f
rom the Nati
o
a
Meteorolo
g
o
rological sta
t
lution of 0.1
m
s
surroundin
g
i
od of 1980–
2
in the foot
h
. There are
e
than 1 ye
a
g
ical stations
w
e
the reliabili
t
n
s were excl
u
°
30'–
-
arid
a
rgin
0
16;
n
the
w
est,
o
the
o
uth
f
the
a
.s.l.
e
aks
g
reat
t
s of
i
vers
hule
f
rom
e
to
o
r of
m
the
and
n
et
a
ries
e
d in
a
ture
0
09).
e
r is
a
inly
onal
g
ical
t
ions
m
m.
g
the
2
013
t
hills
five
a
r of
w
ith
t
y of
u
ded
Fig
u
the
3
3.
1
Th
e
ea
c
19
8
of
m
usi
n
me
t
ran
me
a
to
s
no
r
He
x
cir
c
to
f
M
o
the
for
m
Qil
in
inf
l
Ob
v
oc
c
ind
sp
a
u
re 1: The dist
r
Qilian Mounta
i
RESUL
T
1
The Di
s
Precipi
t
e
mean annu
c
h meteorolo
g
8
0–2013 in th
e
m
ean annual
p
n
g inverse di
s
t
hod (Figure
ges between
a
n annual pr
e
s
outheast. Th
e
r
th of Qaida
m
x
i Corridor.
c
ulation has
b
f
orm precipit
a
o
untains. Bec
a
circulation
a
m
ed the prec
i
ian Mountain
the east pa
r
l
uenced by
v
iously, high
c
urred aroun
d
icates that t
h
a
tial distributi
o
r
ibution of the
m
i
ns
T
S
s
tribution
o
t
ation
a
l precipitati
o
g
ical station
e
Qilian Mou
n
p
recipitation i
s
tance weight
e
2). The mea
n
24 to 538 m
m
e
cipitation inc
e
precipitatio
n
Basin and s
o
After long
d
b
rought little
m
a
tion in the
w
a
use of the e
f
a
bove the Ti
b
p
itation in th
e
s
. However, t
h
r
t of Qilian
East Asian
values of me
a
d
the Qing
h
h
e large wate
o
n of precipit
a
m
eteorological
o
f Annual
o
n was calc
u
during the
p
nt
ains. The di
i
s spatially in
t
e
d (IDW) int
e
a
n annual pr
e
m
. The distr
i
c
reased from
n
n
is obviousl
y
o
uth of the w
e
d
istance, the
moisture, an
d
w
est part of t
h
f
fect of Qaid
a
b
etan Plateau
e
southwest
p
h
e precipitati
o
Mountains
monsoon ci
a
n annual pr
e
h
ai Lake. I
e
r body influ
e
a
tion around.
stations in
u
lated for
p
eriod of
stribution
t
erpolated
e
rpolation
cipitation
b
ution of
n
orthwest
y
lower in
e
st part of
westerly
d
difficult
h
e Qilian
a
m Basin,
is hardly
p
art of the
o
n is high
which is
r
culation.
cipitation
t
clearly
e
nces the
The Distribution of Precipitation in the Qilian Mountains
195
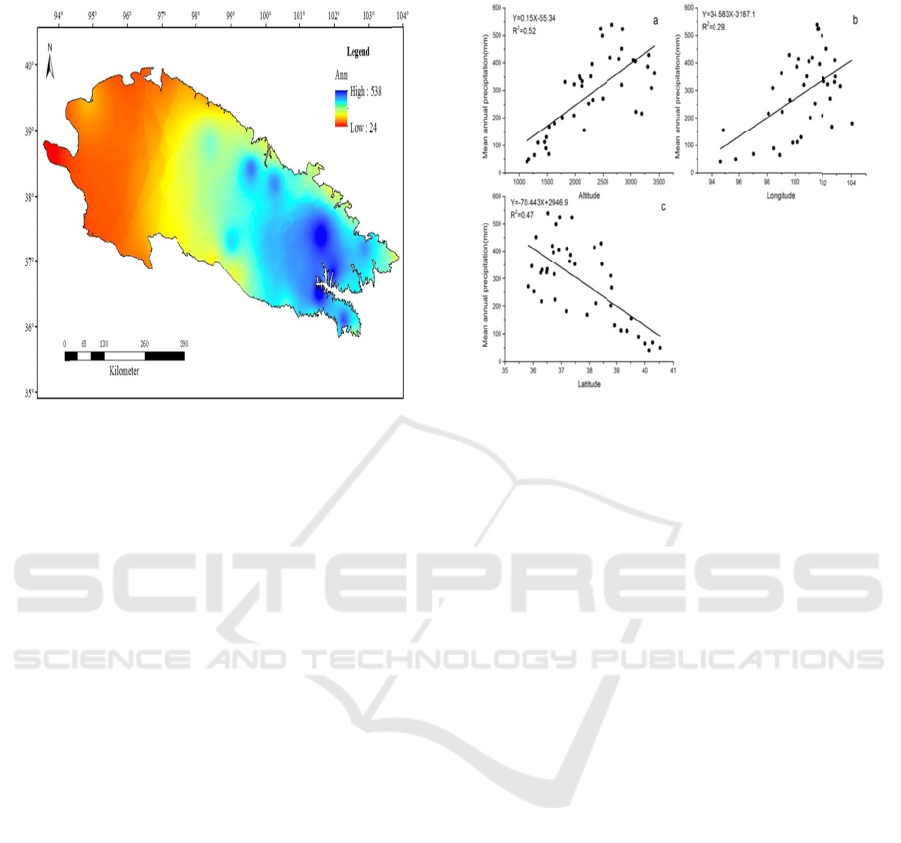
Figure 2:
the Qilia
n
Figu
r
mean a
n
characte
r
longitud
e
mean an
n
signific
a
0.69, r
e
b
etween
value o
15mm/1
0
a.s.l.), t
h
altitude
p
recipit
a
observe
stations
a
catch ra
t
b
ecause
wind.
T
annual
p
recipit
a
increase
d
p
ositive
p
recipit
a
caused
b
stations
located
i
The distributi
o
n
Mountains
r
e 3 illustrat
e
n
nual precip
r
istics of th
e
e and latitu
d
n
ual precipit
a
a
nt, with corr
e
e
spectively.
mean annua
l
f mean an
n
0
0m (Figure
3
h
e relations
h
is ambiguo
u
a
tion. Genera
l
the rainfall
a
t higher altit
u
t
io of snowfa
l
the snowfall
T
he correlati
o
precipi
t
atio
n
a
tion decreas
e
d
one degree
correlatio
n
a
tion and lon
g
b
y uneven
d
(the most of
i
n the eastern
p
o
n of mean an
n
e
s the relatio
n
itation and
e
analyzed
s
d
e). The co
r
a
tion and altit
u
e
lation coeffi
c
The correla
t
l
precipitatio
n
n
ual precipit
a
3
a). At high
a
h
ip between
p
u
s due to
c
l
ly, the mete
o
in lower a
l
u
des observe
l
l is lower th
a
can be more
e
o
n is negativ
n
and latit
u
e
d by 70.4
m
(Figure 3c).
n
between
g
itude (Figur
e
d
istribution
o
the meteoro
l
p
art of the Qi
l
n
ual precipitati
o
n
ship betwee
n
t
he geograp
h
s
tations (altit
u
r
relation bet
w
u
de and latitu
d
c
ient of 0.71
t
ion is pos
i
n
and altitude
;
a
tion gradie
n
a
ltitude (>30
0
p
recipitation
c
omplex typ
e
o
rological sta
t
l
titudes, wh
e
the snowfall.
a
n that of rai
n
e
asily affecte
d
e
between
m
u
de, the
m
m
m with lati
t
There is a
w
mean an
n
e
3b). It coul
d
o
f
m
eteorolo
g
l
ogical statio
n
l
ian Mountai
n
o
n in
n
the
h
ical
t
ude,
w
een
d
e is
and
i
tive
;
the
n
t is
0
0 m
and
e
of
t
ions
e
reas
The
n
fall
d
by
m
ean
m
ean
tude
w
eak
n
nual
d
by
g
ical
n
s is
n
s).
Fig
u
an
d
3.
2
Th
e
ea
c
Qil
is
v
ind
rel
a
Wi
t
p
re
Qil
Th
e
b
et
w
ma
x
ma
x
30
0
the
M
o
As
i
rap
4c)
p
re
mo
n
u
re 3: Relation
s
d
(a) altitude, (b
)
2
The Di
s
Precipi
t
e
mean seaso
n
c
h station dur
i
ian Mountai
n
v
ery low; th
e
ividual regi
o
a
tionship bet
w
t
h the risin
g
cipitation inc
r
ian Mountai
n
e
mean se
a
w
een 3 mm
x
imum is loc
x
imum of m
0
mm. Precip
area from th
e
o
untains (Fig
u
i
a monsoon, t
h
idly to the s
a
. Therefore
cipitation is
m
n
soon.
s
hips between
m
)
longitude, an
d
s
tribution
o
t
ation
n
al precipitat
i
i
ng the perio
d
n
s. In winter,
t
e
value is les
o
ns (Figure
w
een precipit
a
g
temperatur
e
r
eases rapidl
y
n
s affected b
y
sonal preci
p
to 120 mm
(
a
ted around
t
e
an summer
i
tation highe
r
e
east to the
m
u
re 4b). With
h
e mean fall
p
a
me level as
,
the vari
a
m
ainly influe
n
m
ean annual p
r
d
(c) latitude
o
f Seasona
l
ion was calc
u
d
of 1980–2
0
the mean pr
e
s
s than 10 m
m
4d). Ther
e
t
ation and to
p
e
, the mean
y
in eastern p
y
East Asian
m
p
itation of
s
(
Figure 4a),
w
t
he Qinghai
L
precipitation
r
than 200
m
m
id-west of
t
the weakeni
n
p
recipitation
during sprin
g
i
ability of
n
ced by the
E
r
ecipitation
l
u
lated for
0
13 in the
cipitation
m
except
e
is no
p
ography.
seasonal
art of the
m
onsoon.
s
pring is
w
hile the
L
ake. The
is up to
m covers
t
he Qilian
n
g of East
d
ecreases
g
(Figure
seasonal
E
ast Asian
IWEG 2018 - International Workshop on Environment and Geoscience
196
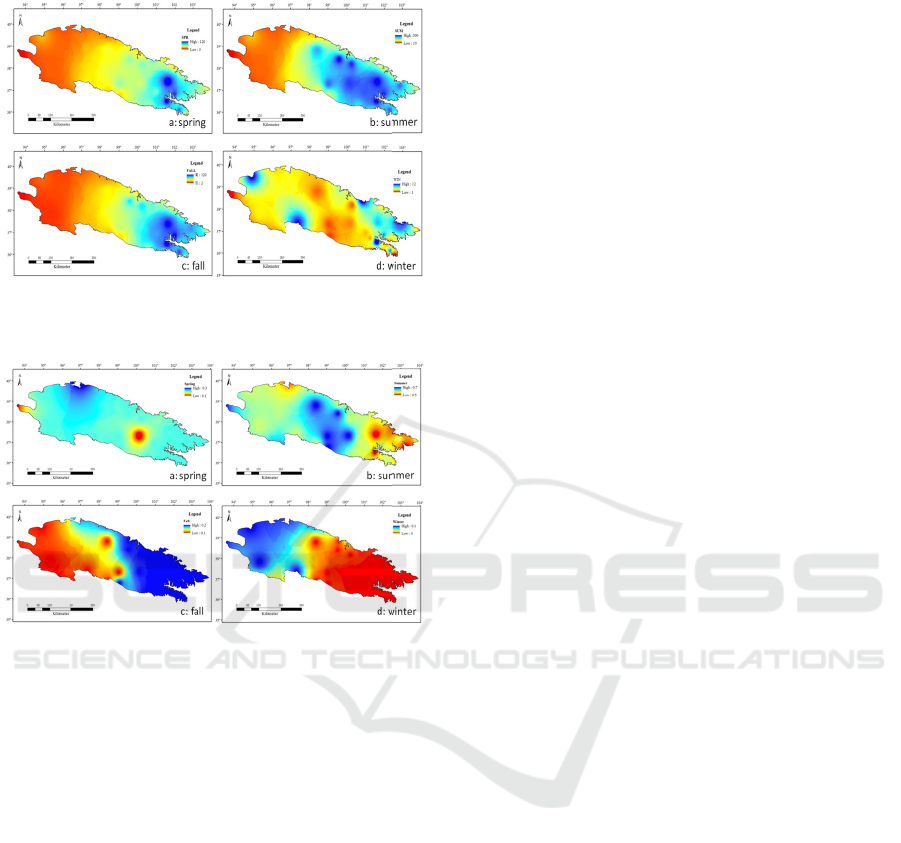
Figure 4:
in the Qil
Figure 5
:
p
recipita
t
The
p
recipit
a
the pre
c
b
etween
calculat
e
p
eriod
o
winter,
characte
r
southea
s
30%. E
x
ratio is
m
In sum
m
while th
elevated
ratio ra
n
winter, t
h
southea
s
summer
,
annual p
The distributi
o
l
ian Mountains
:
The percent
a
t
ion in the Qili
a
seasonal
c
a
tion totals is
c
ipitation di
seasonal a
n
e
d for each m
e
o
f 1980–201
3
the ratio i
s
r
istic is d
e
s
t. In spring,
x
cept individ
u
m
ore consiste
n
m
er, the ratio
e highest val
u
parts of the
n
ges between
h
ere is an inc
r
s
t. Overall, th
e
,
which acc
o
p
recipitation.
o
n of mean se
a
a
ge distributio
n
a
n Mountains
c
ontribution
also an imp
o
stribution (
F
n
d annual
p
e
teorological
3
in the Qili
a
s
less than
e
creased fro
m
the ratio is
b
u
al regions, t
h
n
t across the
Q
ranges betwe
u
es are distri
b
central mou
n
10% and 20
r
ease from th
e
e
precipitatio
n
o
unt for mor
e
a
sonal precipit
a
n
of seasonal
m
to the an
n
o
rtant variabl
e
F
igure 5).
R
p
recipitation
station durin
g
a
n Mountain
s
10%, and
m
northwest
b
etween 10%
h
e distributio
n
Q
ilian Mount
a
en 50% and
7
b
uted in the
m
n
tains. In fall
,
%
. In contra
s
e
northwest t
o
n
mainly occu
r
e
than a hal
a
tion
m
ean
nual
e
for
R
atio
was
g
the
s
. In
the
t
to
and
n
of
a
ins.
7
0%
m
ost
,
the
s
t to
o
the
r
s in
f of
4
In
an
n
(53
rel
a
p
re
lati
t
Th
e
hal
f
oc
c
sig
n
eas
the
the
of
Q
A
C
Th
i
Sci
41
4
gra
Cr
y
En
v
Ch
i
La
b
Sy
s
an
d
for
R
E
Bat
i
Ch
e
Cr
o
Dal
De
CONCL
the Qilian
M
n
ual precipit
a
0 mm) to
a
tionship is
cipitation a
n
t
ude and lo
n
e
precipitatio
n
f
of annual p
c
ur during wi
n
n
ificantly aff
e
t
ern part, wh
i
westerly cir
c
circulation a
b
Q
aidam basin
C
KNOW
L
i
s study was
ence Founda
t
4
71060). The
t
itude to Dr.
Q
y
ospheric Sc
i
v
ironmental
a
i
nese Acade
m
b
oratory of
s
tems (Minis
t
d
Environme
n
their valua
b
l
e
E
FEREN
C
i
sani N, Yar
n
variability a
n
implications
policy.
A
pplie
d
e
n M, Xie P,
J
p
recipitation:
a
observations.
B
Society 78(11)
o
chet P, Jóha
n
Björnsson H,
P
the spatial dist
r
a linear mode
l
Hydrometeoro
y C, Gibson
W
Pasteris P A 2
0
statistical map
p
99-113
Jong C, La
w
U
SIONS
M
ountains, th
e
t
ion decreas
e
the north
w
significant
n
d topograp
h
n
gitude of
m
n
mostly occ
u
r
ecipitation,
w
n
ter. In summ
a
e
cted by East
le the influen
c
c
ulation in t
h
b
ove the Tibe
t
.
L
EDGME
N
supported b
y
t
ion of Chin
a
authors wou
l
Q
D Zhao, S
t
i
ence, Cold
a
a
nd Engineer
i
m
y of Science
s
Western C
h
r
y of Educat
i
n
tal Sciences
,
e
suggestions
a
C
ES
n
al B and
Y
n
d trends i
n
for climat
e
d
Geography 3
0
ohn E and Ph
i
a
50-yr monthl
y
B
ulletin of the
A
2539-2558
n
nesson T, Jó
n
P
álsson F and
B
r
ibution of pre
c
l
of orographic
l
ogy 8(6) 1285
-
W
P, Taylor
G
0
02 A knowle
d
p
ing of climat
e
w
ler D and E
s
e
distribution
e
d from the
w
est (20 m
m
between a
m
h
y such as
m
eteorological
urs in summ
e
w
hile the lo
w
a
ry, the preci
p
Asian mons
o
n
ce is not sign
h
e western p
a
e
tan Plateau i
n
N
T
y
the Nation
a
a
(No. 41771
l
d like to ex
p
t
ate Key Lab
o
and Arid R
e
i
ng Research
s
, Dr. X Y
W
hina's Envi
r
i
on), College
,
Lanzhou
U
and cooperat
i
Y
arnal B 201
0
n
semi-arid
e
change
0
(4) 483-489
i
llip A 1997
G
y
analysis base
d
A
merican Met
e
n
sson T, Sig
u
B
arsta
d
I 2007
E
c
ipitation in ic
e
c
precipitation.
J
-
1306
G
H, Johnson
d
ge-
b
ased appr
o
e
. Climate Rese
s
sery R 2009
of mean
southeast
m
). The
m
ount of
altitude,
stations.
e
r with a
w
est totals
p
itation is
o
on in the
i
ficant by
a
rt due to
n
the edge
a
l Natural
087; No.
p
ress their
o
ratory of
e
gions of
Institute,
W
ang, Key
r
onmental
of Earth
U
niversity,
i
on.
0
Rainfall
botswana:
adaptation
G
lobal land
d
on gauge
e
orological
u
rðsson O,
E
stimating
e
land using
J
ournal of
G L and
o
ach to the
a
rch 22(2)
Mountain
The Distribution of Precipitation in the Qilian Mountains
197

hydroclimatology and snow seasonality and
hydrological change in mountain environments.
Hydrological Processes 23 955-961
López-Moreno J I, Vicente-Serrano S M, Morán-Tejeda E,
Lorenzo-Lacruz J, Kenawy A and Beniston M 2011
Effects of the north atlantic oscillation (nao) on
combined temperature and precipitation winter modes
in the mediterranean mountains: observed
relationships and projections for the 21st
century. Global & Planetary Change 77(1–2) 62-76
Michaelides S, Levizzani V, Anagnostou E, Bauer P,
Kasparis T and Lane J E 2009 Precipitation:
measurement, remote sensing, climatology and
modeling. Atmospheric Research 94(4) 512-533
New M, Todd M, Hulme M and Jones P 2001
Precipitation measurements and trends in the twentieth
century. International Journal of Climatology 21(15)
1889–1922
Ngongondo C S 2006 An analysis of long-term rainfall
variability, trends and groundwater availability in the
mulunguzi river catchment area, zomba mountain,
southern malawi. Quaternary International 148(1) 45-
50
Qiang F, Zhang M, Wang S, Liu Y, Ren Z and Zhu X
2016 Estimation of areal precipitation in the qilian
mountains based on a gridded dataset since
1961. Journal of Geographical Sciences 26(1) 59-69
Sinclair M R 2010 A diagnostic model for estimating
orographic precipitation. Journal of Applied
Meteorology 33(10) 1163-1175
Tian H, Yang T and Liu Q 2017 Climate change and
glacier area shrinkage in the qilian mountains, china,
from 1956 to 2010. Annals of Glaciology 55(66) 187-
197
Tian Q H, Gou X H, Yong Z, Wang Y S and Fan Z X
2009 May-june mean temperature reconstruction over
the past 300 years based on tree rings in the qilian
mountains of the northeastern tibetan plateau. Iawa
Journal 30(4) 421-434
Wang H J, Zhang B, Jin X H, Zhang H, Liu J F and Dai S
P 2009 Spatio-temporal Variations Analysis of Air
Temperature and Precipitation in Qilian Mountainous
Region Based on GIS. Journal of Desert Research
29(6) 1196-1202
Westerberg I, Walther A, Guerrero J L, Coello Z, Halldin
S, Xu C Y, Chen D and Lundin L C 2010
Precipitation data in a mountainous catchment in
honduras: quality assessment and spatiotemporal
characteristics. Theoretical & Applied
Climatology 101(3-4) 381-396
Xie P, Janowiak J E, Arkin P A, Adler R, Gruber A,
Ferraro R, Huffman G J and Curtis S 2003 Gpcp
pentad precipitation analyses: an experimental dataset
based on gauge observations and satellite estimates.
Journal of Climate 16(16) 2197-2214
Zhang Q, Zhang J, Song G and Di X 2007 Research on
atmospheric water-vapor distribution over qilianshan
mountains. Acta Meteorologica Sinica 65(4) 633-643
Zhang Y, Tian Q, Gou X, Chen F, Leavitt S W and Wang
Y 2015 Annual precipitation reconstruction since ad
775 based on tree rings from the qilian mountains,
northwestern china. International Journal of
Climatology 31(3) 371-381
IWEG 2018 - International Workshop on Environment and Geoscience
198
