
Analysis of Rainfall Runoff Pollution and Split-Flow on Urban
Pavement
Yongqiang Huang
*
, Cancan Liu and Wenliang Zhao
The School of Environmental and Safety Engineering, Jiangsu University, Zhenjiang, 212013, China.
Email:
yqhuang@ujs.edu.cn
Keywords: Rainfall runoff, water quality, rainfall utilization, initial split-flow
Abstract: The pollution situation and the variation characteristics of the water quality of rainfall runoff in urban area
were analyzed. Water quality monitoring results indicated that, during the early period of rainfall, the
maximum concentrations of suspended solid, chemical oxygen demand, ammonia nitrogen and total
phosphorus in the water on the urban pavement reached 410 mg/L, 282.4 mg/L, 11.18 mg/L and 1.2 mg/L,
respectively. This means that the initial rainfall runoff pollution is serious. Additionally, with the increase of
rainfall duration, the pollutant concentration gradually decreased and stabilized eventually. Finally, the
engineering simulation experiment of split-flow of the initial rainfall showed that the reduction rate of
chemical oxygen demand, total phosphorus, suspended solid, and ammonia nitrogen on the pavement
rainfall could reach 48.15%, 51.77%, 56.91% and 33.45% when the amount of initial rainfall split-flow was
3 mm. Based on the field observations and theoretical analyses, the initial rainfall discarding strategy is
recommended as a primary treatment of rainfall reuse system to improve water quality under different
rainfall patterns. These findings are vital for the rainfall utilization in the construction of Sponge City
Project.
1 INTRODUCTION
In recent years, the urban water logging and
drinking water pollution caused by emergencies
have occurred frequently. Rainfall could be used as
drinking water resource or alternate source in case of
sudden pollution. Some developed countries such as
Germany (Thilo and Uwe, 1999), the United States
and Japan (Wang et al., 2011) attach great
importance to the recycling of rainfall; they have
carried out the rainfall utilization project and
formulated a series of policies and regulations, and
also established a relatively perfect system of
rainfall utilization (Zhao and Niu, 2001). Compared
with the developed countries abroad, rainfall quality
in China is obviously poorer. It is due to the serious
air pollution and the scouring of the atmosphere in
the process of rainfall. And there are still many
deficiencies in China's rainfall resource utilization
and management system. Therefore, China has put
forward the construction of "sponge city".
Zhenjiang City has made certain achievements
on district transformation as well as waterfront park
construction based on the low impact development
concept (Wang et al., 2014). The population in
university is dense and the domestic water demand
of university is great. Therefore, the trial of rainfall
collection and utilization in universities can
effectively reduce the water pollution caused by
anti-emergencies. It can also make more effective
designs and modifications on the transformation of
the original conditions (Zhao, 2012). Based on the
new campus of Jiangsu University, this paper
analyzed the water quality characteristics of rainfall
runoff on pavement and carried out the engineering
simulation of split-flow. And this research provided
basic data and technical support for pavement
surface rainfall utilization.
170
Huang, Y., Liu, C. and Zhao, W.
Analysis of Rainfall Runoff Pollution and Split-Flow on Urban Pavement.
In Proceedings of the International Workshop on Environment and Geoscience (IWEG 2018), pages 170-175
ISBN: 978-989-758-342-1
Copyright © 2018 by SCITEPRESS – Science and Technology Publications, Lda. All rights reserved

Table 1: Campus rainfall and monitoring time.
number Monitoring date early sunny
days
(day)
Pavement runoff
time
Rainfall
duration
(min)
Rainfall
amount
(mm)
Rainfall
intensity
(mm/min)
1 2017.5.29 2 10:45 76 1 0.013
2 2017.6.16 1 14:23 155 11.7 0.075
3 2017.6.25 4 15:57 20 4 0.200
4 2017.7.6 3 8:56 390 6 0.015
5 2017.7.16 5 8:51 300 8 0.027
6 2017.8.7 12 16:20 60 1.5 0.025
7 2017.8.8 1 17:00 64 16.9 0.264
8 2017.8.20 1 18:59 42 2.8 0.067
9 2017.9.29 4 8:31 50 1.1 0.022
10 2017.11.12 5 11:21 >480 18.5 <0.039
2 MATERIAL AND METHODS
2.1 Sampling
A double-edged fine-toothed comb on the ground in
front of the library of Jiangsu University was taken
as a sample site to analyze 10 times of different
rainfall. When the rainfall on the road formed
runoff, we collected the runoff and started the
timing. We took some sample at regular intervals
and recorded time of each sample based on the
rainfall intensity. The initial sample interval of
runoff was short. With the increase of rainfall
duration, the sample interval gradually increased.
Table 1 shows the rainfall monitoring information.
2.2 Determination of Indicators
In general, the pollutants in rainfall are mainly
suspended matter, organic pollutants, nitrogen,
phosphorus and other nutrient elements. Thus
suspended solid (SS), chemical oxygen demand
(COD), ammonia nitrogen (NH
3
-N) and total
phosphorus (TP) were determined as the indicators
and analyzed.
SS is an important index for evaluating the
sensory properties and pollution of water body, and
SS concentration is determined by weighing method.
COD indicates the relative content of organic matter
in water, and is determined by dichromate oxidation
method. NH
3
-N is a nutrient in water and can cause
water eutrophication. It is the main oxygen
consumption pollutant in water. Concentration of
NH
3
-N is determined by nessler's reagent
colorimetric method. TP is the main factor of
eutrophication in water body to evaluate the degree
of water pollution. And TP concentration was
measured with ultraviolet-visible spectrophotometry
after potassium persulfate digestion at 121℃ for 30
min.
2.3 Experiment of Initial Split-Flow on
Pavement
Sansalone et al. (1997) proposed that the pollution
load of 20% of the initial rainfall runoff accounted
for 80% of the total rainfall in the study of road
runoff. In the research on initial split-flow on
pavement rainfall, He Junchao (2015) and others
pointed out that when the runoff ratio was about
30% to 40%, the corresponding proportion of
pollution load was about 42% to 70%. Chew (he et
al., 2004) and others found that under the conditions
of the rainfall intensity being 0.1 mm/min, the
pollution load in the initial 20 minutes accounted for
42% of the whole rainfall, and the pollution load in
later 20 minutes only accounted for 10%. It could be
seen that the pollutants in the runoff were mainly
concentrated in the initial runoff. Therefore, rainfall
in the early stage was supposed to be discarded, and
then the rainfall could be collected, stored, treated
and reused.
The main purpose of the initial discarding is: (1)
To avoid bringing a large amount of sediment into
the rainfall treatment structure, and to reduce the
difficulty of cleaning and maintenance at the later
stage; (2) To protect the rainfall storage and to
ensure that the rainfall quality in the later treatment
process is relatively stable; (3) To avoid collecting
and treating the rainfall which is in very small
amount with high pollution, and to protect storage
Analysis of Rainfall Runoff Pollution and Split-Flow on Urban Pavement
171
structures and subsequent treatment equipment (Liu
and Fu, 2004).
2.4 Initial Split-Flow Calculation
Because the initial rainfall split-flow is affected by
many factors such as the nature and size of the
catchment, the degree of pollution, the subsequent
treatment system and the balance of water flow,
there has not been a unified formula so far. This
paper determined the actual split-flow according to
the pollutant load needed to control.
Some scholars (Charbeneau and Barrett 1998; He,
2011) have found an exponential relationship
between pollutant concentration and cumulative
runoff in rainfall, and the following relations are
given:
hK
t
h
eCC
⋅−
=
0
(1)
Where C
t
is the concentration of contaminant in
runoff as runoff starts t minutes, mg/L. C
0
is the
pollutant concentration in rainfall as runoff forms,
mg/L. K
h
is the comprehensive scouring coefficient
with rainfall as the variable. And it is related to the
surface water quality, rainfall intensity and pollutant
trait, mm
-1
. h is the cumulative rainfall within t
minutes of runoff, mm.
dhCY
H
t
∫
=
0
0
(2)
dhCY
h
tc
∫
=
0
(3)
Where H is the total rainfall. C
0
is the
concentration of pollutants in the rainfall. As the
runoff starts for t minutes, the pollutant
concentration is C
t
. Y
c
is the pollution load of the
runoff of different rainfall. Y
0
is the total runoff
pollution load generated by rainfall.
HK
hK
H
t
h
t
c
h
h
e
e
dhC
dhC
Y
Y
L
⋅−
⋅−
−
−
===
∫
∫
1
1
0
0
0
(4)
Where L is the pollutant migration rate during the
runoff scouring process. It is also known as
pollution load rate.
3 RESULTS AND DISCUSSION
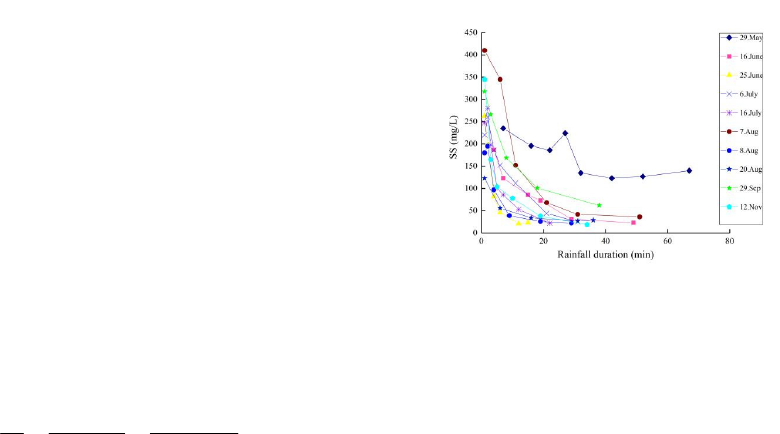
3.1 Variation of SS Concentration in
Rainfall Runoff on Pavement
Figure 1 shows the variation of SS concentration in
the pavement rainfall with the rainfall duration. The
concentration of SS decreased sharply in the early
stage of rainfall, and then decreased slower. After
20-30 minutes, the precipitation of SS was basically
below 30 mg/L, which met class VI surface water
standards (
GB3838-2002). As shown in Table 1,
the amount and intensity of rainfall were small and
the rainfall time was short on May 29. Hence, the
overall curve of SS concentration was high, and it
fluctuated. Comparing the two times of rainfall on
June 16 and June 25, we could find that the decline
trend of SS concentration curve on June 25 was
steeper than on June 16 in the first 5 minutes. With
the increase of rainfall duration, the stabilization
trend of SS concentration on June 25 was faster.
Therefore, the greater the intensity of rainfall was,
the stronger the effect of scouring and dilution to
contaminants was.
Figure 1: Pavement rainfall SS process along with the
change of rainfall duration.
3.2 Changes of Cod Concentration in
Rainfall Runoff on Pavement
Figure 2 shows the relationship between the rainfall
COD concentration and the rainfall duration. It
could be seen that the initial concentration of COD
in rainfall runoff was high. The concentration of
COD decreased significantly in initial 10 minutes.
Then the concentration of COD was basically below
20 mg/L after 20 minutes. In contrast of the number
of early sunny days before the two times of rainfall
on August 7 and August 20, it was found that the
IWEG 2018 - International Workshop on Environment and Geoscience
172
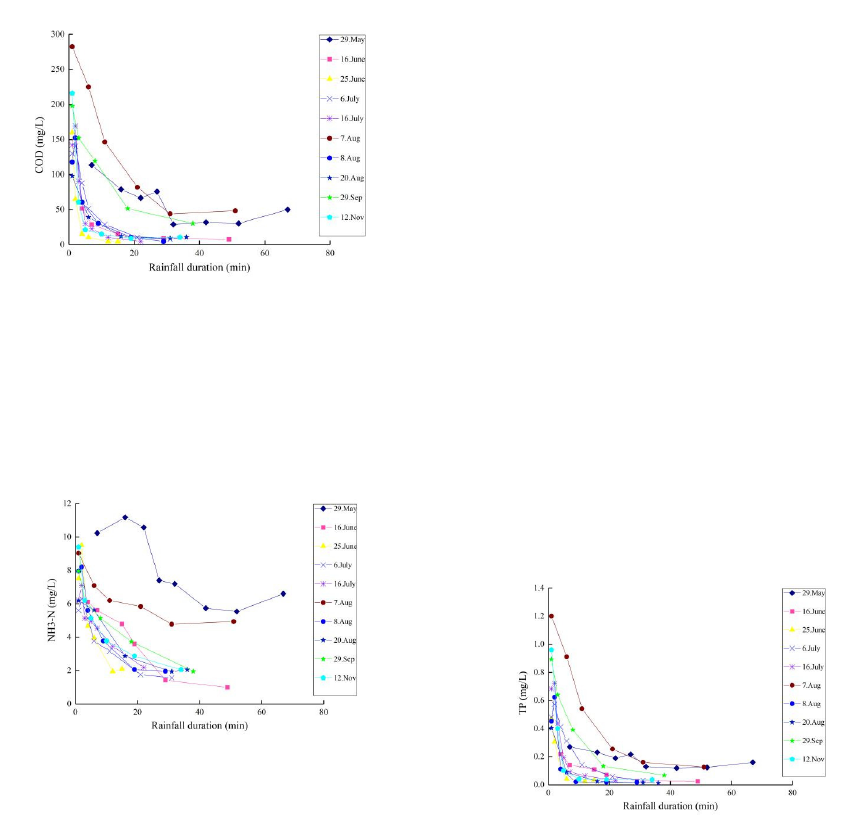
longer the interval between the two times of rainfall
was, the higher the concentrations of the initial
rainfall contaminants were. It indicated that the
pollutants would accumulate over time.
Figure 2: Pavement rainfall COD process along with the
change of rainfall duration.
3.3 Variation of Ammonia Nitrogen
Concentration in Rainfall Runoff
on Pavement
Figure 3: Pavement rainfall NH3-N process along with the
change of rainfall duration.
Figure 3 shows the relationship between rainfall
ammonia nitrogen concentration and rainfall
duration. It could be seen that there was a significant
downward trend of ammonia nitrogen concentration
in runoff at the beginning, and then the ammonia
concentration tended to be stable. Similarly, when
the rainfall duration was short, and rainfall intensity
was very small, the road surface runoff ammonia
nitrogen concentration curve was high. In addition,
the descending rate of early ammonia nitrogen
concentration was very fast, then the descending rate
gradually slowed down, and finally it tended to be
stable.
3.4 Variation of TP Concentration in
Rainfall Runoff on Pavement
Figure 4 shows the relationship between the rainfall
TP concentration on the pavement and the duration
of the rainfall. It could be seen that the concentration
of TP in rainfall runoff dropped sharply in 0-10
minutes. Then the curve tended to be gentle after 20
minutes. Compared with the curve of August 8, the
curve of August 7 was significantly higher. It was
because the interval was 12 days. Additionally, the
temperature of summer was high and there was no
staff pouring the road. So when it began to rain on
August 7, the TP concentration of initial rainfall
runoff was up to 1.2 mg/L. With the process of the
rainfall, TP concentration gradually decreased, but it
was still higher than the concentration in other
rainfall. It was because the rainfall intensity on that
day was very small. Furthermore, the TP
concentration on August 8 significantly decreased
after the scouring. Thus, the initial concentration of
rainfall runoff pollutants was low, and the
concentration of pollutants during the final
stabilization process was also low. Above all, the
time required to stabilize was short.
Figure 4: Pavement rainfall TP process along with the
change of rainfall duration.
3.5 Determination of Split-Flow in
Rainfall Runoff
The initial scouring of COD and SS of pollutants in
rainfall runoff was the strongest, which indicated
that the pollution load transferred by the initial
runoff was the largest. Thus, the migration rate of
COD and SS were used to determine the split-flow.
Analysis of Rainfall Runoff Pollution and Split-Flow on Urban Pavement
173
As shown in Figure 5, the COD and SS
concentrations in the initial runoff were high on
June 16, 2017. With the accumulation of rainfall, the
COD and SS concentrations gradually decreased.
Figure 5: COD, SS scour curve of road runoff.
The curve-fitting expressions of COD and SS
were y = 171.23e
-0.2789x
and y = 479.57e
-0.2817x
,
respectively, and they were consistent with the
general relationship between the change of
pollutants and the cumulative rainfall shown in
equation (1). The correlation coefficient R
2
of the
measured curve and the fitting curve that reflected
the variation of COD
cr
concentration during the
rainfall was 0.8418, and the correlation coefficient
R
2
concerning the variation of SS during the rainfall
was 0.9645. And the fitting degree was good, which
indicated that the main pollutants in the road rainfall
runoff and the cumulative rainfall were
exponentially related.
According to equation (4), the pollutant loading
rate of COD and SS were calculated, and the
pollutant loading rate L was expressed by the
arithmetic mean of them. Table 2 lists the
relationship between the loading rate of main
pollutants and the rainfall amount.
Table 2: Relationship between main pollutant loading rate
of road runoff and rainfall.
Rainfall
amount (mm)
1 2 3 4 5 6 7 8 9 10
Road pollutant
loading rate
(
%
)
25.4 44.6 59.1 70.1 78.3 84.6 89.3 92.9 95.6 97.6
It could be seen from Table 2 that the pollution
load rate in the initial runoff flow with the amount
of 1 mm is 25.40%. With the accumulation of
rainfall, the pollution load rate gradually increases,
but the increasing rate decreases. When the amount
of the rainfall reaches 3 mm, the pollutant loading
rate is about 60%. Therefore, when the initial
rainfall is discarded, the pollutant loading rate is
about 60%.
Some studies have pointed out that the pollutants
in pavement runoff are strongly affected by the
previous number of sunny days (Li et al., 2008). It
could be seen from Table 1 that the rainfall on June
16 was only one day from the last rainfall, indicating
that the accumulation of pollutants was relatively
slow. In addition, the proportion of contaminants in
the initial runoff was large (Ding et al., 2011).
Hence in the demonstration area, if the amount of
the initial split-flow on pavement surface is 3 mm,
this scheme could remove more than 60% of the
pollutant load in the same rainfall intensity, which
met the requirement of Zhenjiang Sponge City
Construction Project. It could also alleviate the
burden on subsequent rainfall treatment facilities. In
summary, the amount of initial split-flow at the
demonstration site has been designed to be 3 mm.
3.6 Simulation of Initial Discarding
Engineering
The object of the simulation was selected at a
rainfall outlet on the ground in front of the library of
Jiangsu University. And two times of rainfall on
January 3 and January 4 were discarded. The rainfall
runoff area was about 400 m
2
, and the split-flow
volume was designed to be about 1.2 m
3
.
Table 3. Changes of water quality in the engineering
simulation test of initial rainfall discarding.
Date Water
Sample
COD
(mg/L)
NH
3
-N
(mg/L)
TP
(mg/L)
SS
(mg/L)
2018.1.3
Sample 1 51.51 5.614 0.109 86
Sample 2
39.39 3.736 0.054 46
2018.1.4
Sample 3
81.82 5.842 0.141 123
Sample 4
42.42 4.788 0.068 53
In this experiment, the runoff rainfall flowing
through the rainfall port was collected into the split-
flow vessel by laying a tarpaulin at the selected
rainfall port, and the rainfall characteristics were
recorded synchronously within a rainfall tank. The
pavement was made of impervious material like
asphalt and tiles. Therefore, once runoff formed on
the road surface, the runoff could be replaced by the
rainfall. After the formation of the runoff, and the
amount of rainfall recorded within the rain barrel
IWEG 2018 - International Workshop on Environment and Geoscience
174

reached 3 mm, it was deemed that the amount of the
runoff reached 3 mm which was the amount of
preset split-flow. Then we closed the inlet of the
container and marked the road surface rainfall with
chlorine bottles as the water sample 2. The initial
split-flow in water containers was marked as the
water sample 1. Table 3 shows the pollutant
concentrations of two water samples.
According to the calculated formula of the pollutant
reduction rate:
100(%).Re
0
0
×
−
=
C
CC
rateduction
e
(5)
The results show that the reduction rates of COD
in the initial rainfall runoff could reach 23.53% and
48.15%, the reduction rates of TP in the initial
rainfall runoff could reach 50.46% and 51.77%, the
reduction rates of SS in the initial rainfall runoff are
46.51% and 56.91%, and the reduction rates of NH
3
-
N in the initial rainfall runoff could reach 33.45%
and 18.04% when the amount of split-flow are 3
mm. Therefore, it is an economical alternative to use
the initial disposal as a primary treatment method
for road rainfall reuse system.
4 CONCLUSIONS
(1) The initial runoff pollution was serious, and
the highest concentrations of SS, COD, NH
3
-N and
TP in the initial runoff were 410 mg/L, 282.4 mg/L,
11.18 mg/L and 1.2 mg/L. With the increase of
rainfall duration, the concentrations of pollutants
gradually reduced, and finally stabilized. In addition,
the decreasing trend of the concentrations of SS,
COD, NH
3
-N and TP were related to the number of
sunny days, rainfall and rainfall intensity.
(2) According to the pollution load rate
calculation, when the initial rainfall split-flow was
designed to be 3 mm, more than 60% of the
pollutant load on rainfall road runoff could be
removed, which was the goal of Sponge City
Construction in China.
(3) Aiming at the engineering simulation of the
university, the results of the engineering simulation
on pavement showed that the reduction rates of
COD, TP, SS, NH
3
-N on the pavement rainfall could
reach 48.15%, 51.77%, 56.91% and 33.45% when
the amount of initial split-flow was 3 mm. It
indicated that the initial rainfall disposal could be
used as primary treatment of pavement rainfall reuse
system in rainfall utilization.
REFERENCES
Charbeneau R.J., Barrett M.E. 1998 Evaluation of
Methods for Estimating Stormwater Pollutant Loads
Water Environment Research 70(7) 1295-1302
Che Wu, Liu Yan, Ou Lan, et al 2004 Urban rainfall
runoff pollution load calculation model China Water &
Wastewater 20(7) 56-58
Ding Lunkun, Xie Wei, Sun Wenhai 2011 Study on Water
Quality and Initial Abandoned Rainfall of Roof rainfall
Harvesting China Rural Water and Hydropower 01
85-88
GB3838-2002 S. Surface water environment quality
standards
He Junchao, Xu Ping, Zhang Yajun, Zhang Jian qiang
2015 Analysis on Initial Scouring Effect and Initial
Disposal Rate of Road Rainfall Runoff in Shenzhen
City Municipal Engineering Technology 04 81-86
He Liu 2011 Scouring Regularity and Initial Effect
Analysis of Simulated Surface Pollutants by Artificial
Rainfall Wuhan University Of Technology
Li He, Zhang Xue, Gao Haiying, Fu Dafang 2008
Analysis on Characteristics of rainfall Runoff Pollution
on Expressway Pavement China Environmental
Science 11 1037-1041
Liu Peng, Fu Wenhua 2004 Thoughts on whether the
initial rainfall should be abandoned Water Supply and
Drainage 30(12) 78-79
Sansalone J J, Buchberger S G 1997 Partitioning and first
flush of metals in urban roadway storm water Journal
of Environmental Engineering 123(2) 134-143
Thilo Herrmann, Uwe Schmida 1999 rainfall utilisation in
Germany: efciency, dimensioning, hydraulic and
environmental aspects Urban Water 1 307-316
Wang Haifeng, Fan Zhuowei, Luo Lin, Zhang Wang 2014
The enlightenment of Foreign financial support policy
on urban rainfall to our country Water Resources
Development Research 04 12-15
Wang J, Che W, Li J, et al 2011 Green building on the
basis of low impact development theory and practices:
2011 International Conference on Electric Technology
and Civil Engineering. IEEE Computer Society.
ICETCE 2011, April 22, 2011 - April 24, 2011,
Lushan, China
Zhao Jiang 2012 The exploration of urban water logging
prevention under the background of Sponge city
construction -- Taking an example of zhenjiang[J]
Study on Comprehensive Utilization of rainfall
Ecology in New Campus of University
D. Tianjin
University.
Zhao Tinghong, Niu Zhengming 2001 The basic way of
the realization of urban rainfall utilization China
Water & Wastewater 10 56-58
Analysis of Rainfall Runoff Pollution and Split-Flow on Urban Pavement
175
