
Ecology, Economy and Energy Evaluation of Electricity Generating
Technologies Using 3E Indicator
Vojin Grković
University of Novi Sad, Faculty of Technical Sciences; Steinbeis Energy Technologies, Bulevar Despota Stefana 16, 21000
Novi Sad, Serbia
Email: vojingr@uns.ac.rs
Keywords: 3E indicator, energy technologies, carbon-free, electricity generation
Abstract: The paper presents the results of technology option research on the paths towards the carbon free electricity
generation. To that end three different technology mixes are considered. Each mix comprises i-RES and
nuclear thermal power plants technologies, plus a combination of existing and advanced hard coal and
lignite fired technologies with and without CCS. In order to enable quantitative measurements of the
considered technology mixes, 3E Indicator is introduced. The principal application of the Indicator is
described by appropriate model calculations for the general European conditions. The results show that the
introduced 3E Indicator is suitable for analysis of the technological combinations for electricity generation
within considered country. The analysis is exemplified by the estimation of 3E indicator for the installed
capacities and electricity generated in the group of five European countries. The results show that the
country with the highest participation of NPPs and/or HPPs and low participation of i-RES in electricity
generation has the best i. e. the lowest value of 3E Indicator. On the other hand the country with the highest
participation of i-RES and low to moderate participation of NPPs and/or HPPs has the conceivably highest
value of 3E Indicator.
1 INTRODUCTION
Reduction of CO
2
emissions from energy plants,
industry and traffic and thus unloading the
environment of CO
2
content, nowadays become the
social request of the highest order to which the
design and operation of power plants and overall
energy systems must be dedicated. First and the
most promising approach is to build plants that
generate electricity with no CO
2
emissions or at least
with the smallest possible emissions. As the
response on the request tens thousands of renewable
energy sources (RES) like photovoltaic and wind
electricity sources were built in the world. However
these sources can operate only when the weather
allows it, and thus they belong to the intermittent
ones.
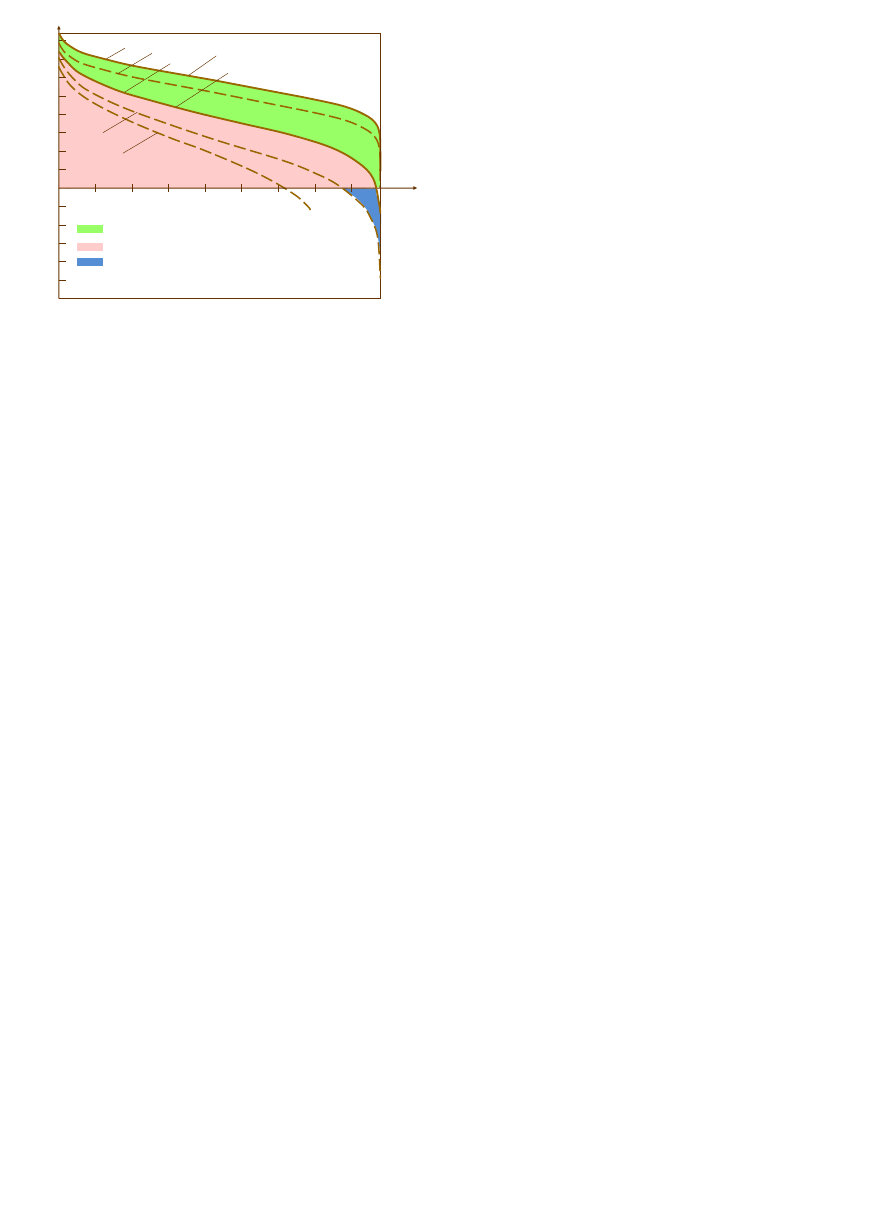
In an electric energy system with intermittent
renewable energy sources (i-RES) overall annual
energy consumption demand is distributed on certain
electricity generating plants in two ways. The RES
with variable load (photovoltaic and wind
generators) have priority in electricity in-feed, and
therefore they produce as much electricity as they
can. The electricity generated by i-RES (indicated
by green surface in Figure 1) is subtracted from the
total energy needed which is defined by the annual
load duration curve of the referent system. The
remaining residual load (indicated by pink surface in
Figure 1), which is characterized with corresponding
residual load duration curve, is distributed on the
power plants in the system in accordance to merit
order principle. The greater percentage of annual
RES-e in-feeds (denoted by indicator λ in Figure 1)
results in lower residual load available for coverage
by despatchable plants like thermal power plants
(conventional fossil fuelled and nuclear power
plants) and hydro power plants.
In the case of very great amount of electricity
produced by i-RES, residual load can become even
negative (indicated by blue surface in Figure 1).
Negative residual load means that there is surplus of
electricity generated by i-RES even if all
despatchable sources i.e. thermal power plants are
switched off.
Conditions established by high percentage of i-
RES in-feed in the electric energy system become
much more sever for operation of despatchable
Grkovi
´
c, V.
Ecology, Economy and Energy Evaluation of Electricity Generating Technologies Using 3E Indicator.
In Proceedings of the International Workshop on Environment and Geoscience (IWEG 2018), pages 139-144
ISBN: 978-989-758-342-1
Copyright © 2018 by SCITEPRESS – Science and Technology Publications, Lda. All rights reserved
139
plants compared to the conditions without or with
small generation of i-RES electricity.
Smaller residual lad means smaller needs for
electricity generated by despatchable plants i.e.
smaller market for these plants with end effect
manifested in their smaller annual electricity
generation. As a consequence fixed costs per unit of
electricity generated become greater, or
alternatively, if the selling price of the electricity
remains unchanged the plants income become
considerably smaller. In both cases there is
significant economic impact.
Variable (intermittent) character of photovoltaic
and wind electricity generation conditions great
speed of load change of the plants operating in
residual load domain. According to a rough estimate
for the European occasions, the speed of power
change from 20 MW / min to 70 MW / min, on
average for several tens of hours, can be expected in
due time. Beside great speeds of load changes, these
plants more frequently have to change load, as well
as to shut down and start up, than it is case in the
systems with smaller participation of i-RES. The
interval of load increase/decrease is also great,
resulting in smaller value of the plants average
annual load. Further, the plants are pressed to
operate at low loads that are significant lower than
earlier so called minimal loads of the thermal power
plants. All these issues condition faster ageing of
thermal power plants, compared to the situation with
small i-RES in-feeds.
Intermittent RES energy technologies used in the
modern electricity generating systems are: wind
generators – on shore (smaller air velocities) and
off-shore (greater air velocities), and photovoltaic
generators – on roof and on the soil.
The bulk of the residual load is mostly covered
by thermal energy plants technologies as follows:
• Coal (hard coal or lignite) fired power plants
based on existing or advanced technology
(CFPP).
• Nuclear power plants (NPPs).
• Natural gas fired open cycle gas turbines
(OCGT) and combined cycle gas turbines
(CCGT).
Out of these three technologies, only nuclear
power plants operate without any CO
2
emission,
while others operate with certain CO
2
emissions.
There are two technology options for emission
reduction of fossil fuelled power plants. First is
improving thermodynamic cycle efficiency. In the
case of steam plants advanced steam conditions level
of 37.5MPa/700
0
C/720
0
C can enable the increase of
plants efficiency of 3 percent points in the case of
lignite combustion and 4 to 6 % percent points with
hard coal combustion (Fürsch et al., 2012). In the
case of OCGT efficiency of about 40% and in the
case of CCGT efficiency of about 60% can be
obtained, while the turbine inlet temperatures TIT of
the level of about 1500
0
C is achievable (Bareiß et
al., 2010). Second option is combining carbon
capture and storage (CCS) technologies with either
existing or advanced fossil fuelled thermal power
plants. Development of CCS technologies has
moved far away (Fouquet and Nysten, 2012; Kosel
and Und, 2010). Advanced steam turbine/boiler
technologies, as well as the CCS technologies are
expected to be commercially available after 2020.
For utilizing electricity surplus in the domain of
negative residual load corresponding capacities of
pump storage hydro power plants (PSHPP), and/or
compressed air storage (CAS) power plants and/or
appropriate batteries are needed. However, the cost
of electricity produced by these plants is high due to
additional investments needed, as well due to
unavoidable losses in the processes of energy
conversion.
2 3E INDICATOR
Key process indicators are necessary for assessing
environmental goodness and process effectiveness of
industry’s operation or business performance, as
well as of the design of the technology system. In
the field of energy and CO
2
emissions are in use:
Carbon intensity, the KAYA identity and IPAT
indicator. Carbon intensity is defined as the emission
-10
0
10
20
40
1000 2000
3000
4000 5000
6000
7000
8000 h/a
30
-20
-30
-40
-50
-60
50
60
70
80
GW
λ
0
8760
Annual load covered by variable RES
Residual load covered by dispetchablel power plants
Negative residual load
λ
1
λ
2
λ
3
λ
4
Share of i-RES electricity λ
1
< λ
2
< λ
3
< λ
4
Annual load duration curve
Residual load duration curve
Figure 1: Annual load and residual load duration curves,
according (Steffen and Weber, 2013; Wissel et al., 2008).
IWEG 2018 - International Workshop on Environment and Geoscience
140

rate of a carbon relative to the energy imputed in the
process (https://definedterm.com) and can be applied
at the technology level, as well as on the companies
or countries level. The other two are designed to
assess general patterns of the relations among
population, energy intensity, GDP and carbon
intensity (KAYA) (http://www.tsp-data-
portal.org/TOP-20-Generation#tspQvChart), as well
as population, affluence and technology (IPAT)
(https://en.wikipedia.org/wiki/Kaya_identity) at the
state level. These factors are not enough sensitive on
the changes in the design of electro energy systems
and selection of different technology mixes that is
aimed to satisfy the needs in energy produced and
carbon intensity with as low as possible investments.
Owners and designers of electricity generating
systems need to have the indicator that will help in
decision making for the new improvement of the
system’s patterns, as well as the related investments.
In designing an electric energy system the main
targets are assumed to be: CO
2
emission as low as
possible, electricity generation enough high to
satisfy the needs and investments in the system as
low as possible. Numerical values of the targets can
be combined into one indicator, 3E indicator, which
can be expressed in mathematical form by the
equation:
∑
∑∑
=
==
⋅
=
n
i
ESi
n
i
ESiCO
n
i
cESi
e
mf
E
1
1
2
1
3
(1)
In above equation f
cESi
denotes annual amount of
fixed cost (expressed in millions euro per year) for i-
th electricity source, m
CO2ESi
denotes annual amount
of CO
2
emission (in thousand tons per year) of i-th
electricity source, e
ESi
electricity generation (in
MWh per year) of i-th source, while n denotes the
number of electricity sources comprising all steam
turbine generators, gas turbine generators, wind
turbine generators, hydro turbine generators and PV
and other solar electricity sources. By introducing
obvious changes we obtain following equation:
E
MF
E
COc 2
3
⋅
= (2)
Where F
c
denotes total annual amount of fixed
cost (expressed in millions euro per year) of all
electricity sources, M
CO2
denotes total annual
amount of CO
2
emission (in thousand tons per year)
of all electricity sources and E denotes total
electricity generation (in MWh per year) of all
electric sources. The electricity generating system is
as better as is lower value of 3E indicator. The
condition for improving the electricity generating
system with new designs and/or new technologies is
resulting decrease of the value of 3E indicator. In
mathematical form it can be expressed as:
()
03 〈Δ E
(3)
Above inequality can be developed as:
E
E
M
M
F
F
CO
CO
c
c
Δ
〈
Δ
+
Δ
2
2
(4)
Above inequality can be analysed for two cases.
First is when investments are going to be spent only
for reduction of CO
2
emissions. In that case the
increase of electricity generation equals zero, so we
obtain the condition in the form:
2
2
CO
CO
c
c
M
M
F
F Δ
〈−
Δ
(5)
This means that relative increase in investments
must be smaller than relative decrease in CO
2
emission.
Second case is the general case where the
investments are spent on increase of electricity
generation and on decrease of CO
2
emission.
2
2
CO
COc
M
M
E
E
F
F Δ
−
Δ
〈
Δ
(6)
The relative increase in investments must be
smaller than the difference of relative increase of
electricity generation and relative decrease in CO
2
emission.
Advantage of the 3E indicator as defined by the
equation (1) is its adequacy in comprising main
influenced values, as well as its simplicity.
3 APPLICATION OF 3E
INDICATOR
Above explained 3E indicator is used to analyse
possible technology paths toward carbon free
electricity production at the state level. For that,
three cases of different technology mixes are
selected. Each case is simplified and reduced on two
technologies in base part of residual load; one
technology in intermediate part and one in pick part
of the residual load, as mentioned below.
Existing technology, lignite fired power plants
and NPPs for basic part of the residual load, hard
coal fired power plants for intermediate part of the
residual load and gas fired CCGT power plants for
the pick part of the residual load. No CCS
technology is foreseen.
Ecology, Economy and Energy Evaluation of Electricity Generating Technologies Using 3E Indicator
141
Existing technology lignite fired power plants
and NPPs for basic part of the residual load,
advanced technology hard coal fired power plants
for intermediate part of the residual load and gas
fired CCGT power plants for the pick part of the
residual load. No CCS technology is foreseen.
Existing technology lignite fired power plants
and NPPs for basic part of the residual load,
advanced technology hard coal fired power plants
with CCS technology for intermediate part of the
residual load and gas fired CCGT power plant for
the pick part of the residual load.
For the parametric analysis are selected
following independent variables: the participation of
i-RES in total amount of electricity generation
expressed by indicator λ (kWh/kWh
tot
) and the
participation of NPPs in residual load expressed by
indicator α (kWh/kWh
res
). The analysis is performed
numerically. The simplifications in defining
technology mixes are introduced in order to present
the approach clearer without harming its exactness
and generality.
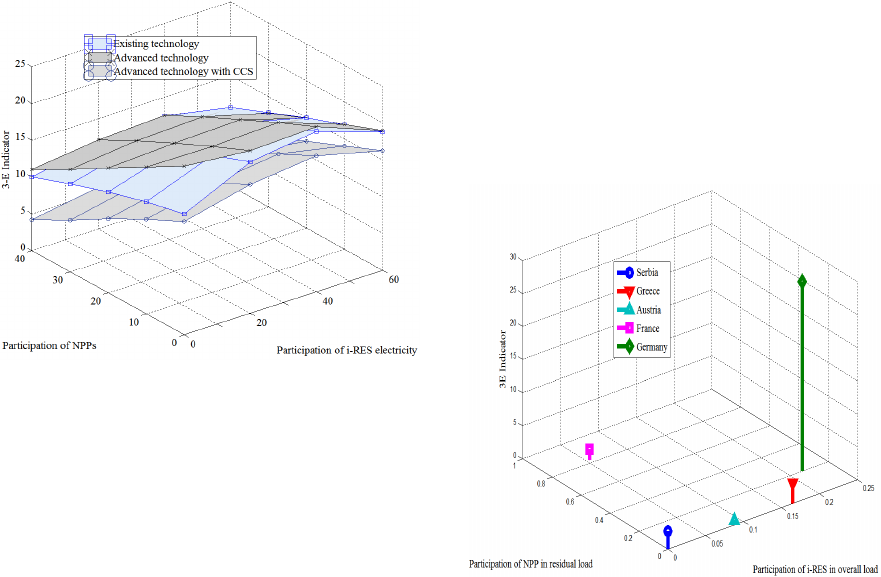
Figure 2: Graphical presentation of 3E Indicator as
function of participation of i-RSE in total electricity
generation, and NPPs in residual load generation.
The analyses are performed using analytical
model described in (Grković, 2015) with necessary
adoptions for the case. Basic data for the
technologies considered in the analysis are also
taken from reference (Grković, 2015). A more or
less typical central European electric energy system
is selected as the referent one and the load duration
curves from Figure 1 are assumed as valid.
In Figure 2 are presented calculated values of 3E
indicator for considered three mixes of electricity
generating technologies. From the figure it follows
that an increased share of electricity generated by
NPPs in residual load domain, starting from zero
value, enables decrease of 3E indicator, and thus
improvement the electricity generating system
regarding the complex of investments, CO
2
emissions and electricity generated. On the other
hand, increased share of electricity generated by
RES in total load domain, starting from zero value,
causes increase of 3E indicator, and thus
deterioration the electricity generating system,
regarding complex of investments, CO
2
emissions
and electricity generated.
Above relations are qualitatively very similar for
all three considered electricity generating technology
mixes. The amount of improvement obtained by
increased participation of NPPs, which corresponds
to the slope of the surface in the direction (see
Figure 2) has the lowest value in the case of existing
technology, while advanced technology with CCS
causes the biggest gradients. In all three cases the
best values of the 3E indicator are obtained with the
highest considered value of 40% for nuclear
electricity in residual load domain and 0% of
variable RES. In our case the maximal value of the
3E indicator is obtained at RES participation of 40%
and zero percent of nuclear participation. Generally,
introduction of advanced technologies with CCS in
the intermediate part of the residual load enable the
best values of the 3E indicator, while the advanced
technologies without CCS are giving the highest
values of the 3E indicator.
Figure 3: Graphical presentation of estimated values of 3E
Indicator for selected countries.
Figure 3 shows calculated values of 3E Indicator
as function of participation of i-RES electricity in
overall electricity generation domain, and NPPs
electricity in residual load domain for the group of
IWEG 2018 - International Workshop on Environment and Geoscience
142
selected European countries. For the purpose of this
analysis in the data for the biomass are considered
those related to investments and electricity
generated, but not related CO
2
emissions, since the
biomass is assumed as CO
2
neutral. The average
values of CO
2
generation per unit of energy for
different fuels are accepted according to (Kather,
2011), what is the same approach as in calculations
of previous diagram. All assets are assumed as new
one, i.e. no repayments of the investments are
considered since there was lack of available data.
Costs of the assets correspond to prices in 2016,
according to (U.S. Energy Information
Administration 2016; Breeze, 2010). In the case that
partially write-off of the asset is included in
assessment of 3E indicator, its numerical value will
be lower. Data on electricity generating capacities,
as well as the generated electricity in considered
countries are taken from references
(https://transparency.entsoe.eu;
http://www.iea.org/statistics/statisticssearch/;
https://www.energy-charts.de/power;
https://www.energy-charts.de/energy). The data are
valid for the year 2015. The meaningful differences
in the numerical values of 3E Indicator among
considered countries can be recognized in Figure 3.
This fact confirms previously introduced hypothesis
that 3E Indicator has enough high sensitivity on the
actual data in different countries, and thus is
applicable for comparison of the actual situation in
them, as well.
Much bigger value of 3E Indicator for Germany
can be understood as that there is a big amount of
electricity generating capacities, that cost a lot and
that this fact has stronger impact on the 3E indicator
than achieved CO
2
emissions. It looks as an
“overinvestment” in the assets that operate
producing energy in average of small number of
hours per year. According to our calculation it is
slightly under 3000 hours of work in full capacity
per year. In contrary, small level of 3E Indicator for
France points out that high participation of NPPs in
residual load domain of about 80% enable better
effect in CO
2
emissions with smaller amount of
investments, resulting in longer average operation
hours per year of the installed capacities. According
to our calculation it amounts about 4450 hours of
work in full capacity peer year. The other three
countries do not have any NPP. However, the values
of their 3E indicators are comparably good due to
considerable amount of carbon free electricity
generated by hydro power plants and i-RES. In
Serbia about 28 percent of overall electricity
generation comes from hydropower plants, in
Austria such generation exceeds 63% percent, while
in Greece carbon-free electricity amounts slightly
over 40%. In these countries calculated average
hours of work in full capacity peer year amount
4330, 3100 and 2944, respectively.
4 CONCLUSIONS
The paper presents the results of technology options
research on the paths towards the carbon free
electricity generation. For that three different
technology mixes are considered. Each mix
comprises i-RES and nuclear thermal power plants
technologies as carbon free technologies, lignite
fired technology in the base part, and CCGT
technology which is aimed for pick part of the
annual electricity load diagram. In addition first mix
has existing hard coal fired technology without CCS,
second mix in addition has advanced hard coal fired
technology without CCS, while the third one has in
addition advanced hard coal fired technology with
CCS.
In order to enable quantitative measurements of
the considered technology mixes, 3E Indicator is
introduced. The Indicator comprises annual part of
the investments in all electricity plants of the
respected mix, annual amount of CO
2
emitted, as
well as the annual amount of electricity generated.
The principal application of the concept is described
by appropriate model calculations for the general
European conditions.
The results show that introduced 3E Indicator is
sensitive on the types of technologies from which
each mix is composed, as well as on the
participation of carbon free technologies in overall
electricity generation. This characteristic makes 3E
Indicator suitable for analysis of the technological
solutions within considered electricity generating
system, and/or the country regarding investments in
asset, CO
2
emissions and energy produced.
The analysis is exemplified by estimation of 3E
indicator for the installed capacities and electricity
generated in 2015 in the group of five European
countries. The results show that the country with
highest participation of NPPs and/or hydro power
plants, and low participation of i-RES in electricity
generation has the best i. e. the lowest value of 3E
Indicator. On the other hand the country with highest
participation of i-RES and low to moderate
participation of NPPs and/or HPPs has the
conceivably highest value of 3E Indicator. Two of
the rest three countries have good values of 3E
indicator due to high participation of hydro power in
Ecology, Economy and Energy Evaluation of Electricity Generating Technologies Using 3E Indicator
143

the technology mix, while third country has a
combination of i-RES and hydropower.
Above results in principal can point out the path
toward carbon free electricity generation. However,
more detailed research is needed for drawing out the
final and more detailed conclusions.
REFERENCES
Bareiß J, Helmrich A and Bantle M 2010 Materials
Specification VGB-R 109 and Processing Standards –
First Experiences of a New Power Plant for Quality
Control Purposes VGB PowerTech Nr. 7, Z. 51-55
Breeze P 2010 The Cost of power Generation Business
Insight
Capital Costs Estimates for Utility Scale Electricity
Generating Plants, U.S. Energy Information
Administration, November 2016
Fouquet D and Nysten J 2012 The Role of Renewable
Energy in the Changing Energy Landscape in Europe –
Some Reflections VGB PowerTech, Nr. 1/2, Z. 38-42.
Fürsch M, Nagl S and Lindenberger D 2012 Optimization
of power plant investments under uncertain renewable
energy development paths –A multistage stochastic
programming approach EWI Working Paper No. 12/08,
May
Grković V 2015 Marginal share of renewable energy
sources of variable electricity generation – a
contribution to the concept definition Thermal Science
2 383-396
http://www.iea.org/statistics/statisticssearch/ (accessed:
7.1.2018.)
http://www.tsp-data-portal.org/TOP-20-
Generation#tspQvChart (accessed: 7.1.2018.)
https://definedterm.com(accessed: 7.1.2018.)
https://en.wikipedia.org/wiki/Kaya_identity (accessed:
7.1.2018.)
https://transparency.entsoe.eu(accessed: 7.1.2018.)
https://www.energy-charts.de/energy (accessed:
7.1.2018.)
https://www.energy-charts.de/power (accessed: 7.1.2018.)
Kather A 2011 Zukünftige klimafreundliche
Stromversorgung mit fossil befeurten Kraftwerken“,
VGB PowerTech 9, Z. 44-53
Kosel D, Und Meyer H 2010 Requirements for Cleaning
of the Flue Gas in Oxyfuel-Process (in German
language), Anforderungen an die Rauchgasreinigung
im Oxyfuel-Prozess. VGBPowerTech 4 56-58
Steffen B and Weber C 2013 Efficient Storage Capacity in
Power Systems with Thermal and Renewable
Generation Energy Economics 36 556-67
Wissel S, Ruth-Nagel S, Blesl M, Fahl U, Voß A 2008
Electricity Production Cost in Comparison, (in German
language) Stromerzeugungskosten im Vergleich.
Universität Stuttgart, Institut für Energiewirtschaft und
Rationale Energieanwendung, Bericht Nr. 4..
www.ier.uni-stuttgart.de/.../Arbeitsbericht_04.pdf
(05.06.2013).
IWEG 2018 - International Workshop on Environment and Geoscience
144
