
Spatiotemporal Changes of Nutrients and Eutrophication in a Semi-
Enclosed Bay, Southeast China
Qingsheng Li, Cui Wang, Jinlong Jiang and Siting Chen
*
Third Institute of Oceanography, State Oceanic Administration, Xiamen, Fujian, 361005, China.
Email: chensiting@tio.org.cn.
Keywords
: Nutrients, eutrophication, spatiotemporal changes, semi-enclosed bay, Southeast China
Abstract: According to the data of water quality monitoring in Xiamen Bay in May and October 2010, we analysed
the spatiotemporal variation trend of nutrients and eutrophication, discussed the main potential sources. The
results show that Western Sea, Jiulong River Estuary and Tongan Bay were the high value areas for
chemical oxygen demand (COD), dissolved inorganic nitrogen (DIN) and active phosphate (PO
4
-P). The
eutrophication level decreased from Western Sea and Jiulong Estuary to Southeast Sea and Dadeng Sea.
The eutrophication in May was lower than that in October. The proportion of ammonia nitrogen was higher
in Western Sea and Tongan Bay, while in the Jiulong Estuary, Southeast Sea and Dadeng Seas, the
proportion of nitrate nitrogen was higher. Poor hydrodynamic forces, land-based pollution and short-term
strong rainfall might contribute to eutrophication. Correlation analysis showed that the main sources of
pollution were land-based sources. The origins of COD, NO
2
-N and NH
3
-N were similar. Changes in DO
might be related to the N/P ratio. The research results could provide technical support for marine
environmental protection in Xiamen Bay.
1 INTRODUCTION
Eutrophication is caused by structural changes and
functional degradation of the original ecosystem due
to the increase of nutrients in the ocean (
Capriulo et
al., 2002
). With the development of economy and
population increase in coastal areas, more and more
industrial wastewater and domestic sewage are
discharged into coastal waters, resulting in the
increase of nutrient content and eutrophication,
which can induce red tide and other ecological
disasters (Zhang et al., 2007;Zhang et al., 2009),
causing disastrous consequences for coastal marine
ecosystems. To grasp the content, distribution of
nutrients and eutrophication in coastal waters is very
important for marine environment protection.
In the 1980s, Chinese scholars have begun to
study the problem of eutrophication in the gulf (
Zou
et al., 1983). The eutrophication research has focused
on eutrophication assessment and trends (
Guo et al.,
1998; Lin and Zhang, 2008; Yuan et al., 2016). However,
few studies analyzed the causes of eutrophication
from the perspective o the relationship between
water quality parameters.
Xiamen Bay (XMB) is a semi-enclosed bay
located in Southeast China. With the rapid economic
development around Xiamen Bay, a large number of
nutrients discharge from the sewage outfall and
rivers into the sea. Aquaculture in XMB also
produces some nutrients. Many sources of pollution,
high-nutrient water bodies, and poor water exchange
conditions make eutrophication of XMB very
serious (
Lin and Zhang, 2008), which can adversely
affect marine ecosystem. Therefore, it is very
important to control the water pollution and protect
the environment of XMB. Based on the water
monitoring data of XMB in May and October 2010
(the latest and comprehensive data we can obtain),
this study discussed the spatiotemporal trend and
cause of nutrients and eutrophication in order to
provide technical support for the ecological
protection and restoration in XMB.
120
Li, Q., Wang, C., Jiang, J. and Chen, S.
Spatiotemporal Changes of Nutrients and Eutrophication in a Semi-Enclosed Bay, Southeast China.
In Proceedings of the International Workshop on Environment and Geoscience (IWEG 2018), pages 120-125
ISBN: 978-989-758-342-1
Copyright © 2018 by SCITEPRESS – Science and Technology Publications, Lda. All rights reserved
2 MATERIALS AND METHODS
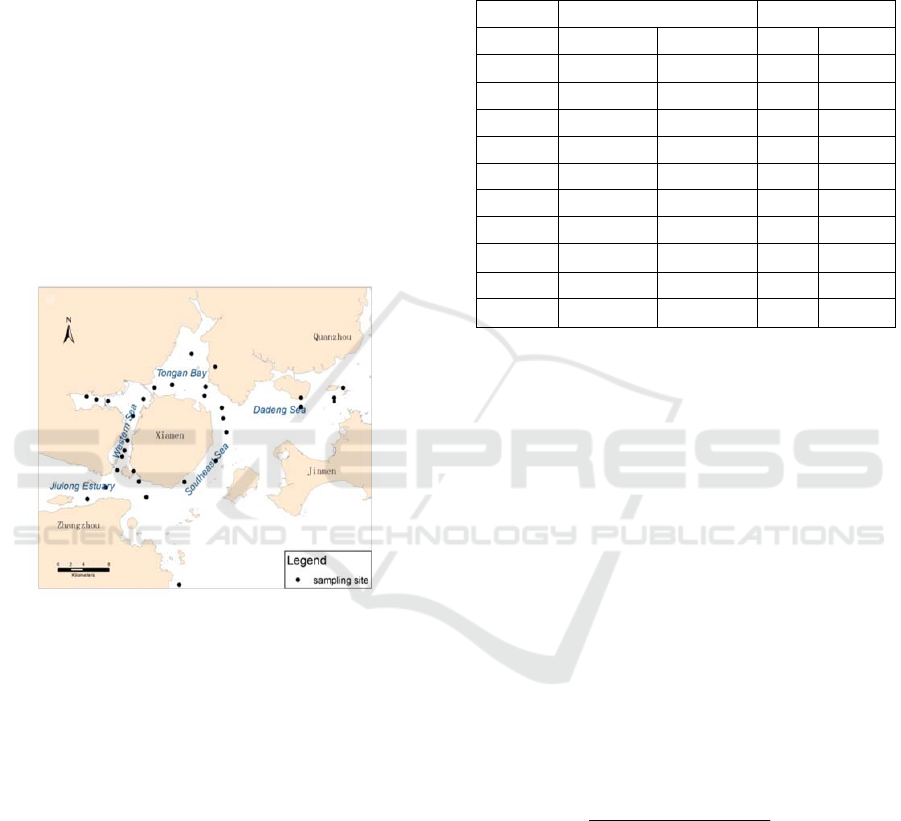
2.1 Study Area
XMB, which is a semi-enclosed bay located in
Southeast China, includes Tongan Bay, Dadeng Sea,
Southeast Sea, Jiulong Estuary and Western Sea
(Figure 1). Around XMB, there are some cities such
as Xiamen and Longhai. Developed industries and
agriculture were along the coastal areas. A large
amount of industrial and agricultural wastewaters
are received by the sea. After land-based pollutants
entered the sea, XMB faces severe environmental
crisis. Due to the closed nature and the poor
hydrodynamic conditions, land-based pollution had
a great impact on the environmental quality and
ecosystem of the XMB.
Figure 1: The map of study area with sampling sites.
2.2 Water Quality Monitoring
In order to explore the spatiotemporal variation of
water quality in XMB, a survey of seawater quality
at 30 stations was carried out in May and October
2010 (Figure 1). The monitoring was based on some
survey criteria (
State Oceanic Administration, 1998
).
The water quality parameters surveyed included
salinity, dissolved oxygen (DO), COD, nitrate
nitrogen (NO
3
-N), nitrite nitrogen (NO
2
-N),
ammonia (NH
3
-N), total nitrogen (TN), PO
4
-P and
total phosphate (TP) (Table 1). The average and
median value of Salinity, COD, NH
3
-N, DIN, PO
4
-P
and TP in October were higher than that in May.
The average and median value of DO, NO
2
-N in
October were lower than that in May. The average
value of NH
3
-N in October was higher than that in
May, while the median value in October was lower
than that in May.
Table 1: Statistical descriptives of water quality
parameters.
Average±SD Median
Indicators
May October May October
Salinity
25.53±4.84 25.91±7.95 26.24 27.91
DO
7.99±1.29 6.04±0.59 7.88 6.02
COD
1.03±1.97 1.30±1.22 0.88 0.92
NO
3
-N
0.05±0.05 0.67±0.41 0.04 0.51
NO
2
-N
0.71±0.37 0.12±0.10 0.55 0.10
NH
3
-N
0.19±0.24 0.24±0.34 0.17 0.12
DIN
0.95±0.49 1.03±0.60 0.94 0.97
TN
1.12±0.65 1.25±0.74 1.03 1.07
PO
4
-P
0.04±0.03 0.06±0.03 0.03 0.06
TP
0.06±0.04 0.10±0.04 0.05 0.09
DIN is the sum of NO
3
-N, NO
2
-N and NH
3
-N
2.3 Comprehensive Evaluation Method
for Eutrophication
Evaluation methods of seawater eutrophication
include single factor evaluation method,
comprehensive evaluation method and fuzzy
mathematics evaluation method. Since
eutrophication is a complex process and the cause of
eutrophication is multidimensional, it is impossible
to comprehensively evaluate eutrophication with a
single factor. Therefore, the comprehensive index
method has been widely applied (Zou et al., 1983;
Guo et al., 1998; Lin and Zhang, 2008). In this study,
comprehensive evaluation method for eutrophication
was also used for XMB waters eutrophication
evaluation. The formula was as follows:
6
4
10×
4500
××
=
PPODINCOD
E
(1)
Where E is eutrophication level; The COD, DIN
and PO
4
-P represent the concentration of COD, DIN
and PO
4
-P (mg / L); The DIN concentration equals
the sum of NO
3
-N, NO
2
-N and NH
3
-N
concentrations; When tE > 1, the water is considered
as eutrophic.
Spatiotemporal Changes of Nutrients and Eutrophication in a Semi-Enclosed Bay, Southeast China
121
3 RESULT AND DISCUSSION
3.1 Spatiotemporal Changes of
Nutrients
Since DIN and PO
4
-P are the main factors causing
eutrophication (1, 4) and COD contributes greatly to
eutrophication (Cai, 1998), we mainly analyzed the
spatiotemporal changes of COD, DIN and PO
4
-P in
XMB.
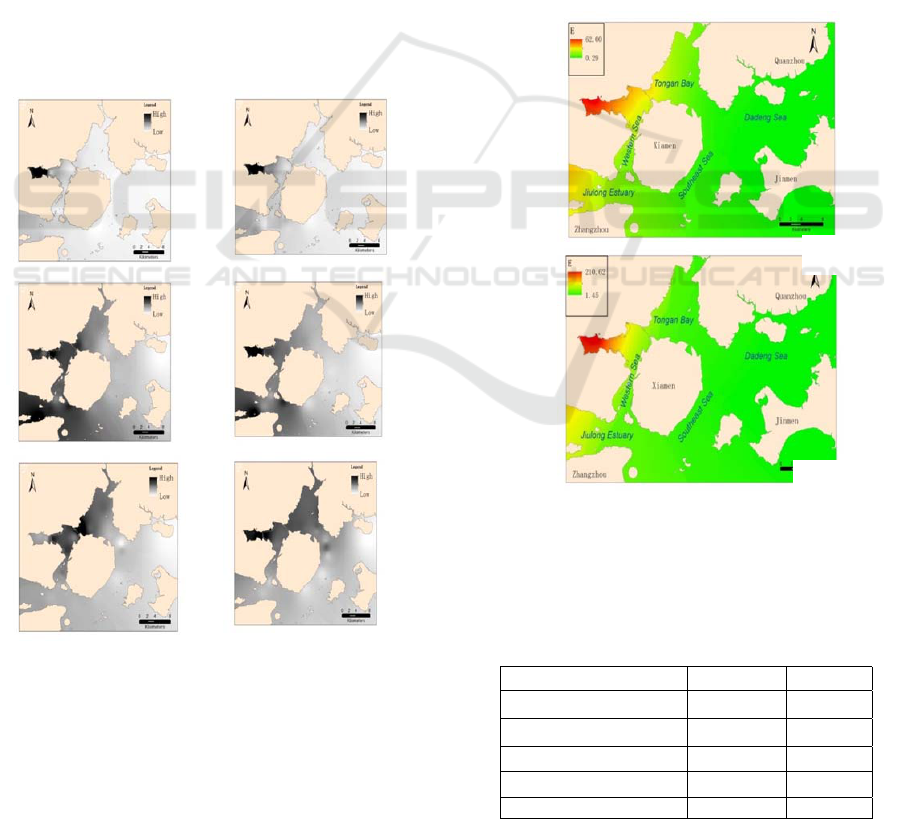
The spatial characteristics of COD, DIN and
PO
4
-P were different. In both sampling periods, the
high value areas of COD were mainly distributed at
the waters of the Western Sea. While those of DIN
were at the Western Sea and at the Jiulong River
Estuary. The high value areas of PO
4
-P in May were
mainly found at the Western Sea and the Tongan
Bay, while in October were found at the Western
Sea and at the Jiulong Estuary (Figure 2).
Figure 2: The spatiotemporal distribution of COD, DIN
and PO4-P; A, B, C and D, E, F represent COD, DIN,
PO4-P for May and October 2010, respectively.
The average of COD, DIN and PO
4
-P
concentration in October was higher than that in
May (Table 1), which might be related to high
intensity rainfall in October (Figure 2) (
Xiamen
Statistics Office, 2011
).
3.2 Spatiotemporal Changes of
Eutrophication
The spatial trends of eutrophication in May and
October 2010 were similar. The high value areas of
eutrophication were mainly distributed at the
Western Sea and at the Jiulong Estuary. Furthermore,
the eutrophication at the Southeast and Dadeng Sea
was low (Figure 3). The average and median values
of eutrophication index in May were lower than
those in October (Table 2).
Figure 3: The spatiotemporal distribution of
eutrophication.(G and H represent eutrophication for May
and October 2010, respectively.)
Table 2: Statistical descriptives of
eutrophication index.
tatistics May October
Minimum 0.09 0.82
Maximum 87.66 380.14
Average 15.07 38.48
Median 7.28 13.41
Standard Deviation 22.12 83.40
A
D
B
E
C
F
G
F
IWEG 2018 - International Workshop on Environment and Geoscience
122
3.3 Nutrient Structure Analysis
In May and October 2010, the spatial distribution of
inorganic nitrogen composition at the Xiamen Bay
was basically identical. At the Western Sea and
Tongan Bay, the proportion of ammonia nitrogen
was higher, while at the Jiulong Estuary, Southeast
and Dadeng Seas, the proportion of nitrate nitrogen
was higher (Figure 4).
Figure 4: The composition of inorganic nitrogen at
Xiamen Bay (A, b, c, d and e represent Western Sea,
Jiulong Estuary, Southeast Sea, Tongan Bay and Dadeng
Sea, respectively.)
The average of nitrate nitrogen concentration in
October was higher than that in May. However, the
nitrite nitrogen concentration in October was lower
than that in May. The average of ammonia
concentration in October is slightly higher than that
in May, but the median value is lower than that in
May (Table 1).
The conversion process of inorganic nitrogen in
water is as follows:
N-NO
⇔
N-NO
⇔
OHNH
⇔
NH
324 3
(2)
The DIN in water should be dominated by NO
3
-
N when the thermodynamic equilibrium is sufficient
under the condition of sufficient oxygen (Lin and
Zhang, 2008). The proportion of ammonia nitrogen
and nitrite nitrogen in Western Sea and Tongan Bay
was high, indicating that the water had not reached
thermodynamic equilibrium, which might be related
to human activities. The Western Sea and Tongan
Bay were within the bay, owned insufficient
hydrodynamic force and greatly affected by land-
based pollution (Pan et al., 2011). Higher nitrous
oxide concentration in October suggests that the
seawater in October did not reach the
thermodynamic equilibrium, which may be related
to the rapid increase of pollutants caused by short-
term strong rainfall (Figure 5).
Figure 5: The rainfall and rainfall days at Xiamen in
2010.
3.4 Correlation between Water Quality
Indicators
In both sampling periods, COD and DIN were
negatively correlated with salinity (Table 3), which
indicated that the main sources were land-based
source. COD was positively correlated with NO
2
-N
and NH
3
-N, indicating that their origin were similar,
which was consistent with the previous analysis
(Pan et al., 2011; Chen and Chau, 2016; Olyaie et al.,
2015).
0.0
0.4
0.8
1.2
1.6
2.0
1 3 5 7 9 11131517192123252729
mg/L
Samplingsites
nitrite
nitrogen
a
bc
d
e
May
0.0
0.5
1.0
1.5
2.0
2.5
1357911131517192123252729
mg/L
SamplingSites
nitrite
nitrogen
ab
cd
e
Octo
Spatiotemporal Changes of Nutrients and Eutrophication in a Semi-Enclosed Bay, Southeast China
123
Table 3: Correlation analysis of water quality parameters.
Month Parameters S DO COD PO
4
-P NO
2
-N NO
3
-N NH
3
-N DIN
May S
-0.664
-0.889 -0.664 -0.530
-0.855
DO
-0.562
COD
0.898
0.570
PO
4
-P
0.628 0.600
NO
2
-N
0.716 0.661
NO
3
-N
0.824
NH
3
-N
0.623
DIN
October S -0.723 -0.512 -0.797 -0.464 -0.621 -0.808
DO -0.687
COD 0.634 0.970 0.926 0.774
PO
4
-P 0.687 0.770 0.625
NO
2
-N 0.884 0.877
NO
3
-N 0.686
NH
3
-N 0.667
DIN
In both sampling periods, the relationship
between oxygen and nutrients was different: DO
was negatively correlated with PO
4
-P in May 2010,
while negatively correlated with NO
3
-N in October
2010. The above relationship might be related to the
N/P ratio (atomic ratio between TN and TP): the
average N/P ratio in May was 20.77, which was
higher than Redfield ratio (the N/P ratio is about
16:1). The increase of phosphorus could promote the
growth of phytoplankton and consuming oxygen in
water. The average N/P ratio in October was 13.51,
which was lower than the Redfield ratio. The
increase in nitrogen could promote the growth of
phytoplankton and consuming oxygen in the water
(Redfield et al., 1963).
4 CONCLUSIONS
The spatiotemporal characteristics of COD, DIN and
PO
4
-P were different. In May and October 2010,
COD decreased from Western to Southeast Sea,
while DIN decreased from Western Sea and Jiulong
River Estuary to Southeast Sea. The high value areas
of PO
4
-P in May were mainly distributed at the
Western Sea and Tongan Bay, while in October
were mainly distributed at the Western Sea and
Jiulong Estuary. The average of COD, DIN and
PO
4
-P concentration in October was higher than that
in May. The spatial trends of eutrophication in May
and October 2010 were similar. The eutrophication
level in May and October 2010 decreased from
Western Sea and Jiulong Estuary to Southeast and
Dadeng Sea. The eutrophication in May was lower
than that in October.
In May and October 2010, the proportion of
ammonia nitrogen was higher at the Western Sea
and Tongan Bay, while at the Jiulong Estuary,
Southeast and Dadeng Sea, the proportion of nitrate
nitrogen was higher. Poor hydrodynamic force,
land-based pollution and short-term strong rainfall
might contribute to eutrophication.
Correlation analysis showed that the main
sources of pollution were land-based sources. The
origins of COD, NO
2
-N and NH
3
-N were similar.
Changes in DO might be related to the N/P ratio.
In order to better understand the spatiotemporal
changes of nutrients and eutrophication in XMB, a
better sampling strategy is necessary. Numerical
models can be used to determine if monitoring
stations should be added for more targeted
investigation. Furthermore, it might be necessary to
increase the time frequency of sampling in different
seasons
IWEG 2018 - International Workshop on Environment and Geoscience
124

ACKNOWLEDGMENTS
The research was funded by the National Natural
Science Foundation of China (Grant No.41406121).
REFERENCES
Cai Q 1998 Distribution of COD in the Sea Area Around
Island in the Southern Fujian Marine Science Bulletin
17
Capriulo G M, Simith G and Troy R, et al. 2002 The
planktonic food web structure of a tem perate zone
estuary and its alteration due to eutrophication
Hydrobiologia 1
Chen X and Chau K 2016 A Hybrid Double Feedforward
Neural Network for Suspended Sediment Load
Estimation Water Resources Management 30
Guo W, Zhang X and Yang Y, et al. 1998 Potential
eutrophication assessment for Chinese coastal waters
Journal of Oceanography in Taiwan Strait 17
Lin H and Zhang Y 2008 A study on the changes of
seawater eutrophication in Xiamen Bay Journal of
oceanography in Taiwan Strait 27
Olyaie E, Banejad H and Chau K, et al. 2015 A
comparison of various artificial intelligence
approaches performance for estimating suspended
sediment load of river systems: a case study in United
States Environmental Monitoring and Assessment 187
Pan C, Zhang L and Huang J, et al. 2011 Estimation of
marine pollution load in West Sea and Tong an Bay in
Xiamen Marine Environmental Science 30
Redfield A C, Ketchum B H and Richards F 1963 The
influence of organisms on the composition of seawater.
In: Hill M N ed. The Sea. Vo12. John Wiley. New
York
State Oceanic Administration 1998 Marine monitoring
specifications GB17378-2007, Standards Press of
China
Xiamen Statistics Office 2011 Xiamen Statistics Chinese
Statistics Press
Yuan D, Yao P and Xu X, et al. 2016 Water
Eutrophication Model of Bohai Bay Based on
Bayesian Networks Journal of Tianjin University
(Science and Technology) 49
Zhang C, Wang X and Shi X, et al. 2007 Seasonal
variation and spatial distribution of nutrients and their
relationships with harmful algal blooms in coastal area
of the East China Sea Environmental Science 28
Zhang L, Yu L and Tang M 2009 Eutrophication and red
tide in coastal waters of Zhanjiang port Water
resource protection 25
Zou J, Dong L and Qin B 1983 A Preliminary Study on
Eutrophication and Red Tide in Bohai Bay
Marine Environmental Science 2
Spatiotemporal Changes of Nutrients and Eutrophication in a Semi-Enclosed Bay, Southeast China
125
