
Distribution and Enrichment of Nuclide Cs-137 in Typical Fishery
of North Pacific High Seas
Fenghua Tang
*
and Xuesen Cui
Key Laboratory of East China Sea & Oceanic Fishery Resources Exploitation and Utilization, Ministry of Agriculture,
East China Sea fisheries Research Institute,Chinese Academy of Fishery Sciences, Shanghai 20009, China.
Email: f-h-tang@163.com.
Keywords: North Pacific high seas, radionuclide, neon flying squid, risk assessment
Abstract: Typical biological samples were analysed in central fishing grounds in North Pacific high seas for three
consecutive years from 2011-2013, to understand the impact of Japan's Fukushima nuclear leakage on the
high seas fishery, in order to develop the natural fishery resources of the north Pacific Ocean. The sample
was dominated by Neon flying squid. It was found that all samples contained radionuclide Cs-137 by a
gamma ray spectrometer and cross-check analysis was carried out among different species, organs and
tissues. The distribution of nuclide in Marine organisms in the northern Pacific Ocean and its risk
assessment were carried out. There were a large number of samples collected from 2011 to 2012. A Cs‐137
specific activity higher than the base one was detected for the entire sample. In 2011, the nuclide was 0.05
to 6.21 Bq•kg
-1
, compared with the activity range of 0.02 to 0.46 Bq•kg
-1
in 2012. In 2013, there were only
two types of samples collected, and the range of activity was the base value to 0.37 Bq•kg
-1
. The quality
activity of the nuclides of each nutrient-grade organism was averaged, and the average of the three years
was 0.49 Bq•kg
-1
. The mass activity of nuclide has inverted pyramid distribution. The quality activity level
of the nuclide during the three years' survey did not exceed the concentration of radionuclide quality in
Chinese food and the standard line of general level. At present, the risk assessment of radioactive element
Cs-137 showed that the quality activity of nuclide was in a relatively safe range, but the follow-up
monitoring was needed.
1 INTRODUCTION
In March 2011, the nuclear leakage accident at the
Fukushima nuclear power plant in Japan released
radioactive substances into the atmosphere or
deposited on land or in the ocean, which not only
caused serious impacts on the surrounding land
environment (Thakur et al., 2013). After the
Fukushima nuclear accident, the radioactive nuclide
released by the nuclear power plant not only caused
an increase in the external radiation dose rate, but
also affected the fishing industry (Buesseler, 2014;
Inoue et al., 2015). The squid fishing ground in the
high seas of the north Pacific is one of the most
important ocean fisheries in China. Among them,
neon flying squid (Ommastrephes bartramii) is the
main economic variety in the area (Yamamoto et al.,
2002). The central fishing ground is located in the
North Pacific Ocean, where the black tide and the
pro-tidal mixing zone and the mixed water eastward
extend the sea surface temperature distribution
densely (Fan et al., 2009). Now, it is necessary to
understand and master the concentration of Cs-137
nuclide in marine organisms and the degree of
hazard risk. Therefore, this research in the three
consecutive years from 2011 to 2013 in the area for
collection mainly related to biological utilization
gamma energy spectrum analysis method to
determine the specific activity radioactive
substances, in Cs-137 nuclide ecological
environment monitoring and risk assessment,
discusses the Fukushima nuclear leak to the north
Pacific high seas neon flying squid fishing grounds
and the diffusion trend influence on subsequent,
resources reasonable development.
Tang, F. and Cui, X.
Distribution and Enrichment of Nuclide Cs-137 in Typical Fishery of North Pacific High Seas.
In Proceedings of the International Workshop on Environment and Geoscience (IWEG 2018), pages 115-119
ISBN: 978-989-758-342-1
Copyright © 2018 by SCITEPRESS – Science and Technology Publications, Lda. All rights reserved
115
2 MATERIAL AND METHODS
OF EXPERIMENT
2.1 Sampling Method
The sampling time was divided into 2011-2013
fishing season. The data were taken from the fishing
grounds of the north Pacific high seas center, and
the working vessels were "Zhouyu 1301" and
"Zhouyu 901", and the operation mode was light
squid fishing. The biological experiment samples
were recorded, including sampling biological name,
sampling date, space location, etc.
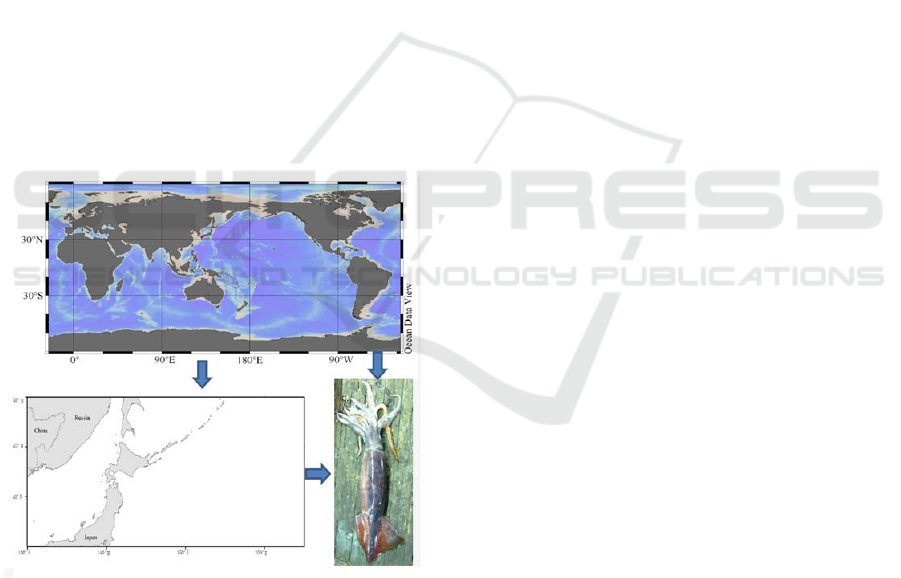
The sampling area and main fishing objects were
shown in figure 1. A box is shown in the center of
the north Pacific high seas fisheries sampling area,
located at 135°E ~165°E and 39°N ~46°N. The
specific position of samples taken along the 3 years
were different but from the same sampling space.
The samples were taken for neon flying squid and
related Marine life. All samples were frozen and
brought back to laboratory for processing and testing.
Figure 1: Sampling area in the North Pacific Ocean and an
example of a sample.
2.2 Detection and Evaluation Methods
(1) Food Chain Nutrition Level
Through the marine biological sample stomach
contained ingredients and feeding level analysis and
biology identification, bait consists of cephalopod,
fish and crustaceans. The bait of neon flying squids
was found to consist of cephalopods, fish and
crustaceans. And it is a prey for large fish (Wang
and Pan, 2004). Studies to Neon flying squid is an
intermediate nutrition class, which establishes a
simple tertiary level of nutrition.
(2) Determination of Nuclide Ratio Activity
The pretreatment of the test was more
complicated. The basic steps were: thawing,
dissection, subdivision, and cutting, incineration,
sample loading, and final weighing mark. The
nuclide detection method was used to determine the
sample Cs-137 ratio activity by using the High
Purity Germanium passive efficiency scale. The
measurement accuracy of radionuclides was as the
standard reference material of IAEA-414 (
IAEA,
2016
). The calculation formula of activity
concentration is below (Walling and Quine, 1993).
a=asꞏWꞏr/ [ε(E) ꞏPꞏm] (1)
In the formula, a is the quality activity of Cs-137
in the sample (Bq∙kg-1); as is standard source Cs-
137 total peak net count rate (s-1); ε(E) is the
standard source Cs-137 all-around peak detection
efficiency; P is Cs-137 661.6 keV universal peak
branching ratio; M for sample ash measurement (g);
W is the gray fresh ratio (gꞏkg-1); R is the Cs-137
time decay correction coefficient.
(3) Risk Assessment Method
The Risk Assessment of the radioactive material
of Fukushima nuclear accident on Marine life is
based on the EU Assessment and Management of
Environmental Risk from ionizing framework to
assess the ecological Risk of ionizing radiation
(Larsson, 2008).
3 RESULT
3.1 Detection Overview and Position
Distribution of Nuclide
The detection situation of Cs-137 is shown in figure
2 in 2011-2013. The highest Cs‐137 activity in 2011
was located at 154°51′E and 43°12′N, but the lowest
position was the Sea of Japan Sea, in 132° 44′E and
37.85° N. The highest Cs‐137 activity in 2012 was
located in 160°37´and 45°23´N, but the lowest of
them was the Sea of Japan, in 131°47′E and 36°50′N.
The highest Cs‐137 activity in 2013 was located in
the vicinity of 42°N and 158°E of the fishery center.
IWEG 2018 - International Workshop on Environment and Geoscience
116
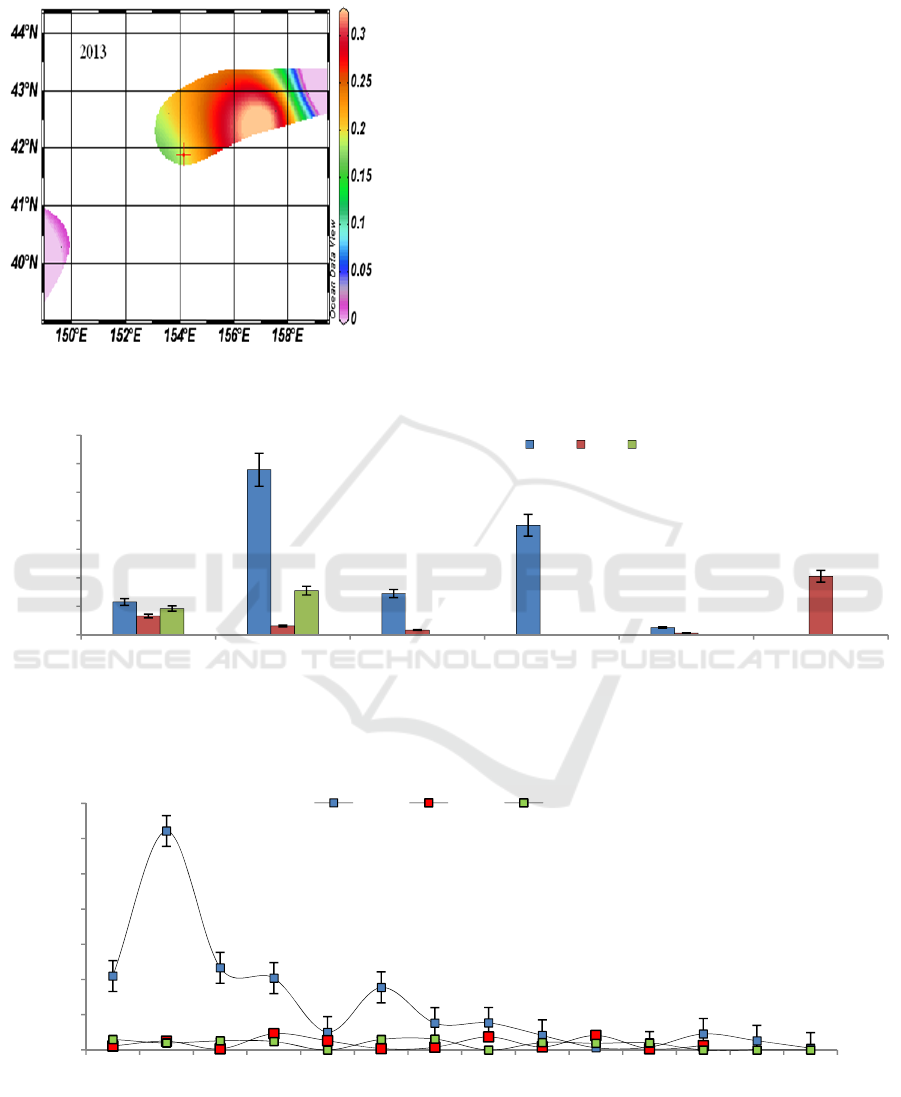
Figure 2: Spatial distribution of nuclide Cs‐137 mass
activity.
3.2 Distribution of Nuclide Cs-137 in
Marine Organisms
Distribution of Cs-137 mass activity in different
marine organisms is shown in figure 3. Among them,
the activity of the shark (Mustelus griseus) was the
highest, and the lowest was Japanese flying squid
(Todarodes pacificus) in the Sea of Japan in 2011.
In 2012~2013, the quality activity of Cs-137 was
basically reduced by an order of magnitude, and the
highest in 2012 was the Dolphin fish (Coryphaena
hippurus), the lowest in the Sea of Japan. In 2013,
the average quality activity Cs-137 of shark was
0.31 Bq∙kg
-1
, and average quality activity Cs-137 of
neon flying squid was 0.18 Bq∙kg
-1
. These marine
life samples have been collected essentially within
the same fishery area.
Figure 3: Distribution of nuclide Cs-137 activity in Marine organisms.
Figure 4: Distribution Change of nuclide Cs-137 with Sampling Time.
0.00
0.20
0.40
0.60
0.80
1.00
1.20
1.40
Neon flying squid Shark Pacific Saury Rainbow light
cherry clam
Japanese flying
squid
Dolphin fish
a(137Cs)/(Bq∙kg-1)
Marine animal
2011 2012 2013
0.00
1.00
2.00
3.00
4.00
5.00
6.00
7.00
12/Aug 18/Aug 20/Aug 22/Aug 18/Sep 10/Oct 12/Nov
a(137Cs)/(Bq∙kg-1)
Date
2011 2012 2013
Distribution and Enrichment of Nuclide Cs-137 in Typical Fishery of North Pacific High Seas
117
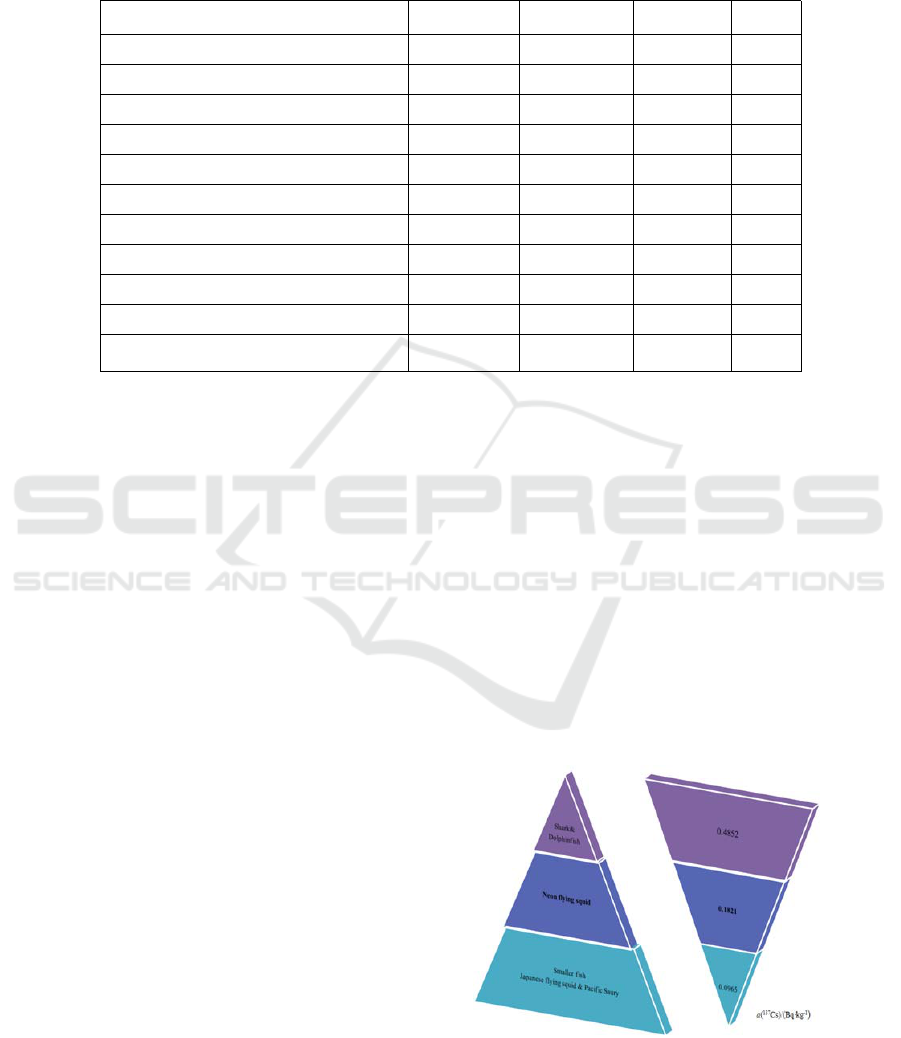
Table 1: Results of nuclide total radiation dose rates each year from ERICA tools evaluation
(mGyꞏh
-1
).
Biota 2011 2012 2013 Trend
Pelagic fish 7.69E-03 4.34E-04 2.32E-04 ↓
Benthic fish 8.55E-04 6.77E-03 1.92E-03 ↓
Phytoplankton 6.55E-04 1.82E-04 1.14E-03 ↓
Zooplankton 8.22E-03 4.36E-04 8.74E-03 ↓
Crustaceans 1.74E-02 1.23E-05 5.56E-04 ↓
Benthic mollusks 3.35E-03 3.31E-04 2.96E-04 ↓
Polychaete worms 1.24E-02 3.44E-04 4.12E-03 ↓
Reptiles 4.46E-03 8.99E-04 8.24E-04 ↓
Sea anemones or true corals -colony 8.14E-03 3.44E-04 1.36E-03 ↓
Mammals 9.98E-03 9.16E-04 2.11E-03 ↓
Macroalgae 3.44E-04 3.43E-03 2.33E-04 ↓
3.3 Distribution of Nuclide cs-137
Overtime
The distribution of the Cs-137 nuclide in specific
time changes is shown in figure 4. The highest
quality activity of Cs-137 in 2011 sampling date was
Aug. 16, and the lowest was Dec. 3. The highest
quality activity of Cs-137 was October 1st, and the
lowest was December 7th in 2012. The highest
quality activity of Cs-137 in 2013 was Aug. 22, the
lowest of which was Aug. 20. There was no obvious
change in the distribution of Cs-137 with sampling
time every year.
3.4 Delivery and Enrichment of
Nuclide Cs-137 in the Marine Food
Chainss
According to the food chain relationship of neon
flying squid, the simple three-level food chain
relationship was proposed, and the quality activity
of Cs-137 nuclides of various nutrition-grade
organisms was normalized in 2011-2013. Among
them, large fish include shark and dolphin. The
average of 3 years was 0.49 Bq∙kg
-1
. The average of
neon flying squid was 0.18 Bq∙kg
-1
. Small fish
include pacific saury and Japanese flying squid, with
an average of 0.10 Bq∙kg
-1
. After 3 years of
nutritional level analysis, as shown in figure 5, the
quality activity of the three nutrient-level Cs-137
nuclides has inverted pyramid distribution. There
were many samples used to get the average activities
every year.
3.5 Risk Assessment of Radionuclides
With ERICA secondary assessment system do the
filter value choice 10 mGy∙h
-1
assessments of Cs-
137 for 3 years, the output under the labels are listed
in table 1. All of the organisms had total dose basic
within 10
-4
~10
-2
orders of magnitude. From 2011 to
2013, the total dose of Cs-137 in each biological
group was decreasing year by year, and the
maximum value was lower than 1.0 mGy∙h
-1
. As the
table shows, the overall assessment of all biological
groups showed a downward trend in the relative
safety limits.
Figure 5: Distribution of activity in trophic level of
average of three years in the fisheries.
IWEG 2018 - International Workshop on Environment and Geoscience
118

4 CONCLUSIONS
Quality activities of Cs-137 in the sea area of the
North Pacific Ocean were beyond the base value of
the sample, according to the investigation in 2011-
2013. In 2011, the average quality activity of the
nuclide Cs-137 in the sample was 0.50 Bqꞏkg
-1
, and
the average quality activity was 0.19 Bqꞏkg
-1
in
2012~2013. Had not been measured quality of
nuclide activity level more than China's food quality
of radionuclide activity of 300 Bqꞏkg
-1
limit
concentration and the general level of 1000 Bqꞏkg
-1
line. The test results contrast in prophase
investigation showed a trend of decrease. Different
intake routes, including water and food, radionuclide
role of marine biological accumulation, and the
marine life of radioactive nuclide concentration as
well as the process of accumulation in different
tissues and organs, are worthy of further research in
the future.
ACKNOWLEDGMENTS
The study was Supported by National Nonprofit
Institute Research Grant (2016Z01-03), Central
Public-interest Scientific Institution Basal Research
Fund, CAFS (NO.2018HY-XKQ0305), Open
Research Fund of State Key Laboratory of Estuarine
and Coastal Research (SKLEC201206).
REFERENCES
Buesseler K O 2014 Fukushima and ocean radioactivity
Oceanography 27 92
Fan W, Wu Y M and Cui X S 2009 The study on fishing
ground of neon flying squid, Ommastrephes bartramii,
and ocean environment based on remote sensing data
in the Northwest Pacific Ocean J. Oceanol. & Limnol.
China 27 408
Inoue M, Yoneoka S and Ochiai S, et al. 2015 Lateral and
temporal variations in Fukushima Dai-ichi NPP-
derived Cs-134 and Cs-137 in marine sediments
in/around the Sado Basin Sea of Japan J Radioanal
Nucl Chem 303 1313
International Atomic Energy Agency (IAEA) 2006
Certified reference material for radionuclides in fish
flesh sample IAEA-414 (mixed fish from the Irish Sea
and North Sea) Appl Radiat Isot 64 1253
Larsson C M 2008 An overview of the ERICA Integrated
Approach to the assessment and management of
environmental from ionizing contaminants Journal of
Environmental Radioactivity 99 1364
Thakur P, Ballard S and Nelson R 2013 An overview of
Fukushima radionuclides measured in the northern
hemisphere Sci Total Environ 458 577
Walling D E and Quine T A 1993 Use of caesium-137 as a
tracer of erosion and sedimentation: Handbook for the
application of the cesium-137 technique. UK Overseas
Development Administration Re-search Scheme
R4579 Department of Geography, University of
Exeter 35
Wang W X and Pan J F 2004 The transfer of metals in
marine food chains: A review Acta Ecologica Sinica
24 599
Yamamoto J, Masuda S, Miyashita K and Uji R, et al
2002 Investigation on the early stages of the
ommastrephid squid Todarodes pacificus near the Oki
Islands Bull Mar Sci 71 987
Distribution and Enrichment of Nuclide Cs-137 in Typical Fishery of North Pacific High Seas
119
