
Analyis Benford’s Law Model as an Alternative for Benchmark
Behavioral Model Method to Identify Tax Payer’s Compliance
Case Sudy: DGT Regional South Jakarta II
Mochamad Febrian Nurdhin and Christine Tjen
Department of Accounting, Faculty of Economics and Business, University of Indonesia, Jakarta, Indonesia
febrian.nurdhin2@gmail.com, indivara_devi@yahoo.com
Keywords: Account Representative, Benchmark Behavioral Model Benford’s Law Model, Tax Payer’s Compliance,.
Abstract: This research aims to assess the effectiveness of Benchmark Behavior Model (BBM) implementation
method for identifying tax payer’s compliance and to know the implementation of Benford’s Law Model as
an alternative method of BBM. Research method used in this research is mixed method through interviews
and distribution of questionnaires to Account Representative in Directorate General of Tax Regional South
Jakarta II and by conducting quantitative testing on the elements of post tax returns Annual Income Tax
1771 tax year 2015. According to the interviews and distributed questionnaires, it can be informed that
implementation of BBM method is not effective and required a new method as a tool in overseeing tax
payer’s compliance. Based on testing in the elements of post tax returns Annual Income Tax 1771, it can be
informed that Benford's Law Model can be used as an alternative method in overseeing tax payer’s
compliance.
1 INTRODUCTION
National development is the government's efforts in
realizing the welfare of the people both materially
and spiritually. In carrying out the implementation
of the development, the government needs funds to
finance the state expenditure. The largest source of
funds for national development comes from tax
revenue. Based on data at the Directorate General of
Budget of the Ministry of Finance during 2010-
2016, taxes contribute on average above 63 percent
as a source of revenue on the State Budget (APBN).
To support the tax revenue target that always
increases from year to year, the Government has
made several tax reforms, beginning in 1983 by
changing the tax calculation system from official
assessment to self assessment. Implementation of
self assessment system system will be effective if
the tax payer’s compliance has been formed
(Darmayanti, 2012).
The indicator that becomes the parameter in
determining the taxpayer’s compliance level is the
rate of return of the annual tax return of the
corporate and personal tax payer’s.
Table 1 Annual Rate of National Tax Return
Stateme
nt/Year
2013 2014 2015 2016
Register
ed Tax
Payer
24.347.7
70
27.379.2
55
30.044.1
03
32.769.0
00
Mandato
ry
Return
Spt
17.731.7
36
18.357.8
33
18.159.8
40
20.166.0
00
Spt
Return
9.951.73
1
9.970.85
9
10.972.5
29
12.735.0
00
Complia
nce
Ratio
56,12% 54,31% 60,42% 63,15%
Source: http://www.pajak.go.id/DJP Annual Report
2016, processed
According to the data above, it can be informed
that the annual report rate return of tax payer’s has
increased compared to the number of registered
taxpayers, but the average ratio of compliance rate
Nurdhin, M. and Tjen, C.
Analyis Benford’s Law Model as an Alternative for Benchmark Behavioral Model Method to Identify Tax Payer’s Compliance - Case Sudy: DGT Regional South Jakarta II.
In Proceedings of the Journal of Contemporary Accounting and Economics Symposium 2018 on Special Session for Indonesian Study (JCAE 2018) - Contemporary Accounting Studies in
Indonesia, pages 371-381
ISBN: 978-989-758-339-1
Copyright © 2018 by SCITEPRESS – Science and Technology Publications, Lda. All rights reserved
371

only reached 56 percent and the highest of
annual
tax return (SPT) is in 2016 , that is equal to 63.15
percent.
One of the primary activities undertaken to
examine taxpayers' compliance is monitoring
activity which is performed by Account
Representative (AR). AR has a task for identifying
taxpayers who are at risk of non-compliance,
providing an overview of what tax aspects are
indicators of non-compliance, as well as conducting
various series of potential tax intensification
procedures that can still be optimized. To support
these task, the Directorate of Potential Compliance
and Acceptance of the Directorate General of Taxes
had established a tool as well as a principle in
conducting a fair analysis of financial ratios reported
through annual tax returns to detect non-
compliance’s of the corporate taxpayer. This method
is called the Benchmark Behavioral Model (BBM).
The results of this benchmarking will provide a list
of priorities of corporate taxpayers who need to be
paid attention to the fairness of its SPT as well as
open opportunities for more in-depth analysis of the
components that have been reported on the annual
tax returns. Based on the description above, the
researcher is interested to assess how the
effectiveness of BBM method is used as a tool to
supervise taxpayer’s compliance.
According to the BBM’s previous research
which was conducted by Fikri, Setyadi and
Hardiansyah (2016), it gave a recommendation to
Directorate General of Taxes (DGT) for
implementing a new method to identify taxpayer’s
non-compliance, so in this research, Researcher will
also discuss how to use Benford's Law Model as an
alternative method of BBM for identifying
taxpayer’s compliance. Based on Benford’s Law, the
numbers that appear naturally, then the frequency of
occurrence of these numbers will follow a certain
rule. Conversely, if there is a deliberate element by
humans in creating a combination of numbers and
entered in a data set, it will show certain numbers
that are more or less emerging than expected (Arkan,
2010). Benford's Law is chosen as an alternative
method because this method has been proven to be
used to detect the anomalies of data sets in various
fields (Nigrini, 2000) and to identify fraud in
accounting data (Durtschi et al., 2004).
2 LITERATURE REVIEW
2.1 Theory of Taxation
Taxation system that implemented self-assessment
system, demanding the active role of the taxpayer in
fulfilling their tax obligations so as to achieve high
taxpayer’s compliance, namely compliance with tax
obligations in accordance with the actual conditions.
According Nurmantu (2005) taxpayer’s compliance
is divided into two kinds of formal compliance and
material compliance. Formal compliance is the
circumstance in which the taxpayer meets
its tax
obligations formally in accordance with the
provisions in the law covering the timeliness in
making payments and amounts deposited. Material
compliance is the fulfillment of tax
obligations
where the taxpayer in substance/essence meets all
the provisions of taxation, namely in accordance
with the contents and the main purpose of tax law.
AR is tasked with intensifying activities in the
field of taxation through the provision of
guidance/appeal, consultation, analysis and
supervision of taxpayers. Based on Regulation of the
Minister of Finance (PMK) No. 79/PMK.01/ 2015
on Account Representative (AR) at Tax Office,
Account Representative consists of: AR that
performs service and consultation function and also
AR who performs supervision and in-depth intensive
function of potential taxpayer.
In accordance with Internal Letter Number SE-
27/PJ/2015 on Auditing by Tax Audit Officer, AR
located in Small Tax Office and appointed as Tax
Audit Officer (P3) by Head of Office authorized to
conduct examination with certain scope, type and
criteria of auditing as referred to General Provisions
and Tax Procedures (KUP).
2.2 Monitoring of Corporate Tax Payer’s
Method
In order to improve the guidance and supervision of
Taxpayers by the Small Tax Office, the Head Office
of the Directorate General of Taxes had issued
Internal Letter of the Director General of Taxes No.
SE-96/PJ/2009 dated October 5, 2009 on Total
Benchmarking Ratio and Its Utilization Directive.
The benchmarking process was further transformed
into Benchmark Behavioral Model (BBM) in 2012
through SE-40/PJ/2012 and in 2016 had been refined
through SE-02/PJ/2016 on Processing of Benchmark
Behavioral Model and its Follow Up.
JCAE Symposium 2018 – Journal of Contemporary Accounting and Economics Symposium 2018 on Special Session for Indonesian Study
372

BBM is one of the potential taxpayer
intensification tools through mapping the risk of
non-compliance of registered corporate taxpayer in
DGT database. This BBM method has a principle is
only a tool (supporting tools) that can be used by AR
in assessing tax payer’s compliance and can not be
used directly as the basis of the issuance of tax
assessment letters. BBM is designed by comparing
the financial performance of the corporate taxpayer
with the financial performance of the group of
taxpayers of the same Entity, ie the corporate
taxpayer which is in the same business
classification, registered in the KPP on the same
Regional Office, and within the similiar business
scale.
2.3 Benford’s Law Model as an
Alternative Method For
Monitoring Corporate Tax Payer’s
Compliance Method
According to Nigrini (2000) Benford's Law is often
used in various fields because of its ability to detect
data anomalies on a data set. The anomaly, if traced
further, may help to detect fraud. Nigrini is the first
researcher to extensively use Benford's Law in
accounting data for the purpose of detecting fraud.
Benford's Law has proved effective in detecting
fraud in accounting data (Durtschi et al., 2004).
According to Nigrini as quoted by Arkan (2010),
there are 8 (eight) number criteria (data set) that
must be met in order to be analyzed by using
Benford's Law.
Nigrini as quoted by Arkan (2010) explains that
there are 5 (five) major testing steps to determine
whether a set of quantitative data follows a
Benford's Law pattern or not. The 5 (five) tests are
First-Digits Tests (FD), Second-Digits Tests (SD),
First-Two Digits Tests (F2D), First-Three Digits
Tests (F3D), and Last-Two Digits Tests (L2D).
Digital analytics tools such as Benford's Law do
allow auditors to focus on samples that are
considered to have an indication of fraud, but have
not proven that cheats exist. Therefore, it needs
further deepening through testing, that is a
goodness-of-fit test. This test is used to determine
whether the data being analyzed is really appropriate
or completely different from Benford's Law. Nigrini
(2000), as quoted by Arkan (2010), suggest that
there are several tests to test it, namely: Z-Statistic,
Chi-Square, Kolmogorof-Smirnoff, Mean Absolute
Deviation (MAD).
3 RESEARCH METHODS
This research is conducted at 8 (eight) Small Tax
Offices in Work Area of Regional Office of DGT
South Jakarta II. Research subjects in qualitative
data are all AR population in Section of Supervision
and Consultation (AR Waskon II, III and IV) in
Small Tax Offices DGT Regional South Jakarta II.
Research subjects on quantitative data are all
corporate taxpayers who have submitted SPT 2015
tax year. The method used in this study is mixed
methods which is using primary data and secondary
data as data sources. Primary
data and secondary
data that have been collected in this research in the
form of quantitative data and qualitative data.
Quantitative data is used as
a tool to explain
qualitative data so that information and
understanding can be obtained related to the
effectiveness of implementation of Benchmark
Behavioral Model as a tool to detect non-compliance
of Taxpayer as well as various obstacles and
limitations in its implementation. To test the validity
of quantitative data in the form of nominal data, the
researcher performs the validity and reliability test.
This research has the following framework:
Figure 1 Research Framework
The following analysis steps according to the
research framework above are:
1. Analysis of qualitative and quantitative data to
answer the first problem formulation: how is the
effectiveness of taxpayer’s compliance
monitoring implementation by using BBM
method in Small Tax Office in the area of DGT
Regional South Jakarta II. The analysis is
beginning by conducting interviews and
distributing questionnaires in 8 (eight) Small Tax
Offices in the DGT Regional South Jakarta II. To
corroborate the results of research, then tested
the validity of the statement on the results of
questionnaires in the form of nominal data
through validity and reliability test by using the
microsoft office excel 2010 program;
Analyis Benford’s Law Model as an Alternative for Benchmark Behavioral Model Method to Identify Tax Payer’s Compliance - Case Sudy:
DGT Regional South Jakarta II
373

2. Analysis performed on quantitative data to solve
the second problem formulation: How to use
Benford’s Law Model method as an alternative
method of BBM as a tool for identifying tax
payer’s non compliance. Based on the Benford’s
Law guidance, The analysis is conducted on the
income post, purchasing of goods/merchandise
post, salary cost, transportation cost and rent cost
from the data of SPT Annual Corporate Income
Tax of 1771 fiscal year 2015. The first analysis is
quantitative test against existing data set criteria.
Further analysis by testing the data type which is
the nominal data, through Chi-Square test and
Mean Absolute Deviation (MAD). The last stage
is to perform a quantitative test consisting of 3
(three) stages: First-Digits Test (FD), Second-
Digits Test (SD), First-Two Digits Test (F2D)
and Z-Statistic test. The output of the test above
is the list of taxpayers who are potentially
disobedient in reporting the annual tax return.
The next step is to compare the results of data
referred to the data of taxpayers who follow the
Tax Amnesty program based on Law No. 11 of
2016.
4 FINDING OUT
The overall working area of the Regional Office of
DGT South Jakarta II consists of 6 (six) sub-districts
namely Kebayoran Baru, Kebayoran Lama,
Pesanggrahan, Cilandak, Pasar Minggu and
Jagakarsa. The working area of the DGT Regional
South Jakarta II has unique characteristics because it
consists of residential areas, offices, trade and
business. In 2016, the DGT Regional South Jakarta
II managed to reach a total revenue of 102.12% or
Rp25.28 trillion beyond the 2016 target of Rp23
trillion. This achievement placed the DGT Regional
South Jakarta DJP II at the 1st rank nationally, well
above the national rank of DGT Regional South
Jakarta I at rank 21st. The highest revenue
percentage in 2016 derived partly from the
contribution of tax amnesty in period I and II with a
percentage of 25 % or Rp. 6.3 trillion. In 2016, the
government launched a tax amnesty program
through Law Number 11 of 2016 on July 1st. Tax
Amnesty is a government policy that eliminates
taxes that should be owed, not subject to tax
administration punishment and criminal
punishments in the field of taxation. This facility can
be obtained by the taxpayer who disclosing the
assets (either inside or outside the country that has
not been/not reported in SPT) and by paying number
of money to the treasury state in accordance with the
tariff that has been determined during this period of
Tax Amnesty.
The overall realization of tax revenues at the
DGT Regional South Jakarta II, which includes
periodic revenues and extra effort (tax amnesty) in
2016, provides some fundamental risks that need
special attention. Those are:
1. The slowing growth of routine revenue base
(excluding revenue from tax amnesty) from
17.22% in 2015 to only 5.42% in 2016 or a
decrease of 11.8%;
2. The high number of tax refund in 2016 which
reached Rp1. 677 trillion. This amount is the
largest refund numbers in DGT and has created
deficit for routine revenue realization. To
overcome deficit revenue realization because of
this refunds, various extra efforts must be taken
to ensure the revenue target by conducting more
intensive supervision
of taxpayer compliance
fulfillment obligations. Increasing tax payer’s
compliance especially material compliance is the
key success to achieve tax realization.
5 ANALYSIS AND DISCUSSION
BBM method is a tool that can be used in
intensification activities to increase material
taxpayer’s compliance. The process of BBM is
undertaken at DGT Regional South Jakarta II
(Kanwil). The ouptput of this process is a
nominative list of risky corporate taxpayers that
shall be followed-up by AR. In practice, AR
rarely/never uses the nominative list of risk taxpayer
data based on this BBM method as a basis for
issuing tax assessment and for the proposed material
of special risk analysis examination to the Tax
Auditor. According to the results of interviews with
several AR in the Small Tax Office from DGT
Regional South Jakarta II, these things occurred due
to several reasons as follows:
a. The data based on the BBM method analysis is
merely an early indication of non-compliance
which still needs to be comprehensively analyzed
and proven whereas AR authority is limited to
only publish SP2DK and conduct visit;
b. Most of AR do not fully have ability and
knowledge to understand what it is BBM
Method. They rely more on data sources that are
concrete data types because they no longer need
to do analysis and prove the origin of the truth;
c. Most of Taxpayers refuse the contents of SP2DK
on postings that are identified unreasonably
JCAE Symposium 2018 – Journal of Contemporary Accounting and Economics Symposium 2018 on Special Session for Indonesian Study
374

based on the BBM method referred to the
reasons taxpayers have reported all the
fulfillment of their tax obligations and allow
officers to examine theirs if they are not
appropriate fulfilling their tax obligations;
d. Data analysis based on BBM method requires
time, energy and mind, whereas based on its
primary task and function AR only conduct
supervision to taxpayer, but in practice many
adhoc tasks to be done by AR and very time
consuming.
After conducting the interview, the researcher
distributed questionnaires to the AR Section of
Supervision and Consultation II, III, and IV at 8
(eight) KPP at DGT Regional South Jakarta II with
the total of AR as many as 176 employees. The
number of employees who fill and return this
questionnaire as many as 123 employees or by 70
percent of the total respondents on observations.
This number has exceeded the minimum number
122 as the representative sample boundary and
sufficient amount based on the slovin formula. For
testing the validity and reliability of the items of the
statement submitted in the questionnaire, the
researcher undertaking the validity and reliability
test.
5.1 Validity Test
This test is performed with the purpose of
obtaining the validity of the measurement, ie the
accuracy of the measuring variable. A statement
item is declared valid or not, can be seen by
comparing the corrected value of the total
correlation (r number). If r number is greater than r
table then the item of question is valid (accurate).
Table 2 Questionnaire Validity Test Output
No Statement r output test r table Explanation
1 DGT Regional South Jakarta II frequently establish data
feeding in the form of risk taxpayer list based on analysis
out
p
ut of BBM metho
d
0.740938 0.1771 Valid
2 AR always use the data from the analysis of BBM as a tool in
monitoring tax payer’s compliance/basic consideration in
conductin
g
cor
p
orate tax
p
a
y
er audit
0.68894 0.1771 Valid
3 You fully know and understand the use of the BBM method as
a tool in overseeing the compliance of the Corporate Taxpayer
0.23792 0.1771 Valid
4 You often get guidance, education and training related to the
use of data from the analysis of BBM as a tool in overseeing
the com
p
liance of the cor
p
orate tax
p
a
y
er.
0.57787 0.1771 Valid
5 Guidance books of BBM easil
y
learned and understood 0.70255 0.1771 Vali
d
6 Data feeding analysis from BBM method is easy to be applied
as a basis in conducting intensification of potential tax payer.
0.64119 0.1771 Valid
7 Working paper from BBM analysis really helps your task in
doing supervision of corporate tax payer’s compliance
0.58558 0.1771 Valid
8 Data according to the BBM Analysis is highly valid for
monitorin
g
cor
p
orate tax
p
a
y
er’s com
p
liance.
0.5829 0.1771 Valid
9
Data analysis from BBM Method is highly raw consideration if
used as a basis in detecting non-compliance of corporate tax
payer and required other data feeding in the form of concrete
data
0.68533 0.1771 Valid
10
Follow-up steps are needed in following up data analysis from
BBM method, among others, the action in the form of analysis
of monthly SPT and annual report SPT, financial statement
analysis, SP2DK issuance, visit, observation of taxpayer
b
usiness
p
rocess
0.52095 0.1771 Valid
11
Various menu of data feeding and information available on
DGT Portal Application and result of Analysis Center for Tax
Analysis (CTA) is very helpful in conducting surveillance non
tax
p
a
y
er’s com
p
liance
0.66628 0.1771 Valid
12
Sources of internal data in the form of concrete data (PK-PM
Confirmation, Approweb, Supervision Application/Mawas,
0.56824 0.1771 Valid
Analyis Benford’s Law Model as an Alternative for Benchmark Behavioral Model Method to Identify Tax Payer’s Compliance - Case Sudy:
DGT Regional South Jakarta II
375

No Statement r output test r table Explanation
DGT Apportal Data, Publisher Data/Fictitious Tax Invoice
User, SI DJP, etc.) are highly helpful in detecting non-
compliance’s corporate Taxpaye
r
13
External data sources (internet, field observations, mass media,
exhibitions etc.) are helpful in detecting non-compliance’s of
corporate taxpayers
0.23081 0.1771 Valid
14
DGT need to establish new method in detecting non-
compliance of corporate and personal tax payers which is easy
to be understood, applied and valid in detecting Taxpayer's
obedience
0.57342 0.1771 Valid
15
Do you agree if the "Benford's Law Model" method is used as
an alternative to the BBM method to detect non-compliance
with the Taxpayer?
0.54534 0.1771 Valid
Based on the calculation output using microsoft
office excel 2010 program (test result 2 (two)
direction with 5% significance level and degree of
freedom = 123-2 = 121, value r table = 0,1771)
hence output all of r questions bigger than r table so
that all items are valid statements to be applied in
this research.
5.2 Reliability Test
Reliability indicates the extent to which a
measurement result shows relatively consistent
results when re-examined twice or more. The
reliability test using alpha cronbach coefficient with
its calculation applying microsoft office excell 2010
formula. Based on the results of reliability testing
above, then obtained the value of 0.887, exceeding
the value of alpha cronbach of 0.6 so that all items
above statement are reliable.
5.3 Descriptive Statistic Analysis
Respondent’s responses to the statement items of the
distributed questionnaires to determine the
effectiveness of the use of of risky taxpayers list
based on the BBM method as a means to detect non-
compliance of Taxpayers are as follows:
Table 3 Respondent’s Summary Response
Respondent’s response to the questionnaires
distributed to the ARs above reinforces the proof of
the low level of realization of the nominative list
based on the BBM method used by AR as the basis
for the potential tax intensification activities which
leads to the realization of tax revenue. Based on the
No Statement Disagree and Highly Disagree Agree and Highly Agree Doubtful
1 Statement 1 17% 50% -
2 Statement 2 30% 10% -
3 Statement 3 24% 4% 4%
4 Statement 4 31% 6% -
5 Statement 5 27% 10% 3%
6 Statement 6 74% 26% -
7 Statement 7 72% 28% -
8 Statement 8 73% 27% -
9 Statement 9 5% 95% -
10 Statement 10 7% 93% -
11 Statement 11 4% 96% -
12 Statement 12 2% 98% -
13 Statement 13 16% 84% -
14 Statement 14 3% 97% -
15 Statement 15 5% 79% -
JCAE Symposium 2018 – Journal of Contemporary Accounting and Economics Symposium 2018 on Special Session for Indonesian Study
376

data above, it can be concluded that the use of risk
taxpayers data based on the BBM method is
ineffective for identifying non-compliance corporate
taxpayers.
5.4 Benford’s Law Model For
Monitoring Tax Payer’s
Compliance
In this section, Researcher will be analyzing
quantitative data to solve the second problem
formulation that is how to use Benford’s Law Model
as an alternative method of BBM as a tool for
identifying tax payer’s non compliance. Benford's
Law method is chosen because based on the
statement in point 14 and 15 questionnaires above,
the majority of respondents approved the use of new
method (Benford's Law Model) in overseeing
taxpayer’s compliance. The analysis is performed on
the data sourced from the SPT 1771 fiscal year 2015
which has been submitted by 17.951 corporate
taxpayers in 8 (eight) KPP within the Regional
Offices of DGT South Jakarta II.
The first data set to be analyzed according
Benford’s Law test derived from tax payers income
that has been reported on the Annual Income Tax
return of 1771 with the following criteria:
a. The data to be analyzed is a unified whole and
describes a similar phenomenon.
Data sourced from the corporate annual income
tax return 1771 constitutes a unified and
unbroken entity and informs all types of tax that
are the obligations of the Taxpayer.
b. Data is not within the maximum or minimum
range (between certain numbers).
In reporting the tax payable, there is no provision
for the Taxpayer that requires to report the
maximum limit and minimum income and
expenses that become components of the
compilers of financial statements.
c. Data is not a deliberately formed number or
symbolized number.
1771 annual tax return data of corporate tax is
the data of fulfillment of tax obligation which
has been done by taxpayer so that the value of
the figures is the number that occurs because of
the taxpayer's financial transaction (natural) and
does not form a certain order that intentionally
made (eg: Taxpayer Identification Number
NIK/Population Identification Number).
d. Data has a large size (amount of numbers more).
In order for Benford's Law to be used properly,
then the number of data must be large and
contain numbers whose number of digits is at
least four. In addition, the amount of data used
should consist of 1,000 records. If the data is less
than 300, Nigrini suggests that Benford's Law is
not used. The data used in this study is SPT data
that has been submitted by 17,951 corporate
taxpayers for fiscal year 2015.
e. Data belongs to an entity so that it can be
distinguished from others and data is not
duplicated.
Taxpayer data will be different each others and
there will be no duplication as it depends on the
value of business income and the costs reported
by the Taxpayer in accordance with the field of
their respective business.
f. Data if sorted from the smallest to the largest
value form a geometric series.
Based on the calculation using microsoft excell
2010 program, the figures derived from the
taxpayer income in SPT 1771 The numbers that
have been sorted from the smallest to the largest
do not form a geometry series, so the
requirements for this criterion are not met.
g. The Data has an average value (mean) greater
than middle value (median).
Based on the calculation using microsoft excel
2010 program, the median value is
2.487.297.550 and the mean is 18.398.346.641.
This means the mean value of the data is greater
than the median value.
h. Data has positive skewness.
Based on the calculation using microsoft excel
2010 program, the outcome skewness value of
34,564. This positive skewness value means the
data distribution is leaning to the right (positive).
According to the results of the analysis above,
the overall number criteria (data set) that must be
met to be analyzed by using Benford's Law have
been met, only one criterion that can not be met is
the sequence of data form a geometric series.
5.5 Primary Testing Based on Benford’s
Law Model
The first test is performed based on business income
post to calculate Mean Absolute Deviation (MAD)
and Chi Square (X²). According to these, shown
MAD value of 0,00179 which means that the general
pattern of business income data is close to
conformity with Benford's Law Model. The result of
X² calculation based on working papers in Microsoft
Excel 2010 of 7,4666 shows smaller number of Chi
tables of 15,5073 (DF = 8; α = 0.05) which means
this pattern is similar to Benford's Law Model (Ho
Analyis Benford’s Law Model as an Alternative for Benchmark Behavioral Model Method to Identify Tax Payer’s Compliance - Case Sudy:
DGT Regional South Jakarta II
377
accepted). Based on First-Digits Test (FD) is
obtained the following results:
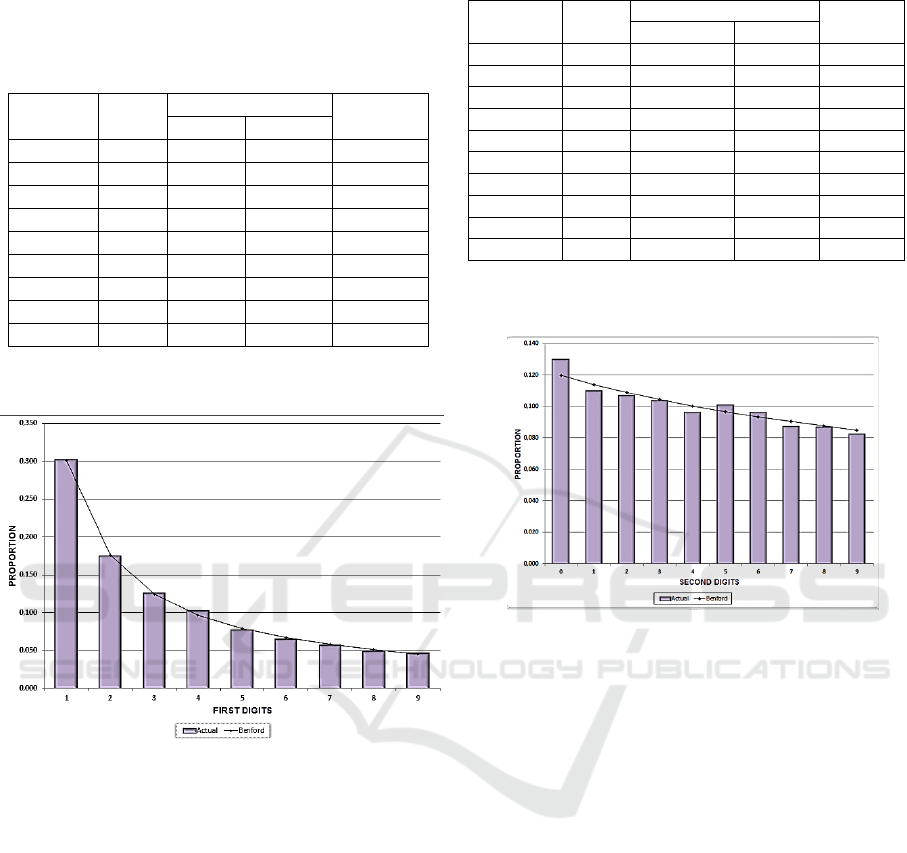
Table 4 Business Income First Digit Test
Number Sum Frekuensi Z
Actual Benford
1 3.383 0,302 0,301 0,182
2 1.959 0,175 0,176 0,346
3 1.413 0,126 0,125 0,351
4 1.144 0,102 0,097 1,834
5 867 0,077 0,079 0,695
6 726 0,065 0,067 0,900
7 637 0,057 0,058 0,501
8 555 0,050 0,051 0,761
9 523 0,047 0,046 0,437
The output of data calculations above when
shown in graphical form are as follows:
Figure 2 Chart of Business Income FD Test
Based on the output of the calculations in table 4
and figure 2 above, and the results of the z test with
α = 0,05 indicating no numbers above 1,96 (z >=
1,96 indicate anomaly) this means that for the first
digit test of business income in general, follow the
pattern on Benford's Law Model (there is no
anomaly on data of taxpayer income).
Based on the second steps of the MAD
calculation results obtained value of 0,00346, this
means that the pattern is generally close to
conformity with Benford's Law Model. Subsequent
testing with the method of calculating X² based on
working paper in Microsoft Excel 2010 obtained
value of 8,3367. This value is smaller than Chi table
of 16,91898 (DF = 9; α = 0,05) which means this
pattern is similar to Benford's Law Model (Ho
accepted) pattern. Based on the Second-Digits Test
(SD), are obtained the following results:
Table 5 Business Income Second Digit Test
Number Total Frekuensi Z
Actual Benford
0 1.455 0,130 0,120 3,296
1 1.231 0,110 0,114 1,334
2 1.195 0,107 0,109 0,729
3 1.160 0,104 0,104 0,270
4 1.080 0,096 0,100 1,373
5 1.129 0,101 0,097 1,439
6 1.081 0,096 0,093 1,107
7 980 0,087 0,090 1,056
8 974 0,087 0,088 0,230
9 922 0,082 0,085 1,019
The output of the data calculations above when
shown in graphical form are as follows:
Figure 3 Chart of Business Income Second Digit Test
Based on the calculation in table 5 and figure 3
above, obtained the results of the test z with α = 0,05
indicates there is a value that is above 1.96, the
taxpayer whose second digit of business income
contains the number 0. This is an alarm for AR
because it means that there are 1.455 potential
taxpayers who are not properly reporting the data of
their business income.
According to the third steps, the MAD
calculation results with a value of 0,00075, this
means that the pattern is acceptable conformity to
Benford's Law Model. Subsequent testing with the
method of calculating X² based on working paper in
Microsoft Excel 2010 obtained value of 88,06509.
This value is smaller than Chi table of 112,021 (DF
= 89; α = 0,05) which means this pattern is similar to
Benford's Law Model (Ho accepted) pattern. The
last test based on the First-Two Digits Test (F2D)
when presented in graphical form is as follows:
JCAE Symposium 2018 – Journal of Contemporary Accounting and Economics Symposium 2018 on Special Session for Indonesian Study
378
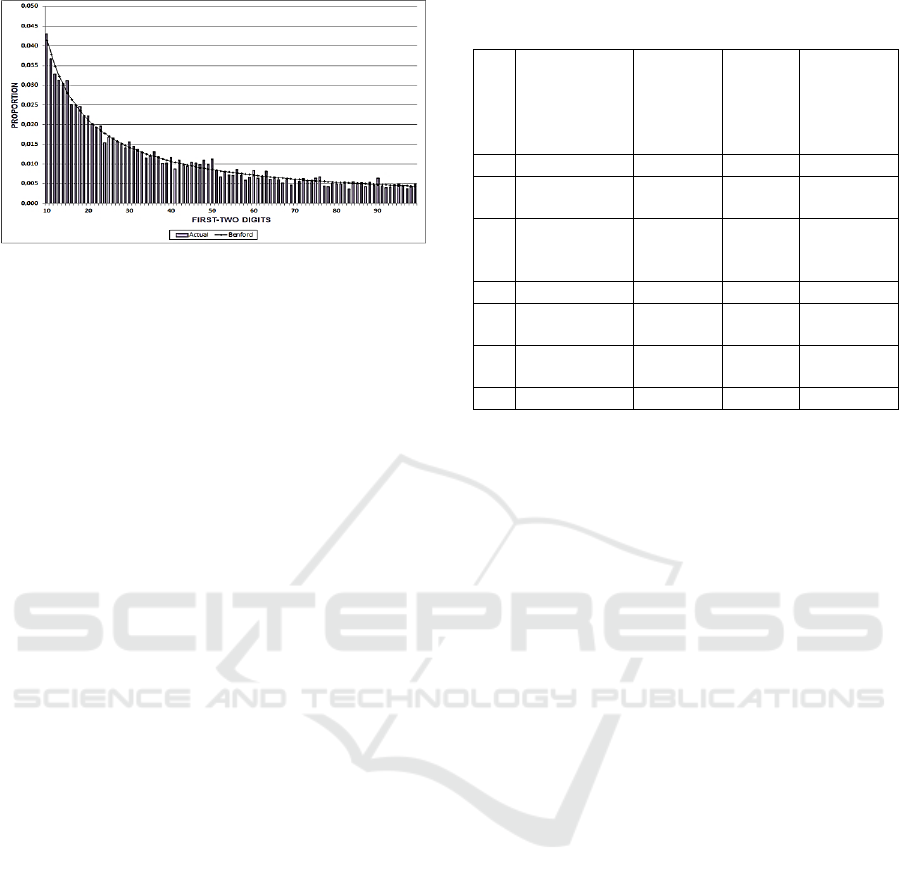
Figure 4 Chart of Business Income First Two Digit Test
Based on the calculation in the table and the
figure above, the results obtained by the z test with α
= 0,05 indicates there is a value that is above 1,96,
the taxpayer the first two digits of its business
income contained the number 15 as many as 349, the
first two digits of business income contains number
48 as many as 124 Taxpayers, the first two digits of
its business income contained the number 50 as
many as 127 Taxpayers, the first two digits of its
business income contained 69 as many as 53
Taxpayers, the first two digits of its business income
contained 83 as many as 42 Taxpayers, the first two
digits of business income contains the number 90 as
many as 72 Taxpayers. This is an alarm for AR
because it means there are totally 767 taxpayers
which are potentially incorrect in reporting their
business income data.
Based on the results of First-Digits Tests (FD)
tests, Second-Digits Tests (SD), First-Two Digits
Tests (F2D) that have been performed on the data of
tax payers business income, then obtained repeatedly
data for second digit taxpayers contains 0 and the
first two digits contain numbers 50 and 90
(Taxpayers who always appear during the third test
done) as many as 199 Taxpayers. 199 Taxpayers
who always appear in it test, indicated disobedient in
reporting its business income on the annual tax
return.
The similiar testing steps are also carried out on
the post cost of purchase/raw materials, salary costs,
transportation costs as well as rental expense and
obtained the output of potensial taxpayer who don’t
properly in fulfilling their tax obligations with the
following details:
Table 6 Summary of Non Compliance Tax Payers Based
on Benford’s Law Model
N
o
Pos SPT
Benford
’s Test
Result
Tax
Amnes
ty
Confir
mation
%
Validity
of
Benford’s
Test
1 2 3 4 =(3:2)
1
Busines
Income
199 142 71%
2
Purchase of
Raw
Material
81 55 68%
3 Salary Cost 98 74 75%
4
Transportati
on Cost
704 513 72%
5
Rent
Ex
p
ense
318 257 80%
Total 1.400 1.041 74%
According on the data in table 6 above, the next
step for this research is to compare the list of
taxpayers who indicated do not comply in fulfilling
their tax obligations with the list of taxpayers who
have followed the tax amnesty program based on
data at the DGT Regional South Jakarta II (Taxpayer
identity details can not be displayed because it is
included in the secret of office as stipulated in
Article 34 of the Law of KUP). Based on the
confirmation, it can be informed that 74% taxpayers
contained in the table above were also undertaking
the tax amnesty program in accordance with Law
Number 11 of 2016. This proves that Benford's Law
Model can be used to detect non-compliance of
Taxpayers in fulfilling their tax obligations.
Based on the process above, the implementation
of Benford’s Law Model has several advantages
compared with BBM method in detecting tax
payer’s non compliance for several reasons:
a. Understanding of taxpayer transaction which is
indicated disobedient with tax rules does not
require in-depth analysis and time consuming
than BBM method, so that AR can be more
focus in monitoring taxpayer’s compliance;
b. This method can be applied to detect non-
compliance for all criteria of various types from
Taxpayer’s Income (Taxpayers who have
certain gross business income, final and non
final categories of income), Individual and
Corporate Taxpayers;
c. Processing data can be done independently by
each KPP Pratama without having to wait for
feeding data and direction from Kanwil;
d. This method can be applied to detect non-
compliance for the newly registered tax payers.
Analyis Benford’s Law Model as an Alternative for Benchmark Behavioral Model Method to Identify Tax Payer’s Compliance - Case Sudy:
DGT Regional South Jakarta II
379

6 CONCLUSION,
RECOMMENDATION, AND
LIMITATIONS
6.1 Conclusion
According on the results of research that has been
done, the implementation of BBM method in
identifying the risk of non-compliance of registered
taxpayers at Small Tax Office in the DGT Regional
South Jakarta II do not run effectively and require a
new method for monitoring Tax Payer’s compliance.
This occurs because the nature of the BBM method
is limited to the initial indication of non-compliance
that requires further actions, the refutation of the
taxpayer on the results of the method of BBM when
confirmed to the taxpayer, the majority of AR has
not understood the technical implementation and
understanding related to the concept of method,
limited capacity and capability of AR in performing
its role and function in monitoring taxpayer’s
compliance.
As an alternative to the practice of BBM
methods that have proven to be ineffective in
conducting monitoring taxpayers compliance,
Researchers try to use new methods to identify non-
compliance by using Benford's Law Model. Based
on the testing stages conducted on the items in the
corporate annual income tax returns of 1771 which
includes the business income post, the cost of
purchasing materials/merchandise, the cost of salary,
the transportation cost, and the rent fee, the result is
the data of the indication taxpayer who potentially
do not correctly in fulfilling their tax obligations.
The data above then compared to the list of
taxpayers who have attended the tax amnesty in
accordance with Law Number 11 Year 2016. Based
on the comparison list, it can be informed that 74%
of taxpayers based on the data referred to also follow
the tax amnesty program. This finding corroborate
the evidence that the Benford's Law Model can be
used to detect non-compliance of Taxpayers in
fulfilling their tax obligations.
6.2 Recommendation
Based on the output of research that has been done,
several factors causing ineffective Benchmark
Behavioral Model method in identifying non tax
compliance among others is due to the inability of
AR in understanding the technical implementation
of the BBM method and limited AR authority as the
front guard in collecting state revenues. This limited
capacity of AR can be improved by conducting
various capacity building activities such as In House
Training, Workshop, Education and Training,
courses, and discussion forums to discuss the current
various of tax issues. The limitation of AR authority
in conducting the audit can be improved by issuing a
stronger legal stand in case of auditing process that
can be done by AR. In addition, the DGT should
also design new strategies and methods in
conducting compliance oversight of taxpayers. The
method should be easy to implement, the data is
valid in identifying taxpayer's obedience and can
adjust to various conditions of dynamics and
potential of taxpayer.
6.3 Research Limitations
This study has limitations in terms of data collection
and research results that have been done where the
source data derived from the elements of corporate
annual income tax 1771 is processed with the
assumption that the values listed the same as listed
on the physical financial statements of Taxpayers. In
addition, this research is done by taking the object
on KPP Pratama at DGT Regional South Jakarta II.
Each region has characteristics and potentials that
vary from one to others, so the results of research
with the same topics and methods can generate
output that are different from this research.
REFERENCES
Arkan, M. M. (2010). Analisis Penggunaan Benford’S
Law Dalam Perencanaan Audit Pada Direktorat
Jenderal Bea dan Cukai. Simposium Nasional
Akuntansi XIII
Damayanti, Theresia Toro. (2012). ―Changes on
Indonesia Tax Culture, Is There A Way? Studies
Through Theory of Planned Behavior. Journal of Arts,
Science and Commerce. Vol. III, Issue 4(1).
Direktorat Jenderal Pajak. (2015). Surat Edaran Direktur
Jenderal Pajak Nomor 39/PJ/2015 tentang Pengawasan
Wajib Pajak Dalam Bentuk Permintaan Penjelasan
Atas Data dan/atau Keterangan, dan Kunjungan (Visit)
Kepada Wajib Pajak
Direktorat Jenderal Pajak. (2015). Surat Edaran Direktur
Jenderal Pajak Nomor 27/PJ/2015 tentang
Pemeriksaan Oleh Petugas Pemeriksa Pajak.
Direktorat Jenderal Pajak. (2016). Surat Edaran Direktur
Jenderal Pajak Nomor 02/PJ/2016 tentang Pembuatan
Benchmark Behavioral Model dan Tindak Lanjutnya.
Direktorat Jenderal Pajak. (2016). Surat Edaran Direktur
Jenderal Pajak Nomor 06/PJ/2016 tentang Kebijakan
Pemeriksaan.
JCAE Symposium 2018 – Journal of Contemporary Accounting and Economics Symposium 2018 on Special Session for Indonesian Study
380

Drake, P. D., & Nigrini, M. J. (2000). Computer assisted
analytical procedures. Journal of accounting
education
Durtschi, C., Hillison, W., & Pacini, C. (2004). The
Effective Use of Benford's Law to Assist in Detecting
Fraud in Accounting Data. Journal of Forensic
Accounting Vol. V, 17-34.
Fitri, Hutamol., Setyadi, Bakti., & Hardiyansyah. (2016).
Pemanfaatan Benchmarking Dalam Menilai
Kewajaran Penghitungan PPh Terutang Wajib Pajak
(Studi Kasus pada KPP Pratama Palembang Seberang
Ulu). Universitas Bina Darma, Palembang.
Iqbal, Muhammad., dan Santoso, Iman. (2015). Analisis
Penerapan Benchmark Behavioral Model dalam
Pemeriksaan Pajak. Skripsi. Universitas Indonesia.
Menteri Keuangan Republik Indonesia. (2015). Peraturan
Menteri Keuangan Nomor 79/PMK.01/2015 tentang
Account Representative pada kantor Pelayanan Pajak.
Nurmantu, Safri. (2005). Pengantar Perpajakan.
Jakarta:Granit
Nigrini, M. J. (2012). Benford’S Law: Applications For
Forensic Accounting, Auditing, And Fraud Detection .
New Jersey: Wiley
Pemerintah Indonesia. (2008). Undang-Undang Nomor 7
Tahun 1983 tetang Pajak Penghasilan sebagaimana
telah beberapa kali diubah terakhir dengan Undang-
Undang Nomor 36 tahun 2008.
Pemerintah Indonesia. (2009). Undang-Undang Nomor 6
Tahun 1983 tentang tentang Ketentuan Umum dan
Tata Cara Perpajakan sebagaimana telah diubah
terakhir dengan Undang-Undang Nomor 16 Tahun
2009.
Pemerintah Indonesia. (2016). Undang-Undang Nomor 11
Tahun 2016 tetang Pengampunan Pajak.
Prasetyo, K. A., & Sinaga, S. T. (2014). Aplikasi Benford
Law Untuk Mengidentifikasi Ketidakpatuhan SPT
Wajib Pajak. Kajian Akademis BPPK.
Analyis Benford’s Law Model as an Alternative for Benchmark Behavioral Model Method to Identify Tax Payer’s Compliance - Case Sudy:
DGT Regional South Jakarta II
381
