
Research on Energy Saving
R
outing Algorithm of Cluster Wireless
Sensor Networks
Jinglei Zhang
1
, Qing Liu
2
and Yong Wang
3
1
Nanjing Institute of Industry Technology, Nanjing, China
2
ZhongShan Vocational College, Nanjing, GHINA
3
Nanjing University of Posts and Communications, Nanjing, China
njwy1961@163.com
Keywords: Wireless sensor networks (WSN), cluster routing algorithm, network lifetime, energy efficiency, LEACH.
Abstract: Based on the analysis of LEACH protocol, this paper proposes an improved algorithm: taking into account
the two factors of node energy and distance, we improve the probability of cluster head selection. The
probability formula of the cluster head selection of the original protocol is modified by using the weighting
factor. According to the improved algorithm proposed in this paper, simulation experiments are carried out
respectively upon different adjustment parameters selected. The results show that the improved algorithm
can avoid the existence of extremely large and small clusters compared with the LEACH protocol, which
will balance the energy consumption of network nodes, reduce the network energy consumption, improve
energy efficiency and extend the network’s life cycle.
1 INTRODUCTION
At present, many clustering algorithms are based on
Low Energy Adaptive Clustering Hierarchy
(LEACH) (Deepshikha, 2017) routing protocol.
These routing protocols focuse on different
optimization targets according to different
application requirements. They have their own
advantages and disadvantages according to their
different performance in energy efficiency, data
fusion and network scalability. Clustering routing
algorithm has obvious advantages in reducing
energy consumption and prolonging network
lifetime. Therefore, the improvement research on
clustering-based low energy routing protocol has
become a hot and developing trend in this field.
Energy-efficient routing algorithm based on
clustering of WSN has obvious advantages on
reducing energy consumption and prolonging
network lifetime. This is the focus of this paper.
2 ENERGY CONSUMPTION
ANALYSIS
Energy consumption of network nodes is one of the
most important issues in WSN. The network nodes
are composed of four modules, sensing, processing,
wireless communication and energy supply. Energy
consumption comes from the first three modules.
The energy consumption of each component of
the sensor node is as shown in Fig. 1.
Fig.1 Energy consumption distribution of each component
3 ANALYSIS OF DEFECTS OF
LEACH ALGORITHM
The traditional LEACH protocol is easy to
implement and has strong addictiveness.. Each node
in the run time takes turns as the cluster head,
492
Zhang, J., Liu, Q. and Wang, Y.
Research on Energy Saving Routing Algorithm of Cluster Wireless Sensor Networks.
In 3rd International Conference on Electromechanical Control Technology and Transportation (ICECTT 2018), pages 492-497
ISBN: 978-989-758-312-4
Copyright © 2018 by SCITEPRESS – Science and Technology Publications, Lda. All rights reserved

averaging the energy consumption of the entire
network. Compared with the surface routing
protocol, it has a longer network lifetime. Through
the simulation analysis of the LEACH protocol, we
find some shortcomings of the LEACH protocol.
(1) In the selection of cluster heads, the LEACH
protocol cannot produce a fixed number of cluster
heads in each round because of the uncertainty of the
random number produced by the node itself. The
instability of cluster number will lead to the situation
that some network rounds may generate more cluster
heads while the other rounds may produce less
cluster head. When the number of cluster heads is
very small, the cluster member nodes in the network
are usually more. Cluster heads require more time
and energy to deal with data processing, which
eventually leads to a sharp energy drop of cluster
heads. If there are a large number of cluster heads,
there are few member nodes within clusters or even
there are cluster head nodes left in clusters. As the
cluster head conducts direct communication with the
base station, too many nodes’ long-distance
communication with the base station will lead to the
increase of the energy consumption of the whole
network.
(2) The number of nodes in each round of cluster
is greatly different. Some clusters are very large with
more node members. Some clusters have few or
even no member nodes. In this way, it is very easy to
cause the load imbalance of the whole network. In
the end, this situation will cause some nodes to die
because of the premature exhaustion of energy.
(3) The location of the cluster head nodes is
unevenly distributed. Some cluster heads are too
concentrated or adjacent, while some cluster heads
are distributed on the edge of the entire network
area. In this way, the member nodes in some clusters
have to communicate with the cluster heads through
long distance transmission, resulting in a large
amount of energy consumption.
(4) With the operation of the network, some
nodes may have undertaken too many tasks in
advance and have little residual energy. Some other
nodes may have more residual energy due to the
opposite situation. If we do not consider the residual
energy of nodes, and when the residual energy of
nodes in the later stage is generally low, we will
unfortunately choose the nodes with extremely low
energy in the cluster head selection. They will not be
able to undertake the related tasks and lead to the
failure of communication.
4 IMPROVEMENT SCHEME
AND ANALYSIS
This paper optimizes the algorithm based on the
shortcomings of the LEACH protocol. A series of
improvements are proposed. The simulation and
analysis are carried out according to the improved
scheme.
4.1 Evaluation standard of network
energy consumption performance
In order to compare the improved protocol with the
original LEACH protocol, we need to propose an
evaluation criterion for measuring the performance
of the network. In the evaluation criteria of energy
consumption of sensor networks, the two common
indicators refer to the network life cycle and the total
energy consumption per round of network.
4.1.1 The network lifetime
As an important evaluation index, the network
lifetime cycle is now widely used to measure the
performance of a WSN.
The most widely defined definition: the network
lifetime is defined as the time from network starting
to work, to the death of the first node in the network,
or to the energy exhaustion of any node in the
network.
The network lifetime is in fact closely related to
the number of surviving nodes in the network.
During the simulation test, we will use the number
of remaining surviving nodes in each round of
network or the percentage of remaining surviving
nodes in each round network as a more objective
criterion.
4.1.2 Total energy consumption per round
The total energy consumption of every node in every
network per round or the total residual energy of
every node in the whole network per round can also
be used as an index to measure the energy
consumption of the whole network and to illustrate
the setup of sensor network. In the comparison of
the simulation experiments in this paper, we will
measure the residual total energy of all nodes in the
whole network per round.
S
Research on Energy Saving Routing Algorithm of Cluster Wireless Sensor Networks
493

4.2 LEACH Protocol Improvement
Scheme
In this section, we will propose some improved
algorithms for some of the defects. The main
purpose is to improve the threshold T(n) of the
cluster head election to reduce the energy
consumption of the network and improve the
network performance.
The improved algorithm also takes the round as
the smallest cycle unit. Each round is divided into
the initialization stage established by the cluster
group and the stable work stage for data
transmission. Among them, the cluster establishment
stage includes the election of cluster heads and the
formation of clusters. The stable transmission phase
of data mainly completes the two tasks of node
routing and data forwarding between nodes.
4.2.1 Improved scheme based on residual
energy and distance
One of the shortcomings of the LEACH protocol: in
the process of network operation, the residual energy
of each node fails to be considered. When the next
round of cluster heads is re-selected, the distribution
of energy consumption in the network is uneven,
leading to the premature death of some nodes. Now
we bring the residual energy into the scope of the
cluster head election, and improve the original
protocol.
The cluster head nodes selected randomly are
usually not well distributed because of the location
distribution. Some are too concentrated. Some are
too scattered or even on the edge of the network
area. There are often more clusters where the cluster
heads are too concentrated. A large number of
cluster heads and remote base stations will consume
a lot of energy when communicating, and the cluster
heads distributed at the edge of the network will
consume a lot of energy because of the long-distance
transmission with the remote member nodes.
We add the distance D(n) to all nodes in the
regional centre as a measure. The basic goal of the
scheme is to maximize the coverage area of the
selected cluster heads as far as possible. The
probability of reducing the cluster head
marginalization is reduced. Let the cluster head
close to the centre of the whole region to shorten the
data transmission distance (Takhellambam S. S.,
2016).
The calculation of the center of mass in the
region surrounded by clusters: for simplicity, we
will use the arithmetic mean of all node coordinates
within the cluster to replace the centroid location.
The following is the centroid formula, and D (X
d
,
Y
d
) is the centroid position:
1
1
()
(, )
()
N
i
dd
N
i
X
i
N
DX Y
Yi
N
=
=
⎧
⎪
⎪
⎪
=
⎨
⎪
⎪
⎪
⎩
∑
∑
(1)
In formula (1), (X (i), Y (i)) is the coordinate
position of the internal nodes of the cluster, and N is
the number of all the nodes within the cluster.
Considering the influence of two factors on the
threshold T(n), such as the residual energy of nodes
and the distance from nodes to centers, an
optimization scheme based on residual energy and
distance factors is proposed.
The calculation formula of the cluster head
threshold T (n) of the optimization scheme is:
m
m
(,) ()
; ( )
1
()
1(*d )
()
0 ;
⎧
⎛⎞
−
⋅⋅ ∈
⎪
⎜⎟
⎪
⎝⎠
−×
=
⎨
⎪
⎪
⎩
r
ii
i
Enr d dnp
qt ifnG
En d
prmo
Tn
p
otherwise
(2)
In the formula (2), p is the percentage of cluster
heads in the expected network. R is the number of
the current running rounds, and n is the number used
to identify nodes in the network. The meaning of G
is LEACH, which does not act as a set of cluster
head nodes in the past
1 p
rounds.
Er(n, r) represents the residual energy of node n
in the current r round. Ei(n) represents the initial
energy of node n when the network starts running. qi
is an energy-related regulation parameter, which is
used to regulate the influence of the node energy
consumption factor on the threshold T(n).
The two parameters of Er and Ei are the internal
information of the node itself. It is maintained by the
node itself and does not need to communicate with
other nodes. Through adjusting the threshold T(n) by
Er Ei
, the nodes with large energy consumption
ratio can reduce their probability of becoming
cluster heads by decreasing the value of T(n). On the
contrary, for smaller nodes whose energy
consumption is smaller, the probability of cluster
head will be increased by increasing the value of
T(n).
Dm represents the maximum distance between
all nodes in the network to the center of the network
area. D(n) represents the distance from a node n to
the regional center in the network. Ti is a distance
dependent regulation factor, which is used to
regulate the proportion of distance factor in the
cluster head threshold T(n) calculation.
ICECTT 2018 - 3rd International Conference on Electromechanical Control Technology and Transportation
494

We use
()
()−dm d n dm
to adjust the threshold
T(n). The probability of a node at the edge of a
cluster to become a cluster head is reduced, and the
probability of raising the node in the cluster's
endoplasmic reticulum becomes the cluster head.
Through the adjustment of probability, the covering
area is maximized and the cluster head is
marginalized as much as possible when the cluster
head is selected, so the cluster head is closer to the
center of the region.
w
i
= q
i
* t
i
, formula (2) can be reexpressed as:
m
m
(,) ()
; ( )
1
()
1( mod )
()
0 ;
⎧
⎛⎞
−
⋅⋅ ∈
⎪
⎜⎟
⎪
⎝⎠
−×
=
⎨
⎪
⎪
⎩
r
i
i
Enr d dn
p
wifnG
En d
pr
Tn
p
otherwise
(3)
In formula (3), q
i
is a parameter of energy
regulation and ti is a range adjustment parameter. By
changing the values of these two parameters, the
proportion of the energy factor and the distance
factor in the cluster head threshold T(n) can be
dynamically adjusted.
Here, w
i
is a synthetic parameter. It weighs the
influence of the proportion of energy and the
specific gravity of the distance on the T(n) of the
cluster head threshold. A suitable w
i
value can make
the network performance to the best state.
4.3 Simulation analysis
4.3.1 Simulation test scene and parameter
setting
In order to compare the experiment results of the
improved scheme and the traditional LEACH
protocol, we adopted the same network model
assumption as LEACH protocol, wireless
communication model between nodes, data fusion
model and so on(Heinzelman W. B., 2002; Say S.,
2014). Among them, the formula of energy is still
used in the first order radio model in the LEACH
protocol.
It is assumed that 225 nodes in the network are
randomly distributed in the area of 150m*150m, and
all nodes have the same initial energy. The network
simulation parameters are shown in table 1.
Table1 network simulation parameters
Network covera
g
e area 150m×150m
Total number of nodes N 225
Base station coordinates (located in
the center of the network)
(75m
,75m)
Ex
p
ected cluster head
p
ercenta
g
e P 0.1
Parameter
f
s
ε
10pJ/bit/m
2
Parameter
amp
ε
0.0013pJ/bit/m
4
Energy consumption for receiving
and receiving E
elec
50nJ/bit
Cluster head data fusion energy
consumption E
DA
5nJ/bit/signal
Packet size L 400byte
Node initialization energy E0 1.5J
4.3.2 Simulation and analysis
For the improved scheme of considering the energy
factor and the distance factor in the calculation of
the cluster head threshold, the simulation experiment
is carried out by using the formula (3). The
experimental results are analysed from two aspects
of the total residual energy of the network and the
number of survival nodes.
a. Comparison of total residual energy of
network
In Figure 4.10, the blue solid line reflects the
relationship between the energy of the LEACH
protocol and the number of running rounds. The red
point line indicates the relationship between the
energy of the improved scheme and the number of
running rounds. The black dotted line at the top of
the graph represents the total energy of the entire
network node that is initialized at the time of
initialization.
As you can see in Figure 2, the improved scheme
has obvious advantages over the LEACH protocol in
terms of energy consumption. For example, it can be
obtained from the data that the improved scheme
postpones the Δr=2507 round in comparison with
the LEACH protocol under the same energy
consumption of only 10% of the remaining energy.
From figure 2, it is obvious that the red dot is on the
right side of the solid blue line. The red point line
drops slower than the blue line. It shows that the
energy consumption per round of the improved
scheme is less than LEACH.
Research on Energy Saving Routing Algorithm of Cluster Wireless Sensor Networks
495
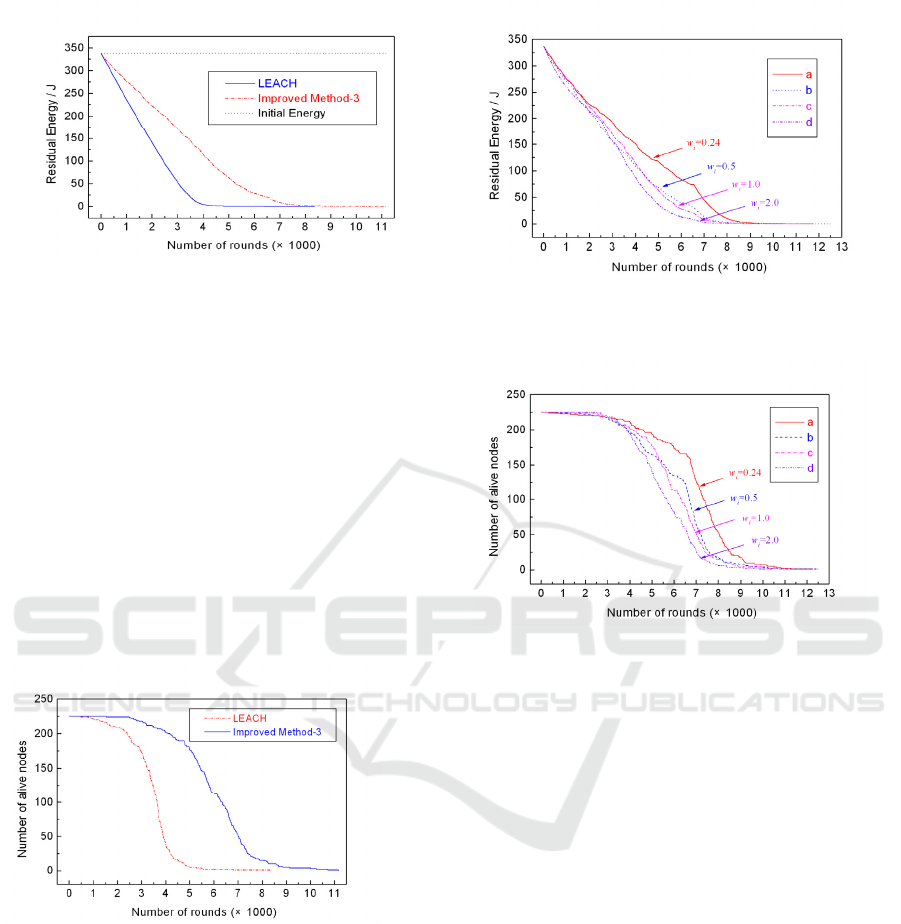
Fig. 2 Network running round number
b. Comparison of the number of surviving nodes
Fig. 3 can be seen that the improvement scheme
for the LEACH protocol has obvious superiority in
the network lifetime. The number of death rounds of
the first node, the improved scheme increases the
delta r=1054 round than the LEACH, and the
number of all nodes of the network nodes is
increased by the Δr=2790 round. From fig. 3 can be
seen, the improved scheme of LEACH protocol in
solid blue red dotted right, that improved scheme
prolongs the network life cycle.
Through the analysis, it is not difficult to draw
the conclusion that the improved scheme has lower
energy consumption and longer network lifetime
than the LEACH protocol.
Fig.3 Comparison of network life cycle
c. Influence of adjustment parameter w
i
The influence of the parameter w
i
on the total
energy consumption of the network: in Fig. 4, it can
be seen that the smaller the w
i
value, the lower the
total energy consumption of the network. At
w
i
=0.24, the energy consumption is the lowest;
when w
i
=2.0, the energy consumption is the largest.
Fig.4 Relationship between the residual energy and
rounds r
Fig.5 The relationship between the network surviving
node and the number of r
From fig. 5, we can see that when w
i
=2.0, the
number of the first dead node in the network is the
largest, the number of r=2540 rounds is the largest.
When w
i
=0.5, the number of death nodes of all
nodes in the network is the largest, which is r=12491
round.
If the number of running cycles of only 10% (or
death 90%) nodes is defined, the parameter w
i
=0.24
in the improved scheme has a longer network
lifetime.
5 Conclusions
According to the improved algorithm proposed in
this paper, different parameters w
i
(t
i
and q
i
) are
chosen to go through simulation experiment
respectively. The simulation results show that the
improved algorithm can avoid the existence of a
extremely large and clusters compared with the
LEACH protocol and it can also better balance the
energy consumption of nodes in the network, reduce
ICECTT 2018 - 3rd International Conference on Electromechanical Control Technology and Transportation
496

energy consumption, improve energy efficiency, and
prolong the network life cycle.
ACKNOWLEDGEMENTS
Project Supported by Top-notch Academic Programs
Project of Jiangsu Higher Education Institutions
(PPZY2015A087)
REFERENCES
Deepshikha; Priyanka Arora, 2017, Enhanced NN based
RZ leach using hybrid ACO/PSO based routing for
WSNs.
8
th
International Conference on Computing,
Communication and Networking Technologies
(ICCCNT)
Sepideh P, 2017, Optimal Routing for Lifetime
Maximization of Wireless-Sensor Networks With a
Mobile Source Node.
IEEE Transactions on Control
of Network Systems Volume: 4, Issue: 4
Takhellambam S. S.,2016. Distance Based Multi Single
Hop Low Energy AdaptiveClustering Hierarchy (MS
LEACH) Routing Protocol in Wireless Sensor
Network.
IEEE 6th International Conference on
Advanced Computing (IACC)
Hiren P, 2016
, A review on energy consumption and
conservation techniques for sensor node in WSN,
International Conference on Signal Processing,
Communication, Power and Embedded System
(SCOPES)
Heinzelman W. B., Chandrakasan A. P., Balakrishnan H.
2002,
An application-specific protocol architecture for
wireless micro sensor networks.
IEEE Transactions on
Wireless Communications, 1(4):660-670.
Say S., Kento A., 2014, Effective data gathering and
energy efficient communication protocol in Wireless
Sensor Networks employing UAV.
2014 IEEE
Wireless Communications and Networking Conference
(WCNC). Pages: 2342-2347
Research on Energy Saving Routing Algorithm of Cluster Wireless Sensor Networks
497
