
Developing Personas based on Physiological Measures
Vanessa Georges, François Courtemanche, Marc Fredette, Pierre-Majorique Léger
and Sylvain Sénécal
Tech3Lab, HEC Montréal, Montréal, Canada
Keywords: User Experience, Physiological Measures, Interaction Design, Personas.
Abstract: The objective of this paper is to propose a novel approach for the creation of user personas using common
patterns in psychophysiological signals. We illustrate the persona creation process through a case example.
Using this method, we were able to identify 4 distinct subgroups of varying experience and satisfaction levels.
This novel approach illustrates the potential of physiological measures in the identification of various user
clusters, based on one or more experiential aspect, as these signals can provide information as to what users
are experiencing during the interaction without interference. This should be useful for user experience
researchers, practitioners and designers alike to build more accurate user profiles, especially in the context of
large scale public installations and immersive experiences.
1 INTRODUCTION
In the context of design and user experience (UX)
practice and research, personas represent a group of
target users which share common behaviours, goals,
wants, needs, and frustrations when using a product
(Cooper, 1999).
However, according to McGinn et al., a common
issue with the development of personas is that they
are often not based directly on user data (McGinn and
Kotamraju, 2008). Expanding on this idea, Tu et al.
state that self-reported data from surveys, interviews
and user observation are not only disconnected from
user behaviour, but also weakly reflect users actual
use of a product (Tu et al., 2010).
To meet these challenges, researchers have
concentrated their efforts on finding new ways to
create personas based directly on user data. For
example, Zhang et al., have attempted to create
personas based on user behavior using clickstreams.
Others, like Tu et al. have tried to create data driven
personas using a multi-method approach, with both
qualitative data (i.e. observation and interview) and
quantitative data (i.e. cluster analysis) (Tu et al.,
2010). In the context of immersive interaction
environment, Loke et al. have proposed movement-
oriented personas and scenarios for representing
multiple users (Loke et al., 2005).
Adding to this body of work, our research
objective is therefore to propose a novel approach for
the creation of user personas that focuses on the
experiential dimension of human-computer
interaction (HCI), as we believe that the addition of
physiological measures in persona creation could
help improve on some of the well-documented
problems with persona use in HCI and UX design
practice. This should be particularly useful in the
context of interactive and immersive environments,
or any other circumstances where it may be difficult
to accurately observe and assess user experience.
An experiment was conducted to provide an
illustration of the potential of this novel method.
2 METHOD
Creating personas which reflect the unpredictable
changes in users can be challenging (Zhang et al.,
2016). To do so, we propose a novel approach: using
physiological measures in the development of user
personas. The proposed approach is based on the
analysis of users’ physiological signals, recorded
during their interaction. Our aim was to answer the
following question: is it possible to identify
subgroups of individuals with similar
psychophysiological states over time? In other words,
are we able distinguish groups of individuals with
similar emotional responses, experienced during the
same period of time, in a given experience?
Georges, V., Courtemanche, F., Fredette, M., Léger, P-M. and Sénécal, S.
Developing Personas based on Physiological Measures.
DOI: 10.5220/0006963201310136
In Proceedings of the 5th International Conference on Physiological Computing Systems (PhyCS 2018), pages 131-136
ISBN: 978-989-758-329-2
Copyright © 2018 by SCITEPRESS – Science and Technology Publications, Lda. All rights reserved
131
Physiological signals, such as electrodermal
activity, is indicative of emotional response and was
selected to provide valuable insights as to what users
are experiencing during the interaction, without
interference (Roto et al., 2009). To account for the
longitudinal (i.e. temporal) aspect of the experiment,
a curve clustering approach (Abraham et al., 2003)
was used to establish the existence of several
configurations of psychophysiological experiences.
Although Cugliari et al. used the technique to
identifying super consumers based on electricity
consumption, the curve classification approach has
never been used to our knowledge in the context of
psychophysiological data (Cugliari et al., 2015). An
experiment was conducted to provide an illustration
of the potential of this novel method.
2.1 Experimental Validation
An in-situ data collection was conducted to identify
and develop various user personas based personas
common patterns in psychophysiological signals
using curve clustering. The goal of the experiment
was to gather a large physiological data set
representative of different user experiences to assess
the accuracy of the proposed method.
2.1.1 Setting
The experience consisted of an interactive
multimedia installation in the forest, developed by a
company specialized in the creation of large scale
interactive experiences.
The location of the data collection was selected
among the installations already in operation and open
to the public. This gave us the opportunity to work
with an interesting physiological dataset without
having to build the interactive environment ourselves,
and to have access to a large and diverse population.
Figure 1: An image of the illuminated nocturnal trail.
The experience, which consisted of a one hour
walk, occurred entirely outdoors, in a forest in North
America, on a levelled dirt trail. The trail included
hills of moderate slopes. Access to 1.5-km
illuminated multisensory nocturnal trail (see figure 1,
2 and 3) was done via a chairlift. The trail weaves its
way down the hill through the woods, crosses streams
and clearings.
Figure 2: An image of the illuminated nocturnal trail.
Visitors also wore an interactive amulet which
changed color as they progressed through the trail.
Ambient sounds and an original soundtrack also
served to enhance visitors’ experience. Participants
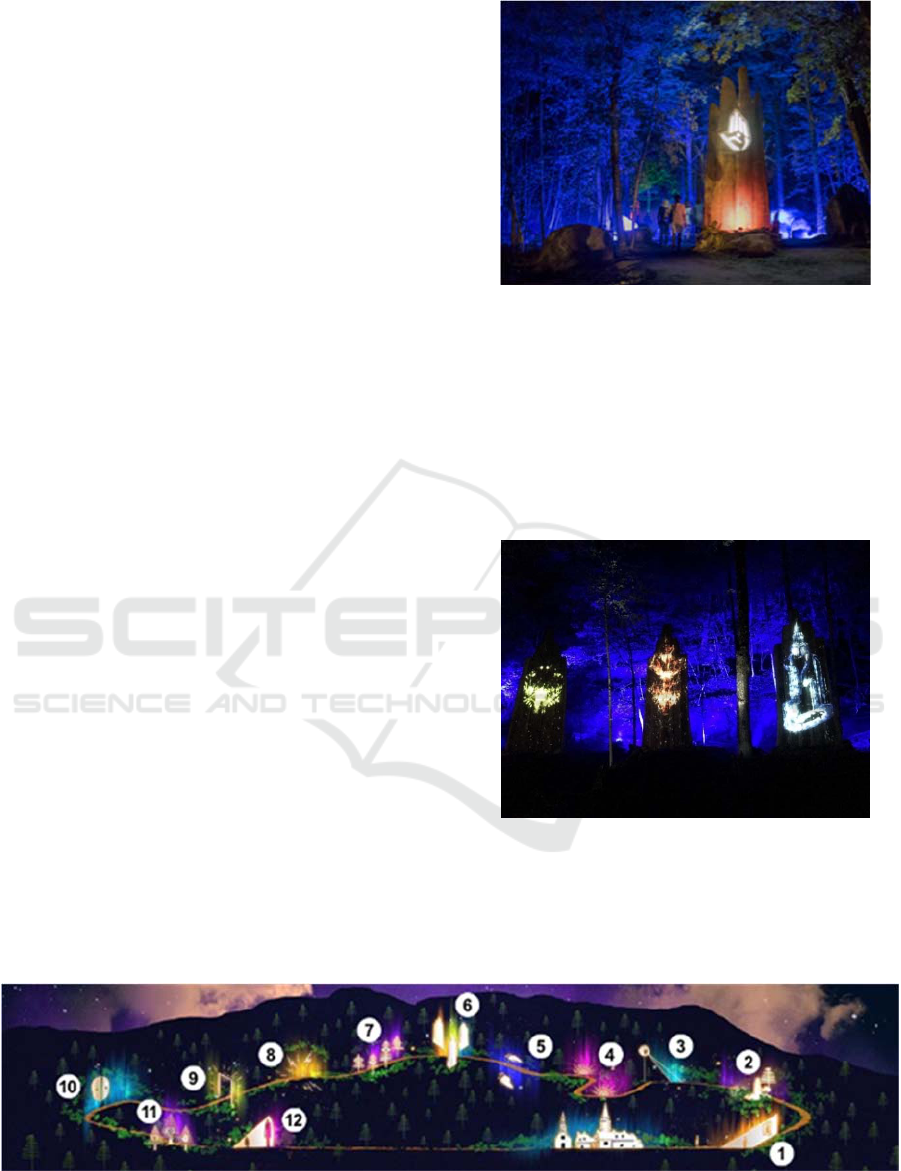
Figure 3: The figure above shows an overview of the experience. Participants were fitted at the base camp located at the base
of the chairlift (zone 1). Zones 1, 4, 5, 6, 7, 10 and 11 were contemplative; zones 2, 3 and 9 were immersive; zone 8 was
interactive and zone 12 was participative.
PhyCS 2018 - 5th International Conference on Physiological Computing Systems
132

were on the pathway an average of one hour, with a
maximum of 300 people admitted onto the course
every half-hour. Data was collected during the two
last weekends of September and the first weekend of
October. After completion of the experiment,
participants returned to base camp to remove the
physiological sensors and complete the post-
experiment questionnaire.
Figure 3 shows the configuration of the trail and
its various zones, including: three immersive zones,
seven contemplative zones, one interactive and one
participative zones.
2.1.2 Participants
For this experiment, a total of 36 participants, which
included 22 females, between the ages of 14 and 65
were recruited on site. Due to the considerable
difficulty of physiological data collection in natural
settings, data from 26 participants had to be discarded
from the analyses. Most data loss was due to signal
artefact and manipulation errors. Physiological data
from 10 participants were used from which 7 were
female. Participants were pre-screened for
neurological and psychiatric diagnoses. Data from all
36 participants were used in the questionnaire
analyses and curve clustering; data from 9
participants were rejected due to missing values (see
Section 2.2).
The total experiment duration was of one and a
half hours, which included the installation and
removal of the sensors, and beginning and end
questionnaires. A compensation corresponding to the
ticket price (i.e. 31.96 CAD) was given to each
participant upon completion of the experiment.
2.1.3 Physiological Signals and Equipment
A Bitalino (r)evolution Freestyle Kit BT (Lisbon,
Portugal) was used to record participants’
electrodermal activity (EDA). EDA was recorded
using two electrodes placed on the palm of the non-
dominant hand (see figure 4). An accelerometer was
also used to record motion.
EDA measures the activity of the eccrine sweat
glands and has been shown to be correlated to arousal.
It can also be used to measure emotions (Boucsein,
2012) during system interactions (figure 4). Valence
is used to contrast states of pleasure (e.g., happy) and
displeasure (e.g., angry), and arousal to contrast states
of low arousal (e.g., calm) and high arousal (e.g.,
surprise). The sensor enclosure box was placed on
participants’ left arm and secured with an exercise
band. EDA was recorded with a sampling rate of
100Hz.
Figure 4: The amulets and physiological sensors.
EDA was
recorded using two electrodes placed on the palm of the
non-dominant hand.
2.1.4 Self-reported Data and Questionnaires
In addition to socio-demographic questions, a 9-point
SAM scale was used to measure self-reported arousal
and valence of participants before and after the
experience. Questions on customer expectations and
prior immersive experiences were also included in the
questionnaire.
Customer satisfaction was assessed in two
different ways. Participants were asked to report their
own satisfaction regarding their overall experience. A
satisfaction score was also calculated using the ACSI
score, the American Consumer Satisfaction Index
(Fornell et al., 1996).
2.2 Preliminary Findings and Results
Physiological data from 10 participants were used for
the curve clustering. Clustering was done using the
galvanic skin response (GSR) based on the number of
peaks per minute in each station, which better
illustrates the psychophysiological and emotional
responses (Garrett, 2010) of participants, as opposed
to EDA means. Values were standardized at
participant level.
Using this method, we were able to distinguish 4
groups of participants who experienced similar levels
of arousal during the same station. Figure 5 illustrates
variation of the GSR means of the 4 clusters
throughout the 12 stations.
In the context of this experiment, Cluster 1
appears to describe people who are engaged at the
start of the experience, but whose interest
significantly drops off towards the end. On the other
hand, cluster 2 seems to feature participants who start
and end the experience on high notes, but experience
little activation throughout. Cluster 3 seems to
experience a more gradual drop in engagement. As
Developing Personas based on Physiological Measures
133
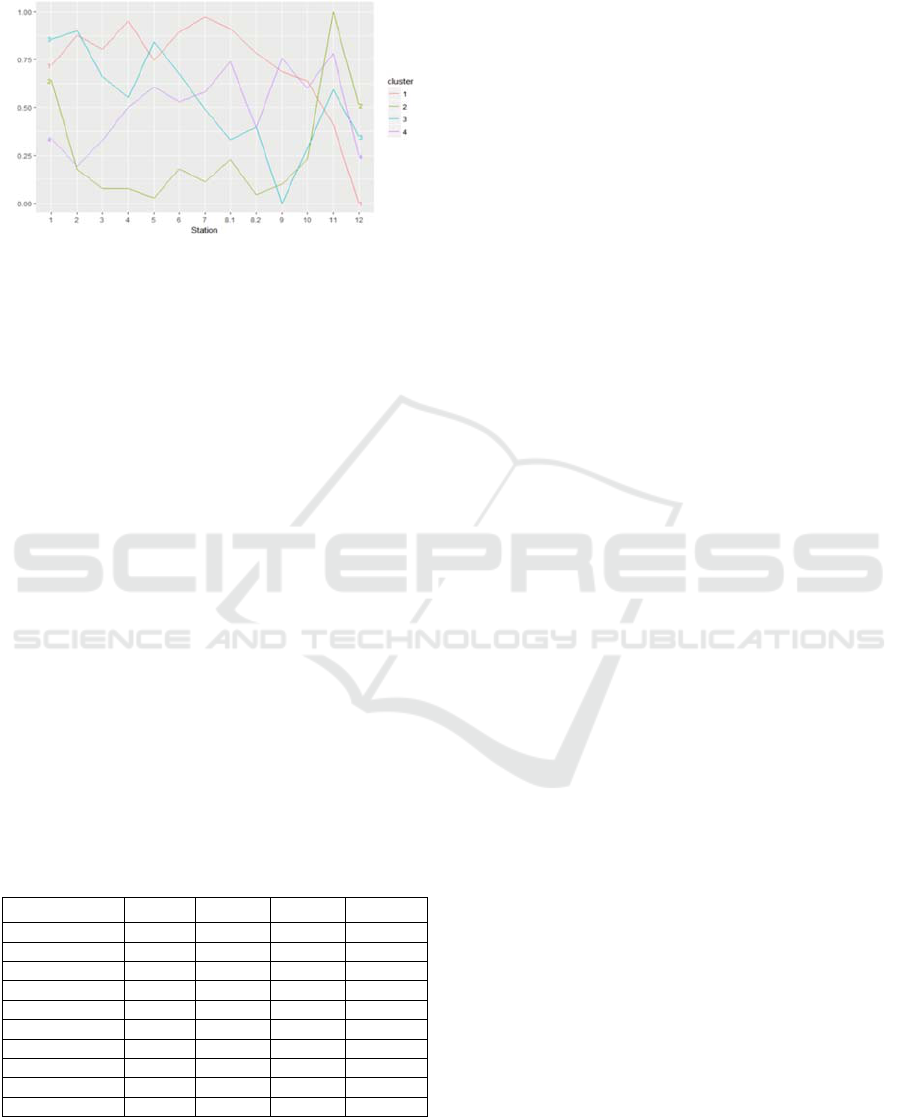
for cluster 4 his experience, despite its ups and downs,
seems to remain more constant.
Figure 5: Curves of the 10 participants based on
average GSR values per station.
To verify the robustness of our analysis,
benchmarking of physiological data to the self-
reported questionnaire data was done. In this step of
the process, 2 participants were rejected due to
missing values in the self-reported questionnaire data.
These clusters, identified using EDA, were
corroborated by questionnaire data. In other words,
had we used the sociodemographic and psychometric
variables of the questionnaires to create these
clusters, 7 out of 8 participants would still have been
assigned to the same subgroup.
2.3 Cluster Creation
Given this high success rate, our next step was to
attempt to classify the remaining participants. In other
words, we used the self-reported questionnaire data to
infer into which cluster each of the remaining 26
participants would belong to (see table 1).
Sociodemographic and psychometric variables were
used to reproduce the above clustering results by
minimizing the Euclidean distance to the centroids of
the above clusters (figure 5).
Table 1: The four clusters by mean of self-reported data.
Cluster cl1 cl2 cl3 cl4
valence_
b
egin 5 4,14 1,5 3,2
arousal_en
d
3,75 2,14 5,6 5,2
valence_en
d
2,5 5,43 2,2 3,93
appre_amulet 7,5 4,07 6,9 6,9
satis_ACSI 67,6 43,39 69,64 69,64
education 3 4 4,8 4,8
arousal_
b
egin 6,25 4,71 5,7 5,7
appre_story 6,5 4,93 6,95 6,95
satis_overall 5,75 4,71 6,45 6,45
N 4 7 10 15
Below, a breakdown of the four subgroups
describing clusters by mean of the questionnaire
variables.
Cluster 1:
Highest reported valence at the beginning
Highest reported arousal at the beginning
Significant drop in arousal from beginning
to end
Lowest level of education
Cluster 2:
Lowest reported arousal at the end
Lowest reported appreciation of the amulet
Lowest reported appreciation of the narrative
Highest reported valence at the end
Lowest calculated ACSI satisfaction score
Lowest reported satisfaction level overall
Significant drop in arousal from beginning
to end
Cluster 3:
Lowest reported valence at the beginning
Highest reported arousal at the end
Highest reported education level
Lowest reported valence at the end
Highest level of education
Cluster 4:
Highest reported appreciation of the story
Highest calculated ACSI satisfaction score
Highest reported appreciation of the amulet
Lowest reported level of education
Lowest reported arousal at the beginning
Highest reported satisfaction overall level
Highest level of education
As previously mentioned, personas describe groups
of target users which share common behaviours,
goals, wants, needs, and frustrations when using a
product (Cooper, 1999). While these user profiles do
not yet represent complete personas, the inclusion of
physiological measures in combination with
traditional methods (i.e. interviews, questionnaires,
etc.), can help UX designers to better understand the
needs, behaviour and frustrations of users during
interactive experiences.
With the addition of qualitative data, this method
should help designers by providing an additional level
of detail; taking these above clusters from groups of
individuals with similar emotional responses
experienced during the same period of time, to user
based personas.
2.4 Main Conclusions
Using physiological measures as the statistical
starting point, we were able to identify four subgroups
using a curve clustering method. Although we chose
PhyCS 2018 - 5th International Conference on Physiological Computing Systems
134

a difficult data collection setting due to partnership
constraints, we were able to identify various personas
that can help designers improve this interactive trail.
In the context of this experiment, we can observe
a significant drop in self-reported arousal from the
beginning to the end of the experience end can also
be indicative of a lower overall satisfaction level.
Cluster 4 was the only subgroup with a self-reported
arousal increase from the beginning to the end of the
experience. This subgroup also has the highest self-
reported and calculated overall satisfaction. This
cannot be said of valence.
One of the main challenge of the data collection
was the environment itself. The experience occurred
entirely outdoors in a forest, on a leveled but non-
asphalted trail. This caused movement artefact.
Furthermore, the effects of ambient and skin
temperatures fluctuations on EDA have long been
proven (Edelberg, 1972). These environmental
limitations explain in large part the small number of
participants included in the physiological data
analysis, as many subjects were rejected due to poor
quality signal. However, using both qualitative and
quantitative not only added depth to our analysis, but
also allowed us to recover important participant data.
Therefore, this method should be even more efficient
under better conditions.
3 CONCLUSION
This novel approach illustrates the potential of
physiological measures in the identification of
personas based on one or more experiential aspect.
Although neither personas nor physiological
measures are new to HCI or UX, the combination of
the two could help user profiling by bringing groups
of archetypal users to life, in order to support user-
centred design practice. This novel approach also
responds to a need for more data-driven personas,
based directly on user data, as we can see even here
the discrepancies between experienced and self-
reported arousal. This method should be particularly
useful to HCI researchers, practitioners and
designers, especially in the context of interactive and
immersive environments, or any other circumstances
where it may be difficult to accurately observe and
assess user experience.
4 FUTURE WORKS
The next step is to further develop this method in a
more controlled environment, for example a business
conference or concert, which will allow us to collect
quality data on a much bigger sample size. This will
also enable us to include other physiological signals,
such as heart rate and mobile eyetracking.
ACKNOWLEDGEMENTS
Authors want to thank the research assistants who
administered the study. This work was supported by
the Natural Sciences and Engineering Research
Council.
REFERENCES
McGinn, Jennifer Jen, and Nalini Kotamraju. "Data-driven
persona development." Proceedings of the SIGCHI
Conference on Human Factors in Computing Systems.
ACM, 2008.
Edelberg, Robert. "Electrical activity of the skin: Its
measurement and uses in psychophysiology."
Handbook of psychophysiology 12 (1972): 1011.
Boucsein, Wolfram. Electrodermal activity. Springer
Science & Business Media, 2012.
Garrett, Jesse James. Elements of user experience, the:
user-centered design for the web and beyond. Pearson
Education, 2010.
Cugliari, Jairo, Yannig Goude, Jean-Michel Poggi, Jairo
France, and Jean-Michel France. "Classification de
courbes individuelles et prévision désagrégée de la
consommation électrique.", 2015.
Abraham, Christophe, Pierre-André Cornillon, E. R. I. C.
Matzner‐Løber, and Nicolas Molinari. "Unsupervised
curve clustering using B‐splines." Scandinavian
journal of statistics 30, no. 3 (2003): 581-595
Tu, Nan, Xiao Dong, Pei-Luen Patrick Rau, and Tao Zhang.
"Using cluster analysis in persona development." In
Supply Chain Management and Information Systems
(SCMIS), 2010 8th International Conference on, pp. 1-
5. IEEE, 2010.
Zhang, Xiang, Hans-Frederick Brown, and Anil Shankar.
"Data-driven Personas: Constructing Archetypal Users
with Clickstreams and User Telemetry." Proceedings of
the 2016 CHI Conference on Human Factors in
Computing Systems. ACM, 2016.
Loke, Lian, Toni Robertson, and Tim Mansfield. "Moving
bodies, social selves: movement-oriented personas and
scenarios." Proceedings of the 17th Australia
conference on Computer-Human Interaction: Citizens
Online: Considerations for Today and the Future.
Computer-Human Interaction Special Interest Group
(CHISIG) of Australia, 2005.
Roto, Virpi, Marianna Obrist, and Kaisa Väänänen-Vainio-
Mattila. "User experience evaluation methods in
academic and industrial contexts." Proceedings of the
Workshop UXEM. Vol. 9. 2009.
Developing Personas based on Physiological Measures
135

Fornell, Claes, Michael D. Johnson, Eugene W. Anderson,
Jaesung Cha, and Barbara Everitt Bryant. "The
American customer satisfaction index: nature, purpose,
and findings." the Journal of Marketing (1996): 7-18.
Cooper, Alan. The inmates are running the asylum: [Why
high-tech products drive us crazy and how to restore the
sanity]. Indianapolis: Sams, 2004.
PhyCS 2018 - 5th International Conference on Physiological Computing Systems
136
