
Feature Selection for Anomaly Detection in Vehicular Ad Hoc Networks
Van Huynh Le, Jerry den Hartog and Nicola Zannone
Eindhoven University of Technology, Eindhoven, The Netherlands
Keywords:
Anomaly Detection, Vehicular Ad Hoc Network, Basic Safety Message, Crash Avoidance Systems.
Abstract:
An emerging trend to improve automotive safety is the development of Vehicle-to-Vehicle (V2V) safety
applications. These applications use information gathered from the vehicle’s sensors and from surrounding
vehicles to detect and prevent imminent crashes. Vehicles have been equipped with external communication
interfaces to make these applications possible, but this also exposes them to security threats. If an attacker is
able to feed safety applications with incorrect data, they might actually cause accidents rather than prevent
them. In this paper, we investigate the application of white-box anomaly detection to detect such attacks. A
key step in applying such an approach is the selection of the “right” behavioral features, i.e. features that allow
the detection of attacks and provide an understanding of the raised alerts. By finding meaningful features
and building accurate models of normal behavior, this work makes a first step towards the design of effective
anomaly detection engines for V2V communication.
1 INTRODUCTION
Safety is one of the main concerns in the automotive
industry. Over the last decades, several safety
measures, such as airbag, anti-lock braking systems,
and electronic stability control systems, have been
developed and deployed in modern vehicles, signifi-
cantly improving vehicle safety. Nevertheless, crashes
still happen, causing fatalities, injuries, and property
damage.
Collision avoidance technologies are nowadays
attracting significant attention in the automotive
industry to further mitigate and even avoid crashes
entirely (Harding et al., 2014). One emerging trend
in crash avoidance is the development of Vehicle-
to-Vehicle (V2V) safety applications. By sharing
kinematics data, driver intents, and environment condi-
tions among nearby vehicles, V2V safety applications
aim to predict and warn drivers of imminent crashes.
To enable V2V safety applications and, in general,
automotive applications based on V2V commu-
nication, vehicle are equipped with an increasing
number of external communication interfaces. This,
however, rises several security concerns. In fact,
the increasing connectivity of vehicles has enlarged
the attack surface and several attacks have already
been demonstrated (Koscher et al., 2010; Foster
et al., 2015; Miller and Valasek, 2015; Mazloom
et al., 2016; Palanca et al., 2017). In particular, safety
V2V applications may be disrupted by cyber-security
attackers by providing incorrect information to
surrounding vehicles; by reacting to such forged
information these vehicles can unwittingly cause
incidents. Our goal is to detect such attacks.
A common approach to attack detection is
to monitor the network and find deviations from
the normal behavior, i.e. the so called anomalies.
To enable appropriate handling of alerts raised
upon finding an anomaly, the detection method
should provide an understanding of what causes the
alerts (Sommer and Paxson, 2010). An additional
challenge in anomaly detection for V2V safety
applications is that we have to distinguish attacks
from actual driving behaviors, not only under normal
conditions, but also in ‘extreme’ situations such as
pre-crashes. The risk is that pre-crashes and attacks
are confused while they require completely different
handling: safety applications must quickly inform
drivers of pre-crashes while discarding messages
corresponding to attacks.
To address the challenges above we study how
a semantics-aware white-box anomaly detection
framework (Costante et al., 2017) can be applied
to detect attacks that can disrupt the functioning of
V2V safety applications. A key step in applying this
anomaly detection approach is the selection of the
“right” behavioral features to model normal behavior;
features should allow the detection of attacks as
Le, V., Hartog, J. and Zannone, N.
Feature Selection for Anomaly Detection in Vehicular Ad Hoc Networks.
DOI: 10.5220/0006946804810491
In Proceedings of the 15th International Joint Conference on e-Business and Telecommunications (ICETE 2018) - Volume 1: DCNET, ICE-B, OPTICS, SIGMAP and WINSYS, pages 481-491
ISBN: 978-989-758-319-3
Copyright © 2018 by SCITEPRESS – Science and Technology Publications, Lda. All rights reserved
481

well as provide an understanding of the raised alerts.
Driven by experiments on a real-life dataset of
messages for V2V safety applications, we discuss
the main challenges in feature selection for anomaly
detection in V2V communication. By finding useful
features and building models of normal behavior this
work provides a first step towards accurate anomaly
detection engines for V2V communication.
The remainder of the paper is structured as
follows. The next section introduces collision avoi-
dance systems along with the situations that they aim
to avoid and the message format they use. Section 3
presents an attacker model along with sample attack
scenarios. Section 4 presents the white-box anomaly
detection framework and the dataset used for our expe-
riments. Section 5 discusses the problem of feature
selection and Section 6 presents the results of the expe-
riments. Section 7 discusses related work on detecting
false information injected into V2V networks. Finally,
Section 8 draws conclusions and identifies directions
for future work.
2 COLLISION AVOIDANCE
SYSTEMS
Collision avoidance systems (also called V2V safety
applications) are designed to prevent or attenuate
the severity of collisions. In particular, they use
information gathered from the vehicle’s sensors and
from external sources (e.g., surrounding vehicles,
roadside units) to detect an imminent crash, which is
described by means of pre-crash scenarios (Najm et al.,
2013). To ensure interoperability among vehicles,
V2V safety applications use a standardized message
format called Basic Safety Message (BSM) (SAE
Motor Vehicle Council, 2008).
In this section, we present some relevant pre-crash
scenarios typically addressed by V2V safety applica-
tions and the Basic Safety Message (BSM) format
upon which those applications are built.
2.1 Pre-crash Scenarios
Rear-end, lane change, and opposite direction crashes
are three common crash scenarios. They have been
identified as priority targets to be addressed by V2V
safety applications (Najm et al., 2013).
Rear-end Scenarios:
A vehicle (V1) hits a slower
vehicle (V2) moving in the same lane from behind
(Figure 1(a)).
Lane-change Scenarios:
A vehicle (V1) changes
lane, turns, or drifts out of its lane, crashing into
V2
V1
(a) Rear-end
V1
V2
(b) Lane change
V1
V2
(c) Opposite direction
Figure 1: Pre-crash scenarios.
another vehicle (V2) traveling in the same direction
(Figure 1(b)).
Opposite Direction Scenarios:
A vehicle (V2) drifts
out of its lane or passes a vehicle in front, colliding
with another vehicle (V1) coming from the opposite
directions (Figure 1(c)).
2.2 Basic Safety Message
V2V safety applications detect pre-crashes by sharing
data, such as kinematics data, driver intents, and
environment conditions among neighboring vehicles.
Basic Safety Message (BSM) (SAE Motor Vehicle
Council, 2008) is a standardized message format
designed to ensure interoperability among vehicles
and, thus, support the exchange of data required by
V2V safety applications.
A BSM consists of a mandatory part (BSM part I)
and an optional part (BSM part II). BSM part I contains
instantaneous status information of the sending vehicle,
including its location, motion, brake system status, and
the size of the vehicle. An overview of the fields is
provided in Table 1. BSM part II contains additional
sensor data (e.g., sunlight level) and event records (e.g.,
flat tire, light status change, airbag deployment). In
the scope of this paper, we only consider BSM part I
as it is mandatory and contains essential information
for V2V safety applications.
3 ATTACKS ON V2V
COMMUNICATION
The increasing connectivity of modern vehicles has
attracted considerable attention in the security field
and several attacks have already been demonstrated,
some of them having a significant impact on vehicle
safety. In particular, attacks can lead V2V safety
applications to signal misleading warnings or take
dangerous actions, thus undermining safety and
BASS 2018 - International Workshop on Behavioral Analysis for System Security
482

Table 1: Fields in BSM part I.
Data elements
Description
Available
in dataset
Used for
profiling
Standard elements
DSRCmsgID Identifier for message type Yes No
SecMark A timestamp in milisecond, modulo 1 minute Yes No
MsgCount Sequence number for messages of the same type Yes Yes
Temporary ID Random MAC/IP address, changed periodically to ensure anonymity Yes Yes
Latitude Latitude of the vehicle Yes Yes
Longitude Longitude of the vehicle Yes Yes
Speed Speed of the vehicle Yes Yes
Heading Current heading of the vehicle relative to North Yes Yes
Yaw Rate The vehicle’s rotation in degrees per second Yes Yes
Longitudinal Acceleration Acceleration along the vehicle longitudinal axis Yes Yes
Lateral Acceleration Acceleration along the vehicle lateral axis Yes Yes
Vertical Acceleration Acceleration along the vehicle vertical axis Yes No
Elevation Elevation from the sea level Yes No
Positional Accuracy
Semi-major accuracy at one standard deviation, semi-minor accuracy at one standard
deviation, and orientation of semi-major axis relative to true North
Some No
Brake System Status
Brake applied status, traction control state, antilock brake status, stability control
status, and brake boost applied
Some No
Vehicle Length Length of the vehicle No No
Vehicle Width Width of the vehicle No No
Metadata
Recorder ID ID of the vehicle recording the message Yes Yes
Sender ID ID of the sending vehicle Yes Yes
Gentime Timestamp when the message is created Yes Yes
hindering user acceptance of V2V safety applications.
In this section, we introduce an attacker model and
present sample attacks for the pre-crash scenarios
presented in Section 2.1.
3.1 Attacker Model
Because V2V safety applications rely on data shared
among neighboring vehicles, attackers can disrupt the
correct functioning of these applications by injecting
bogus information into V2V networks. Such bogus
information can cause applications to signal false
warnings, or in the case of autonomous vehicles, to
make unnecessary and potential dangerous maneuvers.
Several attacker models have been proposed in the
context of V2V applications (Papadimitratos et al.,
2006; Raya and Hubaux, 2007). For instance, Raya
and Hubaux (2007) distinguishes insider vs. outsider,
active vs. passive, local vs. extended attackers. In this
work, we consider active inside attackers, which we
further classify based on their capability to modify
data fields in a message:
M1. Attackers can manipulate one or a limited set of
sensor data. For example, they can inject bogus
message into Controller Area Network (CAN),
which result in incorrect sensor data (Koscher et al.,
2010) or they can spoof the GPS signal resulting
in false location data.
M2.
Attackers have complete control over one vehicle
and can create arbitrary BSM. This is equivalent
to an attacker who can manipulate all sensor data
without affecting the operation of his own vehicle.
1
M3.
Attackers control multiple vehicles, which can
be either real or simulated. This class includes
Sybil attackers, in which one attacker pretends to
be multiple vehicles.
3.2 Attacks based on Pre-crash
Scenarios
In this section, we present sample attacks based on the
pre-crash scenarios discussed in Section 2.1.
Rear-end Pre-crash Scenario.
The leading vehicle
(V2) can make the vehicle behind (V1) brake by
creating the false impression of a rear-end pre-crash
scenario (Figure 2(a)). To this end, V2 can report loca-
tion closer to V1, lower speed, negative longitudinal
acceleration, or their combination.
1
In vehicular networks, several cryptographic mecha-
nisms, such as digital signatures, have been proposed to
ensure message integrity. Typically, these mechanisms rely
on the use of secret keys. If an attacker has obtained such a
key, he can craft and send any message.
Feature Selection for Anomaly Detection in Vehicular Ad Hoc Networks
483
V2
V2
(fake)
V1
(a) Rear-end attack scenario
V1
V2
(fake)
V2
(b) Lane change attack scenario
V2
V1
V2
(fake)
(c) Opposite-direction attack scenario
Figure 2: Attacks based on simulating pre-crash scenarios.
Lane Change Scenario.
A vehicle (V2) can make
another vehicle (V1) abort changing lane by causing
the misconception that V2 is in a colliding course
with V1 (Figure 2(b)). To this end, V2 can report false
location, higher speed, and higher acceleration. Alter-
natively, V1 could make V2 brake by reporting that it
is changing lane while actually going straight forward.
Opposite Direction Scenario.
A vehicle (V2)
can persuade another vehicle (V1) to take evasive
maneuver (e.g., turning right) by reporting false loca-
tion (Figure 2(c)).
All attack scenarios above can be performed by
an attacker of type M1 that has control over a rele-
vant sensor. An attacker of type M2 could strengthen
the attack by reporting multiple incorrect values, for
example, manipulating both the reported speed and
position. The additional capabilities of M3 level attac-
kers does not really impact these scenarios. In the
remainder, we will focus on M1 attackers and leave
higher level attackers as future research.
4 METHODOLOGY
To defend against attacks, several preventive security
mechanisms such as digital signatures (Harding et al.,
2014; European Telecommunications Standards Insti-
tute, 2012) and hardware security module (Apvrille
et al., 2010) have been proposed to ensure the inte-
grity of V2V messages. Anomaly detection is a non-
invasive approach that can complement such techni-
ques, adding a layer of defense.
An anomaly detection method should not only have
a high detection rate and a low false positive rate but
Normal
Attacks
Pre-crashes
Rear end
Lane change
Opposite direction
Figure 3: Behavior classification.
also provide useful information about the alerts that are
raised. This information is necessary to make the alert
actionable (Sommer and Paxson, 2010), meaning that
it should provide the information necessary to under-
stand what caused the alert and to choose an appro-
priate response to it. Here, we have the added chal-
lenge that we aim to distinguish between attacks and
pre-crash situations, which, while part of the normal
behavior, are already exceptional situations (Figure 3).
Being able to understand the alert is important to distin-
guish false positives (e.g., a real pre-crash condition
that looks like an attack) from real alerts (caused by
attacks).
We apply a semantics-aware white-box anomaly
detection approach (Costante et al., 2017) that can
extract understandable models and alerts to BSM-
based V2V communication.
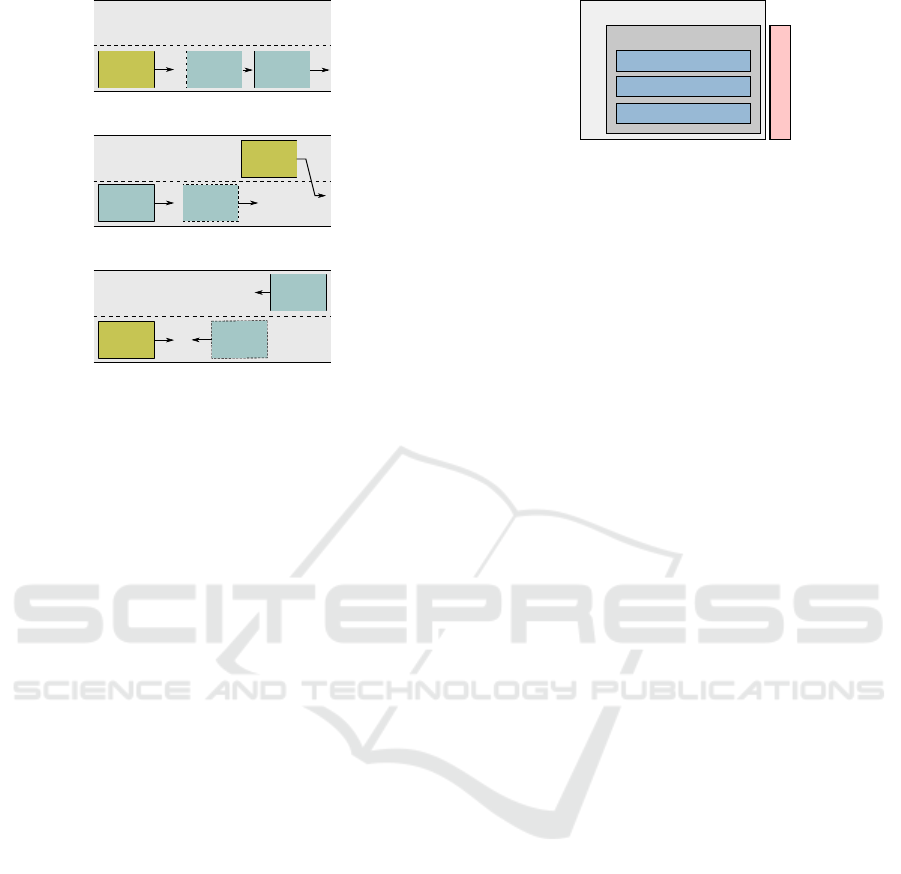
4.1 White-box Anomaly Detection
The framework (Figure 4) creates a model of normal
behavior, called a profile, and detects anomalies,
i.e. events not fitting this profile. Profiles capture the
distribution of features of normal events happening in
the system and are learned from a training set consis-
ting of all feature values for a sequence of normal
events. Here, events are (sequences of) BSMs being
sent while features typically capture (combinations of)
fields in such messages. Multiple profiles can be used
to capture behavior in different conditions that influ-
ence normal behavior, for example, different profiles
for nighttime and daytime.
Profiles can be represented as histograms, a format
easily understood by human operators. This enables
an operator to perform tuning, in which a threshold for
separating normal and anomalous behavior is chosen,
resulting in a detection engine.
In the detection phase, the detection engine raises
an alert for events where a feature takes a value whose
likelihood is below the threshold. Response to the
alerts is out of scope of anomaly detection, however,
since the alerts indicate which features exhibit unlikely
values, they capture important information needed
by other mechanisms to take appropriate actions.
Obtaining meaningful alerts also enables human
BASS 2018 - International Workshop on Behavioral Analysis for System Security
484

Raw data
Training
set
Profiles
Detection
engine
1: Feature extraction
3: Tuning
5: Feedback
Alerts
4: Detection
2: Profiling
Figure 4: White-box anomaly detection framework.
operators to provide feedback, i.e. adjust the detection
engine to reduce false positives.
Selecting the right features is essential in crea-
ting a useful detection engine. As this is a data
driven process, we first present the dataset used in
our analysis before detailing feature selection in the
next section.
4.2 Dataset
For our analysis, we use a dataset comprising BSMs
collected by on-board devices during Safety Pilot
Model Deployment (U.S. Department of Transporta-
tion, 2018). The data was collected in the Ann Arbor
region, Michigan (Figure 5
2
).
It is worth noting that the messages in this dataset
do not fully comply with the standard BSM format
(Table 1). In particular, the dataset lacks informa-
tion on vehicle length and width. Moreover, only
some messages contain positional accuracy and brake
system status.
3
While missing some fields, the dataset contains
metadata including message Sender ID, message
Recorder ID (ID of the vehicle recording the message),
and message Gentime (the timestamp when the
message is generated). We use the ID’s of message
senders and recorders in addition to Temporary ID and
MsgCount to differentiate vehicles. Moreover, we use
Gentime to calculate additional features (as described
in Section 5).
Note that the use of these metadata is not a problem
when moving to standard BSMs because a receiver of
a message will have context information to replace
these metadata: Temporary ID is a random number
assigned to each vehicle. Although the chance that
two vehicles share the same Temporary ID is very low,
collisions of IDs are possible. Here, we used Sender
ID and Recorder ID to distinguish vehicles. However,
the same result could have been obtained using other
2
Map background: map tiles by CartoDB, which are
derived from data by OpenStreetMap contributors.
3
This information is logged in separate files, which
however do not follow the same time series format used
in the rest of the dataset. Therefore, we did not consider this
information in our experiments.
Figure 5: Distribution of 100 million BSM samples within
the Ann Arbor area. Darker purple shades correspond to
higher message densities.
information in BSMs such as time and location. More-
over, knowing the time a message arrives, the receiver
can infer Gentime from SecMark (timestamp modulo
1 minute).
To sum up, the following data elements are avai-
lable in the dataset:
•
Data about the motion of the vehicle gene-
rating the message, including Speed, Longitu-
dinal/Lateral/Vertical Acceleration, and Yaw Rate.
• Timing data, including SecMark and Gentime,
•
Location data, including Latitude, Longitude,
Elevation, and Heading.
•
Data about message sequences, including: Tempo-
rary ID, Recorder ID, Sender ID, and MsgCount.
In the next section, we discuss how we extracted
features from these data elements.
5 FEATURE SELECTION
An important step in applying the anomaly detection
framework in Section 4.1 to the automotive safety
setting is to extract relevant features from BSMs.
Although the BSM format has a fixed number of data
elements, there are numerous potential features. For
example, in BSMs a message contains several depen-
dent data fields, such as speed and acceleration or
heading and yaw rate. In addition, the BSMs from
the same vehicle naturally form a time series. On
the other hand, data elements such as longitude and
latitude can be fairly noisy. The challenge thus is to
define features that are robust to noise and exploit the
available information to reveal attacks.
Below we first consider the most obvious features
Feature Selection for Anomaly Detection in Vehicular Ad Hoc Networks
485

extracted from a single field of a message. Moti-
vated by the M1 attacker model, we also look at
features that check the consistency of the reported
values, for example comparing the reported speed to
that computed from reported positions. To address
noise in the data we consider features computed over
sequences of messages rather than single messages.
Features for Message Fields.
By finding the normal
values for BSM fields, we can detect simple attacks
that set a field to an unusual value to induce a safety
application to misbehave. Rather than just repor-
ting a field value, a feature (e.g. road type) could be
computed from the field value (e.g. location), possibly
using some external information (e.g. a road map).
While, as we see in the next section, most normal
values are grouped into a limit range, overall a wide
range of values is possible; setting thresholds too
high will possibly yield many false positives. This
means that if an attack is more sophisticated, it could
create dangerous situations by using values that are not
abnormal by themselves. Using different profiles for
different situations can potentially create more accu-
rate models (e.g., daytime driving may be different
from nighttime driving; driving on highways may be
different from driving in an urban area).
Compound Features.
For many attacks, single fields
will not contain enough information for their detection.
We thus also consider relations between features.
Several features will naturally show some correlation.
For example, turning will impact both yaw rate and
lateral acceleration and strong turns at high speed are
unlikely. Combined features Yaw Rate-Lateral Accele-
ration respectively Yaw Rate-Speed will capture these
relations. We expect such combined features to be
effective against M1 type attackers that can control one
of the values but not the other. Even higher type attac-
kers would need to carefully construct their attacks
to ensure the combination of reported fake values is
believable.
Features for Consistency Check.
Modifications
of data elements in BSMs can also be detected by
checking their consistency within one message as well
as across messages. In the latter case, we need to
consider sequences of BSMs coming from single vehi-
cles. In our dataset, we can find such sequences by
looking at the Temporary ID. While Temporary ID of
vehicles changes regularly (e.g. every 5 minutes), on
the time scale we are looking at (less than a second) it
is mostly constant.
To check consistency we can use basic physical
laws; for example, if we take the position and time
from two messages we can compute the average speed
and compare that to the speed reported in the messages.
Similarly, we can compare the reported yaw rate with
the change in heading. Computing with a small times-
cale amplifies measurement noise. To reduce this
effect, we compute over a window of
n ≥ 2
messages,
going back
n − 1
messages rather than comparing to
the previous message.
In the next section we select several features cove-
ring the different types above and use them to build a
detection engine.
6 EXPERIMENTS
We conduct a number of experiments to evaluate the
impact of feature selection on the ability of a detection
engine to identify potential attacks. In our experi-
ments, we use the dataset described in Section 4.2 and
build profiles of normal behavior using the features
described in Section 5. These profiles are used to build
detection engines for the white-box anomaly detection
framework described in Section 4.1.
The dataset contains many BSMs with the lateral
acceleration field set to
20.01 m/s
2
(> 2g)
. We
believe that this specific value is due to equipment or
data recording errors.
4
Thus, we remove all messages
with this lateral acceleration value from the dataset.
The resulting dataset contains more than 1.2 billion
messages. We use
80%
of this dataset to build profiles
and 20% for testing.
We generate an attack dataset that simulates rear-
end pre-crash scenarios. To this end, we selected from
the testing dataset BSMs that have a speed between
11.4
to
30.0 m/s
. This speed range is based on the
operational speed for which forward collision warning
is applicable (Toma et al., 2013). We randomly select
half a million of such BSMs and set their Speed field
to
0
. Each simulates a tampered BSM that pretends
the attacker has stopped to a target vehicle following
the attacker in the same lane and at a similar speed.
Although the considered attack is very simple, it can
already demonstrate the effectiveness of different types
of features on the detection of potential attacks.
To evaluate the quality of a detection engine we
draw its receiver operating characteristic (ROC) curve,
which plots the trade-off between false positive rate
(FPR) and detection rate (DR) it induces. FPR is the
ratio between the number of BSMs wrongly catego-
rized as alerts (false positives) and the total number of
BSMs. DR is the ratio between the number of attacks
correctly categorized as alerts and the total number of
4
Another possible issue is the unit of measurement for
Speed; the dataset documentation states it is expressed in
m/s but mph seems more likely given the data. Nonetheless,
we keep the interpretation given by the documentation.
BASS 2018 - International Workshop on Behavioral Analysis for System Security
486

Figure 6: Distribution of BSMs over the day.
attacks. Formally:
FPR =
# false alerts
# messages
DR =
# true alerts
# attacks
In the remainder of this section, we first present
the obtained profiles and then we evaluate the corre-
sponding detection engines.
6.1 Profiling
We build profiles from the training dataset using the
features described in Section 5. A hypothesis we
consider is that different driving patterns may occurs
during daytime and nighttime. As building a profile
from heterogeneous behaviors can lead to misleading
conclusions (Alizadeh et al., 2018), we partitioned the
training dataset in two parts and built two profiles, one
for daytime and one nighttime. Daytime and nighttime
were identified based on the distribution of BSMs over
the time of the day (Figure 6). In the figure, we can
observe two peaks corresponding to morning and after-
noon rush hours between 6AM and 8AM and between
5PM and 6PM respectively. On the other hand, we
observed a low message frequency between 7PM and
6AM. Accordingly, we considered this time interval
as nighttime and from 6AM till 7PM as daytime.
Features for Message Fields.
Our first set of features
make use of single data elements in BSMs. Figures 7
and 8 present the profiles for daytime and night-
time respectively with respect to data elements Speed,
Longitudinal Acceleration, Lateral Acceleration, and
Yaw Rate. The differences between the two profiles
turn out to be very small, indicating that driving
patterns are in fact not influenced much by the time
of the day. Accordingly, using separate profiles for
daytime and nighttime would not improve the effecti-
veness of the detection engine. Note that the profile
over the entire dataset can be obtained as the sum of
profiles in Figures 7 and 8. For the sake of space, we
do not visualize this again very similar profile.
We expect that these features can only help detect
very simple attacks in which data elements in BSMs
are set to very unusual values (e.g., a negative value
for Speed).
Compound Features.
To enable more fine-grained
detection capabilities, we also built profiles using
compound features. In particular, we built profiles
using pairwise combinations of Speed, Longitudinal
Acceleration, Lateral Acceleration, and Yaw Rate to
capture the relations between these data fields. We
visualize these profiles using heatmaps to give insight
into 2D features (Figure 9). From this, we can observe
the following patterns:
•
Higher values of Speed often correspond to lower
variation in both Longitudinal Acceleration and
Lateral Acceleration.
•
Combinations (Speed, Longitudinal Accelera-
tion), (Speed, Lateral Acceleration), (Longitudinal,
Lateral Acceleration), and (Longitudinal Accelera-
tion, Yaw Rate) do not typically have large values
at the same time. This means that drivers usually
maintain a constant speed when they travel fast
and do not accelerate/decelerate while turning or
changing lanes.
•
Data elements Lateral Acceleration and Yaw Rate
exhibit a linear/inverse-linear correlation.
Despite these patterns, all features are spread out, indi-
cating diversity in the normal behavior. Therefore, we
expect that detection engines based on these features
will have limited detection capabilities.
Features for Consistency Check.
The final set of
features are built over sequences of BSMs. In our
experiments, we considered various message window
sizes (i.e.,
n = 2,3,5,7
). Figures 10 and 11 visualize
the Speed and Heading reported in the BSM compared
to their value estimated over varying window sizes
using location and timing data.
The figures show a close correlation between the
values of Speed and Heading reported in BSMs and
the values estimated from location and timing data.
By comparing the different window sizes we see that
reducing the effect of noise on the position data by
increasing the window size further strengthens this
correlation.
As the obtained profiles exhibit clear patterns, these
features are promising to detect anomalies characte-
rized by inconsistencies between location data, speed,
and heading.
Feature Selection for Anomaly Detection in Vehicular Ad Hoc Networks
487
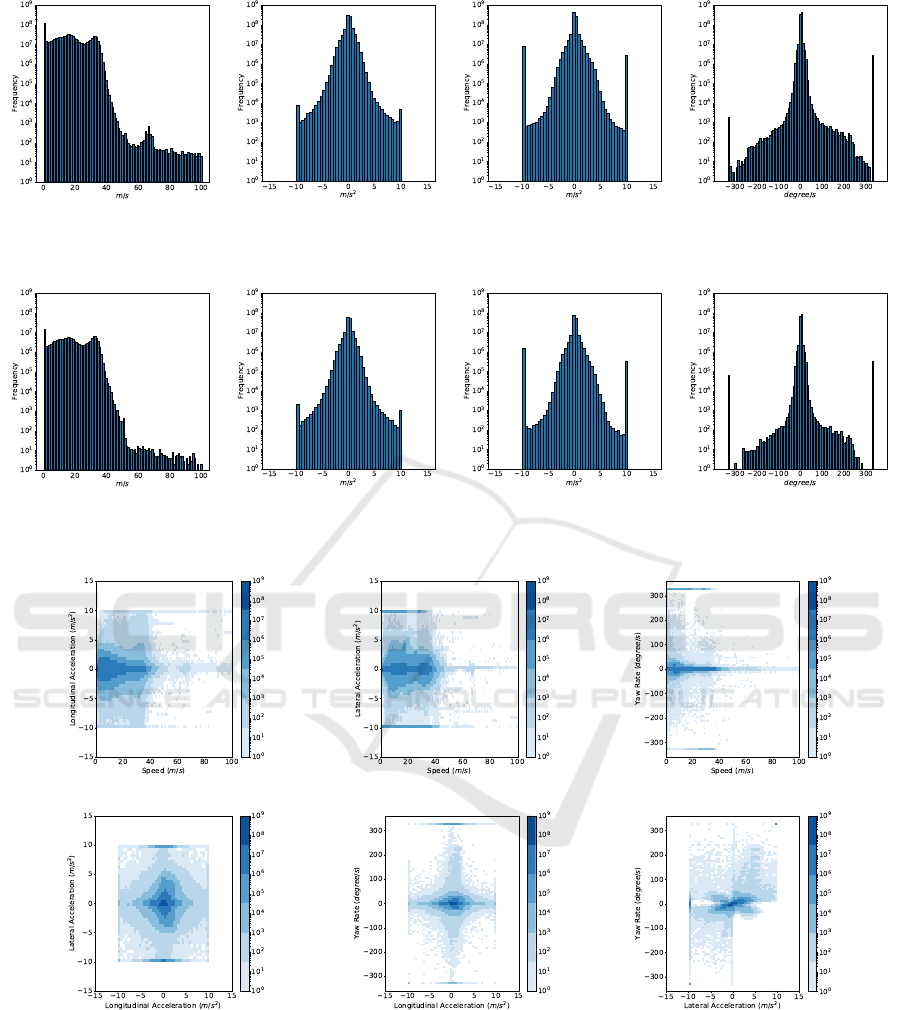
(a) Speed (b) Longitudinal Acceleration (c) Lateral Acceleration (d) Yaw Rate
Figure 7: Profiles of 1D features for message fields (daytime).
(a) Speed (b) Longitudinal Acceleration (c) Lateral Acceleration (d) Yaw Rate
Figure 8: Profiles of 1D features for message fields (nighttime).
(a) Speed-Longitudinal Acceleration (b) Speed-Lateral Acceleration (c) Speed-Yaw Rate
(d) Longitudinal-Lateral Acceleration
(e) Longitudinal Acceleration-Yaw Rate
(f) Lateral Acceleration-Yaw Rate
Figure 9: Profiles of 2D compound features.
6.2 Anomaly Detection
We combine the features above into different detection
engines and show their effectiveness using ROC curves
(Figure 12). We consider an engine (D1) using only
message field features, one (D2) using compound
features and four (D3-D6) using the consistency check
features with different window sizes.
Features for Message Fields.
We first consider a
detection engine D1 that uses the following features:
Speed, Longitudinal Acceleration, Lateral Accele-
ration, and Yaw Rate. As already expected from
the spread-out profiles of the features employed
BASS 2018 - International Workshop on Behavioral Analysis for System Security
488
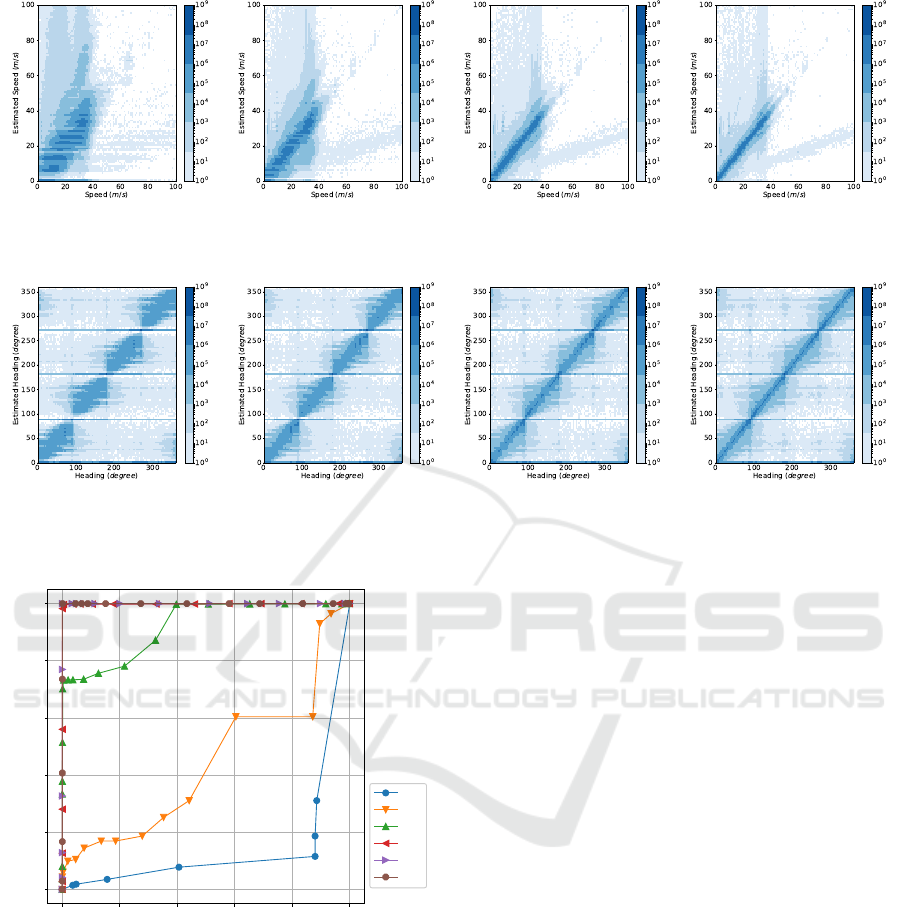
(a) Window size = 2 (b) Window size = 3 (c) Window size = 5 (d) Window size = 7
Figure 10: Profiling Speed reported by vehicles and speed estimated from latitude and longitude using different window sizes.
(a) Window size = 2 (b) Window size = 3 (c) Window size = 5 (d) Window size = 7
Figure 11: Profiling Heading reported by vehicles and heading estimated from latitude and longitude using different window
sizes.
0.0 0.2 0.4 0.6 0.8 1.0
False Posit ive Rat e
0.0
0.2
0.4
0.6
0.8
1.0
Det e ct ion Rat e
D1
D2
D3
D4
D5
D6
Figure 12: ROC curves of six detection engines using diffe-
rent feature sets.
(Figures 7 and 8), this detection engine performs
poorly (Figure 12). In fact, the detection engine actu-
ally performs worse than random guessing. A reason
for this is that the attack we consider sets the Speed
to 0, which is actually a common value. Also, over
the speed range at which the attacks occur, Longitu-
dinal Acceleration, Lateral Acceleration and Yaw Rate
more often take low and thus common values (see
Section 6.1).
Compound Features.
Detection engine D2 uses
compound features that are pairwise-combinations of
Speed, Longitudinal Acceleration, Lateral Accelera-
tion, and Yaw Rate. Figure 12 shows this detection
engine can detect a small number of attacks, but after
about 10% of the attacks it very much behaves like
random guessing. As can be seen from Figure 9, some
combinations of (longitudinal or lateral) acceleration
with a value of speed equal to 0 are unusual, allowing
the detection of the attack. However, only a small
percentage of the attacks have such values for accele-
ration rates. We performed further investigation and
observed that a compound feature out of all these three
values slightly improves detection rate but only up to
around 17% of the attacks.
Features for Integrity Check.
Detection engines
D3–D6 check for the consistency between speed
and heading reported in BSMs and their values
estimated from location and timing data. D3–D6
use features Speed-EstimatedSpeed and Heading-
EstimatedHeading, with the estimated values obtained
from windows of sizes
2,3,5,7
in that order. These
detection engines perform fair much better compared
to the ones built using message fields as features or
compound features. While estimation errors with
small windows may still cause some errors, using
window size 5 results in a nearly perfect detector.
From this, we can conclude that this window size is
sufficient to reduce noise. Moreover, as these features
capture the consistency of values rather than the values
Feature Selection for Anomaly Detection in Vehicular Ad Hoc Networks
489

themselves, they are very well suited for detecting
attacks like the one we considered, where a single
field is changed to a value that is common in general.
7 RELATED WORK
Several approaches to identify false information
injected into V2V networks have been proposed, yet
it remains an open challenge. Golle et al. (2004)
propose a general approach exploiting the redundancy
in sensor data shared among neighboring vehicles.
Each vehicle uses a model of the Vehicular Ad Hoc
Network (VANET) to check the validity of sensor
data. When an inconsistency is detected, an adver-
sarial model is used to explain it. Sensor data dictates
the VANET model, adversarial model, and the algo-
rithm to explain inconsistencies. However, the use of
real sensor data was not studied, and thus no concrete
models were given.
Lo and Tsai (2007) propose a rule-based approach
to detect false or outdated information in VANETs.
This approach employs the following rules: duplicate
messages must be dropped; the broadcast range must
be reasonable; the timestamp must be checked; and the
velocity must not be too high compared to the speed
limit. However, only sensor-cheating attacks have
been considered (attacker model M1). As suggested
by the results in Section 6.2, when individual data
elements are used for detection, stronger attackers may
craft messages that bypass all given rules.
Schmidt et al. (2008) propose several checks to
evaluate the trust level of vehicles. In particular, this
work proposes to verify whether: average speed, acce-
leration, and heading belong to valid ranges; vehicles
have moved during a certain time (in contrast to statio-
nary road-side attackers); the position claimed by vehi-
cles is on the road; vehicles do not suddenly appear;
the frequency of messages from a vehicle does not
exceed a threshold. Given our attacker models, these
checks can be easily bypassed; for example, setting
Speed to a lower value does not violate any of these
rules. Another test proposed by Schmidt et al. (2008)
is the sensor-proofed position check, which requires an
additional sensor, such as radar, to verify the distance
to a neighboring vehicle.
In addition to simple threshold checks of velocity,
message frequency, distance between message senders
and receivers, and timestamp, Stübing et al. (2010)
suggest to predict the movement of a vehicle using
Kalman filter. Then, the predicted movement and the
movement reported by messages are checked for incon-
sistencies. Our detection engines may benefit from this
prediction method, which could be more precise than
our current estimation in Section 6.1.
Another direction towards intrusion detection in
V2V networks is to exploit properties of the physical
communication layer, such as the signal strength (Xiao
et al., 2006) to verify a sender’s location. When such
data is available, it can be used as an additional feature
in our framework.
8 DISCUSSION AND
CONCLUSION
In this paper, we discuss the problem of feature
selection in the context of white-box anomaly
detection for V2V safety applications. Driven by a
real dataset of BSMs, we investigate how to build
accurate profiles of normal behavior. To this end, we
exploit features corresponding to BSM data elements
as well as more complex features including compound
features and features that check consistency.
Although the results of our experiments are promi-
sing, a number of challenges still need to be addressed.
•
The collected data are not always accurate. For
instance, the GPS data in our dataset does not have
the precision required by National Highway Traffic
Safety Administration (NHTSA) (2017).
•
Driving behavior is influenced by several factors.
In this work, we have investigated whether the
time of the day has an impact on driving beha-
vior, which however does not seem the case in the
analyzed dataset. Nonetheless, other factors may
be relevant, e.g. driving style (Eboli et al., 2017),
road type and weather conditions.
•
The dataset does not distinguish BSMs correspon-
ding to a normal situation to the ones correspon-
ding to a pre-crash scenario. This contributes to
the heterogeneity of the data used to build profiles
of normal behavior.
These issues can affect the quality of the built profiles
and, thus, their detection capabilities.
In future work, we plan to address those challenges
by constructing profiles specific to driving conditions
(e.g., driver behavior, pre-crash scenarios, road type).
For instance, one could exploit V2V safety applica-
tions to recognize BSMs that correspond to a given
pre-crash scenario or use position data (Figure 5) to
identify the road type. In addition, other BSM data
elements (e.g., brake status) and the fields defined in
BSM part II (e.g., path prediction data) can be used to
classify driving conditions.
We tested the defined detection engines with a
simple attack. Although this already provides us with
insights on the impact of feature selection on their
detection capabilities, more complex attacks should be
BASS 2018 - International Workshop on Behavioral Analysis for System Security
490

considered. In this respect, we plan to carry out more
extensive experiments with attacks of higher level as
well as targeting other pre-crash scenarios.
ACKNOWLEDGMENT
This work is partially supported by Rijkswaterstaat
under the TU/e Smart Mobility programme, by ITEA3
through the APPSTACLE project (15017) and by
ECSEL through the SECREDAS project.
REFERENCES
Alizadeh, M., Peters, S., Etalle, S., and Zannone, N. (2018).
Behavior Analysis in the Medical Sector: Theory and
Practice. In Proceedings of ACM/SIGAPP Symposium
On Applied Computing. ACM.
Apvrille, L., El Khayari, R., Henniger, O., Roudier, Y.,
Schweppe, H., Seudié, H., Weyl, B., and Wolf,
M. (2010). Secure automotive on-board electronics
network architecture. In Proceedings of FISITA 2010
World Automotive Congress. EURECOM.
Costante, E., den Hartog, J., Petkovi
´
c, M., Etalle, S., and
Pechenizkiy, M. (2017). A white-box anomaly-based
framework for database leakage detection. Journal of
Information Security and Applications, 32:27–46.
Eboli, L., Mazzulla, G., and Pungillo, G. (2017). How
drivers’ characteristics can affect driving style. Trans-
portation Research Procedia, 27:945–952.
European Telecommunications Standards Institute (2012).
ETSI TS 102 940 V1.1.1 - Intelligent Transport
Systems (ITS); Security; ITS communications security
architecture and security management.
Foster, I. D., Prudhomme, A., Koscher, K., and Savage, S.
(2015). Fast and vulnerable: A story of telematic
failures. In Proceedings of USENIX Workshop on
Offensive Technologies. USENIX Association.
Golle, P., Greene, D., and Staddon, J. (2004). Detecting and
correcting malicious data in VANETs. In Proceedings
of the 1st ACM International Workshop on Vehicular
Ad Hoc Networks, pages 29–37. ACM.
Harding, J., Powell, G., Yoon, R., Fikentscher, J., Doyle,
C., Sade, D., Lukuc, M., Simons, J., and Wang, J.
(2014). Vehicle-to-Vehicle communications: Readi-
ness of V2V technology for application.
Koscher, K., Czeskis, A., Roesner, F., Patel, S., Kohno, T.,
Checkoway, S., McCoy, D., Kantor, B., Anderson, D.,
Shacham, H., et al. (2010). Experimental security
analysis of a modern automobile. In Proceedings of
IEEE Symposium on Security and Privacy, pages 447–
462.
Lo, N.-W. and Tsai, H.-C. (2007). Illusion attack on VANET
applications - a message plausibility problem. In
Proceedings of Globecom Workshops, pages 1–8.
Mazloom, S., Rezaeirad, M., Hunter, A., and McCoy, D.
(2016). A security analysis of an in vehicle infotain-
ment and app platform. In Proceedings of USENIX
Workshop on Offensive Technologies. USENIX Associ-
ation.
Miller, C. and Valasek, C. (2015). Remote exploitation of
an unaltered passenger vehicle. Black Hat.
Najm, W. G., Toma, S., and Brewer, J. (2013). Depiction
of priority light-vehicle pre-crash scenarios for safety
applications based on vehicle-to-vehicle communica-
tions. Technical report, National Highway Traffic
Safety Adminstration (NHTSA).
National Highway Traffic Safety Administration (NHTSA)
(2017). Federal motor vehicle safety standards; V2V
communications. Proposed Rule.
Palanca, A., Evenchick, E., Maggi, F., and Zanero, S. (2017).
A stealth, selective, link-layer denial-of-service attack
against automotive networks. In Proceedings of Confe-
rence on Detection of Intrusions and Malware & Vulne-
rability Assessment, pages 185–206. Springer.
Papadimitratos, P., Gligor, V., and Hubaux, J.-P. (2006).
Securing Vehicular Communications – Assumptions,
Requirements, and Principles. In Proceedings of
Workshop on Embedded Security in Cars, pages 5–14.
Raya, M. and Hubaux, J.-P. (2007). Securing vehicular ad
hoc networks. Journal of Computer Security, 15(1):39–
68.
SAE Motor Vehicle Council (2008). Draft SAE J2735 - Dedi-
cated Short Range Communications (DSRC) Message
Set Dictionary.
Schmidt, R. K., Leinmüller, T., Schoch, E., Held, A., and
Schäfer, G. (2008). Vehicle behavior analysis to
enhance security in vanets. In Proceedings of the 4th
IEEE Vehicle-to-Vehicle Communications Workshop
(V2VCOM2008).
Sommer, R. and Paxson, V. (2010). Outside the closed
world: On using machine learning for network intru-
sion detection. In Proceedings of IEEE Symposium on
Security and Privacy, pages 305–316. IEEE.
Stübing, H., Jaeger, A., Schmidt, C., and Huss, S. A. (2010).
Verifying mobility data under privacy considerations in
Car-to-X communication. In Proceedings of the 17th
ITS World Congress.
Toma, S., Swanson, E., and Najm, W. G. (2013). Light
vehicle crash avoidance needs and countermeasure
profiles for safety applications based on vehicle-to-
vehicle communications. Technical report, National
Highway Traffic Safety Adminstration (NHTSA).
U.S. Department of Transportation (2018). Safety
Pilot Model Deployment data. https://data.
transportation.gov/Automobiles/Safety-Pilot-Model-
Deployment-Data/a7qq-9vfe. Accessed: 2018-03-01.
Xiao, B., Yu, B., and Gao, C. (2006). Detection and localiza-
tion of sybil nodes in VANETs. In Proceedings of the
2006 Workshop on Dependability Issues in Wireless Ad
Hoc Networks and Sensor Networks, pages 1–8. ACM.
Feature Selection for Anomaly Detection in Vehicular Ad Hoc Networks
491
