
The Terror Network Industrial Complex: A Measurement and
Analysis of Terrorist Networks and War Stocks
James Usher and Pierpaolo Dondio
DIT School of Computing, Kevin Street, Dublin 8, Ireland
Keywords: Social Networks and Organizational Culture, Social Web Intelligence, WEB 2.0 and Social Networks.
Abstract: This paper presents a measurement study and analysis of the structure of multiple Islamic terrorist networks
to determine if similar characteristics exist between those networks. We examine data gathered from four
terrorist groups: Al-Qaeda, ISIS, Lashkar-e-Taiba (LeT) and Jemaah Islamiyah (JI) consisting of six terror
networks. Our study contains 471 terrorists’ nodes and 2078 links. Each terror network is compared in terms
efficiency, communication and composition of network metrics. The paper examines the effects these terrorist
attacks had on US aerospace and defence stocks (herein War stocks). We found that the Islamic terror groups
increase recruitment during the planned attacks, communication increases during and after the attacks between
the subordinate terrorists and low density is a common feature of Islamic terrorist groups. The Al-
Qaeda organisation structure was the most complex and superior in terms of secrecy, diameter, clustering,
modularity and density. Jemaah Islamiyah followed a similar structure but not as superior. The ISIS and LeT
organisational structures were more concerned with the efficiency of the operation rather than secrecy. We
found that war stocks prices and the S+P 500 were lower the day after the attacks, however, the war stocks
slightly outperformed the S+P 500 the day after the attacks. Further, we found that war stock prices were
significantly lower one month after the terrorist attacks but the S+P 500 rebounded one month later.
1 INTRODUCTION
The tragic and catastrophic events of 9/11 and the
Paris terrorist attacks in 2001 and 2015 have
propelled the intelligence communities’ use of social
network analysis. Terror networks are designed in
their structure to maximise secrecy, efficiency,
resilience and remain as clandestine communities
(Krebs, 2002) Social network analysis allows us to
visualise the network structures and determine
insights from these networks. This knowledge
discovery or intelligence from terrorist networks is of
vital importance for combatting the war on terrorism.
In recent years, there has a been a surge in
geopolitically motivated terrorist attacks. A common
factor to all terrorist networks is the need or wish to
remain secret; although what is to be kept secret and
from whom differs, and indeed is rarely specified
(Crossley et al, 2010) A terrorist network may form
from the consequence of pre-existing ties, i.e. kinship
or friendship, and of people’s political motivations
that incite individuals or a collective group to act
cooperatively regardless of previous relations.
(Crossley et al, 2010; Krebs, 2002; Everton, 2011)
provide terrorist network theory on co-participation
in events and co-membership in groups to explain
network tendencies i.e. hierarchical/non-hierarchical
structure, vulnerability, efficiency, and
decentralisation over time. Whilst (Baker and
Faulkner, 1993; Natarajan, 2000; Koschade, 2006;
Morselli, 2007; Demiroz and Kapucu, 2012; Enders
and Su, 2007) examine communication, and analyse
structure and formation to focus on security and
efficiency trade-off, core-periphery structure,
centralisation/decentralisation, and resilience. An in-
depth understanding of the graph structure of terrorist
networks is necessary to evaluate the networks to
understand the hierarchical structure of the networks.
The importance of efficiency and secrecy in terrorist
networks clearly emerges when terrorists need to
carry out an attack. This is when the group members
emerge from the shadows in the aftermath and we can
then see which element is more important to the
terrorist groups in terms of the planned and executed
attack. In this paper, we present 471 terrorists and
2078 links belonging to four terrorist groups and six
terror networks. Data gathered from multiple sources
enables us to identify common structural properties of
172
Usher, J. and Dondio, P.
The Terror Network Industrial Complex: A Measurement and Analysis of Terrorist Networks and War Stocks.
DOI: 10.5220/0006926901720181
In Proceedings of the 14th International Conference on Web Information Systems and Technologies (WEBIST 2018), pages 172-181
ISBN: 978-989-758-324-7
Copyright © 2018 by SCITEPRESS – Science and Technology Publications, Lda. All rights reserved
these terror networks. The paper is organised as
follows firstly we describe the terror groups and the
attacks. Section 2 we use graph theory to graph all of
the terror network data, relationships and data
processing. Section 3, we analyse the S+P500
volatility, war stock and S+P 500 market
performance. We analyse the terror networks in
addition to comparing the network metrics for each
terror network attack in terms of efficiency,
communication and compositional network metrics.
Section 4 evaluates the results; section 5 contains
related literature and finally, in section 6, we
conclude with discussing our findings.
1.1 Terrorist Groups and Terrorist
Attacks
In this section, we give a brief description of the
terrorist group and their related attacks that form part
thereof this study
1.1.1 Al-Qaeda
Al-Qaeda is a global Islamic terrorist organisation
founded by Palestinian terrorist operative Abdullah
Azzam in 1988. Al-Qaeda originated in Afghanistan
as an underground movement that operated against
the Soviet occupation. Al-Qaeda has become a global
Islamic terrorist organisation operating in many
arenas around the world. Ideologically, Al-Qaeda
relies on the Salafi school of Islam, viewing jihad as
the personal duty of every Muslim. Al-Qaeda was
behind a series of showcase attacks against the United
States, the most prominent of which was the attack on
the World Trade Center in New York on September
11, 2001 (Terrorism-info, 2018) and the Madrid
bombings 2004. The attacks resulted in over 3,000
deaths and over 8000 casualties collectively
1.1.2 ISIS
ISIS is a powerful Islamic terrorist militant group that
has seized control of large areas of the Middle East.
The group is responsible for a series of European
terror attacks in Paris and Brussels that claimed the
lives of 162 people and 713 casualties.
1.1.3 Lashkar-e-Taiba (LeT)
Lashkar-e-Taiba (LeT) is an Islamic militant
organisation based in Pakistan with links to Al-Qaeda
and ISIS. The group is responsible for the Mumbai
attacks in 2008. The attacks commenced on
November 26th and ended on November 29th after an
intense operation lasting over sixty hours. The attacks
were carried out by 10 militants armed with advanced
weapons at five prime locations in Mumbai, India’s
financial capital. Nearly 260 persons, from ten
countries, were killed in the attack.
1.1.4 Jemaah Islamiyah (Ji)
Jemaah Islamiyah (JI) is a militant Islamist group
active in several Southeast Asian countries that seeks
to establish a pan-Islamic state across much of the
region. JI is alleged to have attacked or plotted against
U.S. and Western targets in Indonesia, Singapore, and
the Philippines. Herein, we analyse the attacks on the
Australian Embassy in 2004 which had 11 fatalities
and 150 causalities in addition to examining the Bali
attacks in 2005 which claimed the lives of 20 people
and had 120 causalities.
2 DATASET(S)
2.1 Dataset
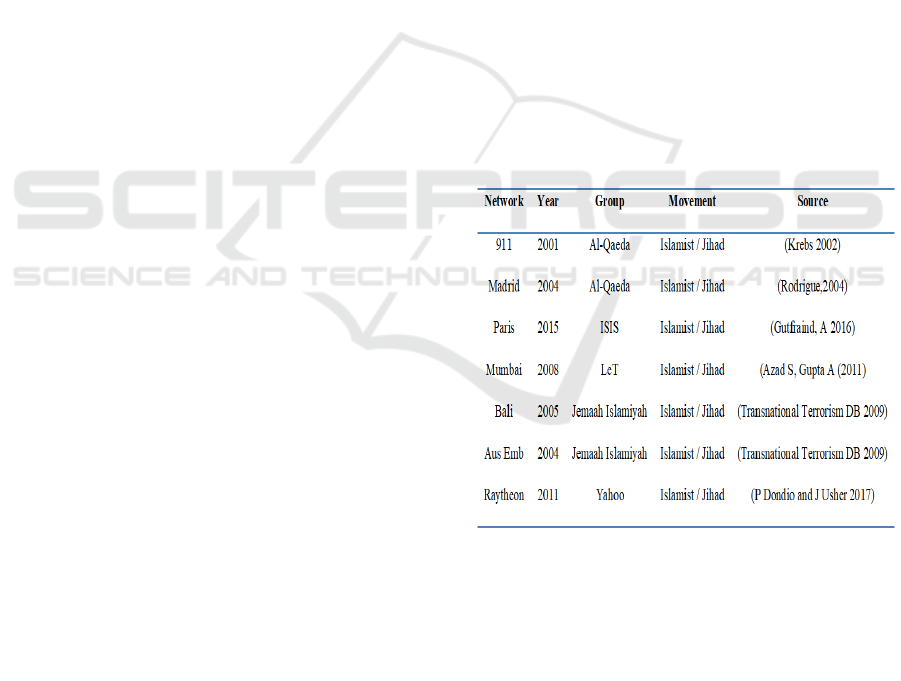
The six terrorist networks datasets can be accessed
within the public domain from the authors listed in
figure 1.
Figure 1: Dataset sources.
We have also included a non-terrorist network i.e. the
Raytheon online financial community in order to
understand if terrorist networks have distinct
properties compared to a non-terrorist networks.
2.2 Nodes
Nodes on the terrorist networks are a representation
from the following characteristics.
The Terror Network Industrial Complex: A Measurement and Analysis of Terrorist Networks and War Stocks
173

(i) Attackers: Those involved in the planned terrorist
attacks. This included operational leadership and
operational personnel. Relations derived from
interactions, including participation in political or
military events, political meetings, training in
Afghanistan, Iraq, or Libya, combats, negotiations for
hostage releases, or involvements with a killing, an
abduction, or a bombing.
(ii) Those known to have been involved in organising
terror attacks but may not have carried out an attack.
(iii) Family members who were known to play a role
or be associated with terror network, this included In-
laws, cousins, siblings, parent/child, spouse,
grandparents and significant others.
(iv) Users from the online financial community. We
collected data about users’ activities on Yahoo!
Finance Message Boards from 2001 until 2014 for the
war stock “Raytheon”. Yahoo! Finance keeps a
message board for each stock quoted on the US
market. Each message board is a stream of threads
opened by registered users. Each thread is a stream of
messages posted by users. A user can decide to add a
new message to a thread, answer to an existing
message or open a new thread. We gathered the list of
threads, the list of messages for each thread, the
content of each message, time of the message, users
and the citations between users (i.e. if a user replied
to another user). There were approximately 3,754
messages regarding the Raytheon stock examined,
written in about 3,419 threads by about 533 users. We
then extracted data four months before the Syrian
uprising in 2011 and the period after until December
2011.
2.3 Aerospace and Defence Industry
The U.S. aerospace and defence industry is the
world’s leading innovator and producer of
technologically advanced aircraft, space and defence
systems and supports one of the largest high-skill and
high-wage workforces in the U.S.A. There is both a
commercial side and military side to the industry.
Some of the firms are involved in building
commercial aircraft and from the military standpoint
the U.S. government is the principal customer. The
industry boasts of heavy investment in research and
development with the U.S. government funding a
high percentage of these costs. The U.S. government
also exerts huge influence over the industry through a
tender process for contract procurement to each of the
aerospace and defence firms. These contracts are
issued by the US Department of Defence and defined
by military branch such as U.S. Marine corps, U.S.
Navy, U.S. Army and U.S. Air Force.
We used a set of seven aerospace and defence sector
stocks known as “war stocks” to establish if there
were any significance prices changes after the attacks
within the US aerospace and defence sector. The war
stocks listed in table 1 are medium and large
capitalisation US manufacturing companies that
manufacture military equipment. The column
capitalisation is the market capitalisation of each
stock in billions of dollars, while the figure in
parentheses is the relative size of each stock over the
capitalisation of all seven stocks for May 2018. The
war stocks have a total capitalisation of $671.91B
which represents about 2.6% of the capitalisation of
the S+P 500 index.
Table 1: War stocks considered in the study.
Stock Ticker Capitalisation
Honeywell HON $108.76B (16.18%)
United Tech UTX $96.52B (14.36%)
Lockheed Martin LMT $92B $(13.69%)
General Dynamics GD $60.09B (8.94%)
Northrop Grumman NOC $26.5B (8.66%)
Raytheon Co. RTN $59.06B (8.79%)
Boeing BA $197.2B (29.35%)
2.4 Network Metrics
To describe and illustrate each network the following
metrics were used
(i) Number of nodes N: The number of nodes
represents the number of terrorists active in the period
of observation. For the online financial network, the
number of nodes represents the number of users
active in the period of observation.
(ii) Number of edges : There is an edge from
terrorist a to terrorist b if terrorist a communicated
with terrorist b. The number of edges is a measure of
the interactions between terrorists. For the online
financial network similarly, there is an edge from user
a to user b if a replied to b (at least once). The number
of edges is a measure of the interactions between
users.
(iii) Clustering Co-efficient CC: To understand how
the network behaves it is necessary to segregate the
nodes into cliques. A clique is simply a subgraph
where all nodes are more loosely tied to one another
than they are to nodes that are not part of the graph.
It depicts closeness of the groups within the terrorist
WEBIST 2018 - 14th International Conference on Web Information Systems and Technologies
174

and online networks. Thus, the clustering coefficient
of a graph ranges between 0 and 1, with higher values
representing a higher degree of “cliquishness”
between the nodes. In particular, a graph with
clustering coefficient of 0 contains no “triangles” of
connected nodes, whereas a graph with clustering
coefficient of 1 is a perfect clique. (Watts and
Strogatz, 1998) found that high clustering and short
characteristic chain length are the distinctive
properties of many small-world networks.
(iv) Average Shortest path ASP: There is a constant
dynamic between keeping the network hidden and
actively using it to accomplish objectives (Baker and
Faulkner, 1993). Contextually we use the average
shortest path to indicate a level of secrecy and observe
the information flow of the networks. It’s a measure
of the average distance between each distant member
of both the terrorist and online networks. The
measurement shows the diffusion of information
sharing on the networks. This is desirable for a
network in terms of secrecy because in a clustering
topology less individual members are exposed to
information and communication (Ozgul and Erdem,
2015)
(v) The Modularity measurement defined herein as
M, is the calculation of edges in the communities
minus the expected number of edges in terror and
online networks. That fact that modularity helps
define if groups are working closely knit conveys
useful information in regards to the group’s behaviour
and communication flow both in terms of efficiency
and secrecy.
(vi) Density herein as Den (n). Network density
represents the number of ties in a network as a ratio
of the total number of maximum ties that are possible
with all the nodes in a network. A fully connected
terrorist and online network has value of 1, which
indicates all nodes are connected to each other. A
network with a density of near 0 indicates that the
terror and online networks are sparsely knit. Density
is a measure of the networks cohesiveness.
(vii) Diameter herein as D( n), represents how far
nodes are away from each in the network
(viii) E, Efficiency (harmonicclosnesscentrality)
refers to the networks ability to carry out terrorist
operations as computed from the mean to mean
person distances. The metric is used here to calculate
if one terrorist was removed from their network could
the network still carry out its tasks? Using (0,1) with
1 being the highest.
(ix) AD, Average Degree is used herein to calculate
the average links per node on each of the networks
2.5 Representation of Terror Networks
and Online Financial Community
The notation for the terrorist networks is ℵ
and ℵ
.
ℵ
represents the network of terrorists before the
terrorist attack , while ℵ
the network of terrorist
after the event. The notation for the online financial
community network is the following. We call ℵ
()
and ℵ
() the networks of online users for the stock
built considering all the messages about stock
posted at day
± where
is the timestamp of
event
and is the number of days. ℵ
()
represents the network of investors before the
geopolitical, military or terrorist event
, while
ℵ
() the network after the event. The geopolitical
event here is the commencement of the Syrian
uprising in March 2011. The stock is Raytheon. To
build out the networks we used Gephi. It is a modular
and extensible open-source network visualisation
platform. It focuses on visualisation and
manipulation, simplicity and extensibility (Bastian et
al, 2009). Gephi is commonly known as graph
database software. We converted the terrorist public
domain datasets in the Gephi format and uploaded
same into the database and ran the graph simulation
function to create the network. We then performed the
social network analysis using the Gephi functions.
For the “Raytheon” stock online financial community
we used a python parser to web scape the messages
from Yahoo finance. We formatted the findings and
used Gephi to create the network and perform social
network analysis.
2.6 War Stock Price Methodology
To compute the war stock price returns we need to
identify a methodology to classify the daily returns,
so given a stock and a terrorist event
∈ℰ, we use
the following notation:
() is the price of stock
on the day
, while
±
() is the closing price of
stock on t+1 . The return of each stock (also called
the gain of a stock) is denoted by G. For instance,
±
() is the gain of the stock after +1 days
from the previous day for event
. By definition it is:
(
)
=
(
)
()
()
,
(
)
=
(
)
(
)
(
)
The Terror Network Industrial Complex: A Measurement and Analysis of Terrorist Networks and War Stocks
175
3 ANALYSES
3.1 SNA Metrics Analysis
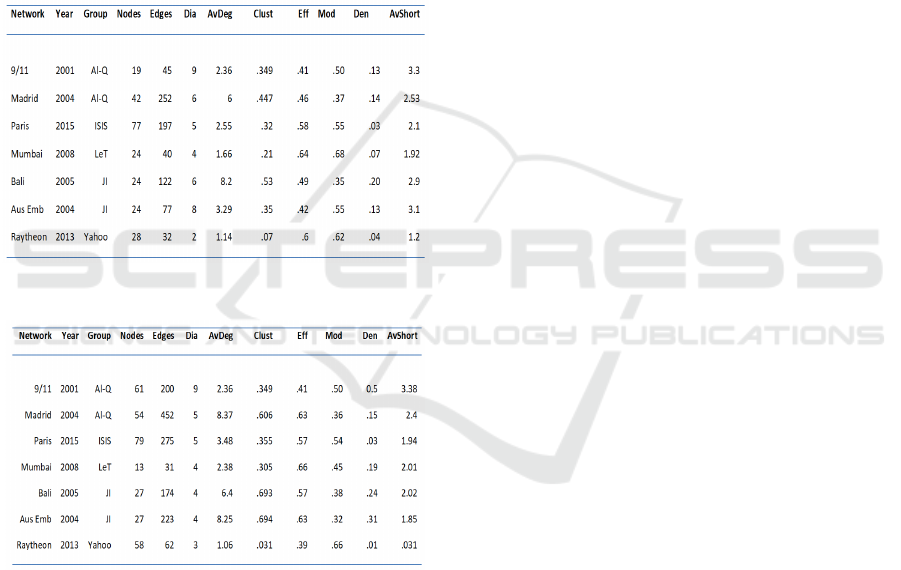
Figures 2 and 3 illustrate the SNA metrics per terrorist
group per attack one year before and the day after the
attacks respectively inclusive of the Raytheon online
Yahoo! financial community. The before and after
dates taken for the Raytheon network represents the
four months period before the Syrian uprising of
March 2011 and the after period right up until
December 2011. We use the Raytheon online
financial network for comparability only. The before
and after networks show the following metrics about
the terrorist groups and attacks.
Figure 2: One year before terror attacks.
Figure 3: Network after the terror attacks.
(i) Diameter: Al-Qaeda and Jemaah Islamiyah ensure
that the ability to get from one side of the network to
the other with information or just in terms of
communication before the attacks is difficult. This is
evident during the 911 and Australian embassy
campaigns. In the after networks Al-Qaeda and ISIS
maintained large diameter infrastructures,
theoretically to avoid penetration. This is important
because it tells us how quickly information will
spread through the network and also how integrated
different components within the network are likely to
be. Making a connection within a network or
traveling from one node to another incurs a cost.
Regarding terrorist groups that cost is usually the risk
of identification of its members. It typically costs
some resource, whether this is the risk of losing a
member, to the identification of a core or subordinate
member of the network. The further a terrorist has to
travel along a network to get from node a to node b
the more it will cost and the less likely it will occur,
with the result being a lower level of integration from
the group leaders and a layer of secrecy. In
comparison to the terrorist networks the online
financial network exhibits the smallest diameter thus
confirming a network that is not of a clandestine
nature.
(ii) Average Degree: Al-Qaeda and JI are the most
connected networks before and after the attacks. The
average number of links per nodes were highest in the
Bali, Madrid and the Australian embassy attacks. We
can use the average degree as a measurement of
cooperative behaviour amongst the terrorists. On
average each terrorist had on average between 6 and
8 connections. The Raytheon network is not a highly
connected network as nodes have average degree of
1, demonstrating the contrary, a low level of
connectivity in the network.
(iii) Clustering: In general, a clustering method
attempts to reorganise some entities into relatively
homogeneous groups. These groups have a purpose
moreover based around function. According to (Raab
and Milward, 2003) these microstructures are
prevalent amongst terrorist groups. On the contrary
(Helfstein and Wright, 2011) argued that clustering
does not exist in terrorist networks as it minimises
secrecy. Our study shows that Al-Qaeda and JI
demonstrate a higher-level degree of “cliquishness”
for the Bali, Madrid and Australian embassy attacks.
In an overall context all of the Islamic terrorist groups
displayed a high level of “cliquishness” amongst their
organisation structure.
(iv) Efficiency: For the ease of communication or
resilience of the network or indeed the capacity of the
network to function in the face of adversity or
disruption (Krebs, 2002). As we know none of the
networks were incapacitated, all attacks were carried
out with devastating consequences. Therefore, if
intelligence communities did capture some of the
suspects before the attacks, we now know none of the
networks were encumbered. If the network structure
is defined by the network aim (Morselli,2007)
conventional wisdom would suggest that a terrorist
network would aim to reduce any risk associated with
revealing its members and its core aim. Looking at
WEBIST 2018 - 14th International Conference on Web Information Systems and Technologies
176

efficiency and its inverse value secrecy we see that
LeT and ISIS were prepared to risk members of the
groups in terms of efficiency during the Mumbai and
Paris attacks. On the contrary, Al-Qaeda valued
secrecy more than efficiency in terms of their
organisational structure.
(v) Modularity: The ability to detect community
structures in terrorist groups is of significant practical
importance. It provides a mechanism to identify what
functions of the sub sections of the terrorist groups
are actually performing. Alternatively, modularity
may expose the fact that no communities exist at all.
(Krebs 2002) highlighted the importance of
modularity in addition to the importance of secrecy.
This was a feature of the Al-Qaeda 911 organisational
structure where Osama Bin Laden ensured that no
single module within the 911 network knew another
module. Considering the networks are preferential
connected networks our analyses shows that a high
level of modularity exists within these groups. LeT,
ISIS and Al-Qaeda display high modularity in the
before and after attacks. Interestingly, the Raytheon
network shares the same characteristic as the terrorist
networks where you have a high level of communities
working separately where nodes are connected "more
densely" to each other than to the nodes in other
communities.
(vi) Density: Refers to the portion of a network that
are connected. In theory, according to (Krebs 2002,
Natarajan 2000, Raab, and Milward 2003) terrorist
networks are sparse and show low density. In
evaluating the hypothesis that these networks need to
remain clandestine, we can conclude that our findings
reveal that the low density does exist. ISIS and Al-
Qaeda show lower density in the before and after
attacks suggesting a higher degree of intelligence in
terms tradecraft and education (Helfstein and Wright,
2011). This bears true in the fact that the ISIS and Al-
Qaeda operatives were trained by the CIA.
(vii) Average Shortest Path: The shortest path
between two nodes with the minimum number of
edges. It can be seen as a measurement of the
efficiency of information on the network. Where vital
intelligence needs to be distributed across the
network, clearly it will reach nodes quicker if there
are only 4 steps from any other node than if it is a
hundred steps from any node. ISIS and LeT are
prominent in efficient flows of intelligence on their
before networks whilst the Al-Qaeda structure before
and after the attacks are more concerned with making
it difficult to penetrate their networks relying a more
veiled approach. In terms of comparability we can see
that Raytheon’s network consists of the shortest
average path, which would make sense in terms of
reciprocal communication within the online
community.
3.1.1 Average Nodes Before and After
We performed a collective averaged terrorist attack
analysis of the SNA metrics using the averages of
nodes, edges diameter, average degree, clustering,
efficiency, modularity and the average shortest path.
Table 2 illustrates each SNA metric and time interval,
the value of the before and after network along with
the augmentation (in percentage) if any and the output
of the statistical test for the terrorist networks only.
We computed a Wilcoxon signed rank test to
calculate the results. The after-network edges indicate
there was increased communication between the
terrorists during and after the attacks. ++ indicates the
values of the after network are greater than the values
of the network at .95% confidence level. + indicates
a 90% confidence level. Where WT = then no
significant difference in after network. The absolute
value of each indicator is important in order to
understand not only if the difference is significant for
the averaged terrorist attack, but also if the absolute
value of the indicator suggests a significant statistical
difference in these attacks.
Table 2: SNA indicators for before and after networks.
Metric After Bf %
Diff
Z WT
()
43.5 35 .242 .172 =
()
225.8 120.5 .874 .046 ++
Dia(N) 5.16 6.33 -0.184 .109 =
Aver (D) 5.35 3.40 0.573 .028 ++
()
0.49 0.37 0.324 .046 ++
()
0.57 .50 0.139 .116 =
()
0.44 .50 -0.12 .463 =
()
2.26 2.66 -.150 .116 =
()
0.17 .12 .416 .173 =
There are notably three statistical differences such
that the edges, average degree metric and the
clustering coefficient increased in the after networks.
This alludes to the fact that communication increased
during and after the attacks which is reflective of the
increase of edges in the after networks. The average
degree per terrorist also increased indicating
increased communication amongst the terrorist
The Terror Network Industrial Complex: A Measurement and Analysis of Terrorist Networks and War Stocks
177
groups during and after the attacks. The clustering
coefficient refers to the cliquishness of nodes within
the networks suggests that terrorists who undertook
the attacks actually knew each other and worked in
homogeneous groups during and after the attacks.
3.1.2 Terrorist Leadership Analysis
We analysed the role of leadership within the various
terror attacks by computing the average in degree
communication for directed networks for each of the
attacks before and after and aimed to understand how
communication was managed. In-Degree centrality of
observed nodes is the number of direct links to other
nodes. A superior value of in-degree centrality often
considers the node as the most prominent individual
in the network. Nodes were determined as leaders in
the first three instances for each attack with the
highest in-degree centrality. The WT statistical test
results show that communication from the terrorist
group leaders didn’t change before and during the
attacks however communication increased
significantly during the attacks from the other
members of the terrorist groups.
Table 3: The average In -Degree of terrorist group leader
and their subordinates before and during the attacks.
After Before %Diff Z WT
Terrorist
leader
14.99 10.72 .398 .104 =
After Before Diff Z WT
Terrorists
4.11 2.81 .462 .046 ++
3.1.3 Strong and Weak Communities
Structures
Strong communities have more links within their own
community than with the rest of the network. Such
that
(
)
(
)
where
of the node i is
the number of links that connect i to the rest of the
network. c is the cluster. The external degree
is
number of links that connect i to the rest of the
network. To detect weak and strong communities per
group, we examined the modularity at a more
granular level. We computed using an overall
percentile ranking approach inclusive of all terrorist
groups to detect the weak community modules within
each network. We then computed an analysis of
variance per group to test if there were any statistical
differences. We found that LeT group has the weakest
communities within their organisational structure
where 5 of their 6 communities were ranked under a
30% percentile. Whilst Al-Qaeda had the strongest
communities such that the lowest ranked community
ranked at the 50% percentile rate for the 911 attacks
whilst one community ranked at a 10% percentile for
the Madrid attack.
Table 4: LeT Analysis of variance for weak community
structures.
Group Groups Mean
Diff
√
P-val Sig
LeT JI -.35% .136 .068 +
ISIS -.40% .136 .031 ++
Al-Q -.54% .124 .001 ++
3.2 VIX and Abnormal Returns
Historical prices for the war stocks and the S+P500
adjusted for splits and dividends were collected from
Yahoo! Finance. To understand if the terror attacks
were associated in periods of high volatility and
abnormal returns, we measured the market variance
using the VIX index calculated with a 50-day moving
average. This is a market indicator for the
measurement of uncertainly.
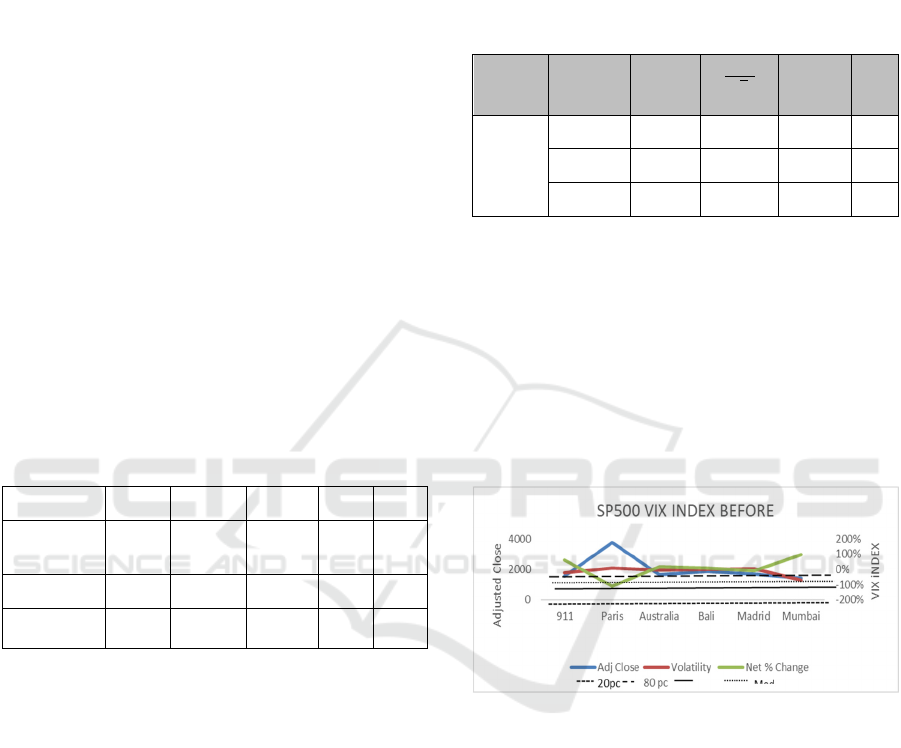
Figure 4: Before VIX SP500 Index with adjusted close and
Net % Change.
Figure 4 shows the implied volatility the day before
the terror attacks, a 90-percentile level, a 10-
percentile level, the average and the median
computed over the periods of observation. The
computation indicates that only two of the events
were in a period of high volatility (above 80
percentile level), that being the Paris and Madrid
attacks. The Australian and Bali attacks were
positioned within average volatility whilst the 911
and Mumbai attacks happened in lower level
percentile of 20%. We can conclude that these
terrorist attacks happened in periods of mixed
volatility. Abnormal S+P500 returns were also
characterised in a mixed return period with Paris and
Madrid attacks aligned to the 80-percentile level, Bali
WEBIST 2018 - 14th International Conference on Web Information Systems and Technologies
178
and the Australian embassy attacks showing average
S+P500 returns for the period and 911 and Mumbai
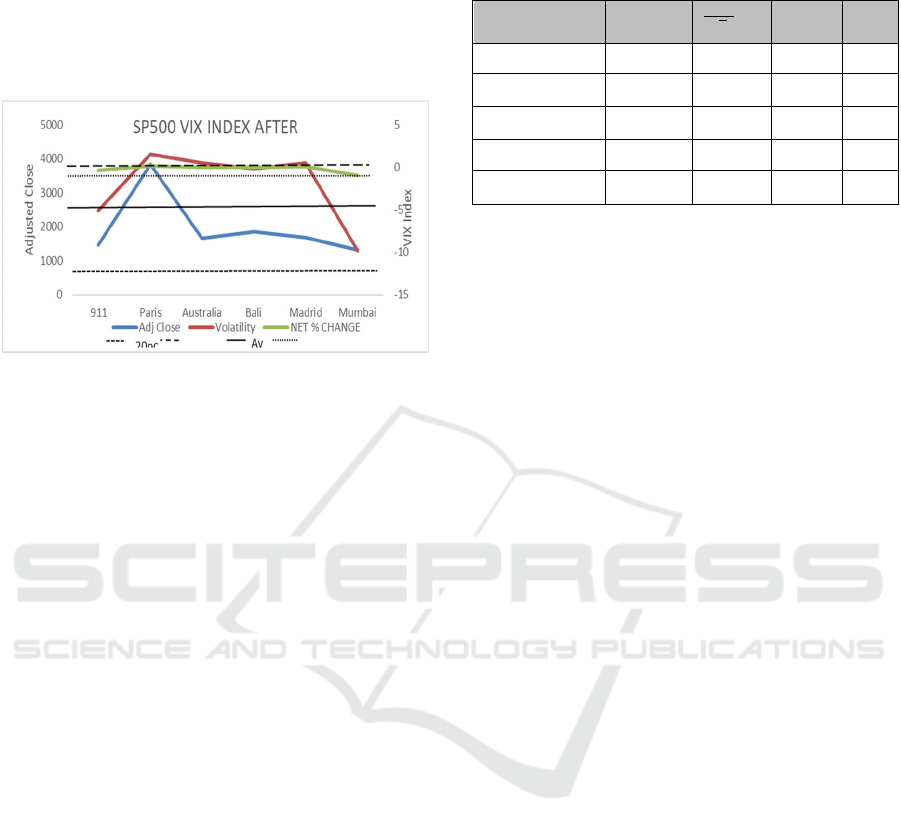
presenting below the 20-percentile level. A T-Paired
test concluded that there was no significant difference
between the before and after VIX model. The after
VIX is shown in figure 5.
Figure 5: VIX SP500 Index with adjusted close and Net %
Change.
To conclude, we can state that apart from the Paris
and Madrid attacks which both showed high volatility
and higher abnormal returns, the terrorist events can
be categorised as normal.
3.2.1 War Stocks and S+P500 Price
Reaction to Attacks
We tested using a T-paired test to establish if the price
of the war stocks differs significantly after the
terrorist events from the price before the said terrorist
attacks. We did likewise with the S+P 500 prices in
addition to comparing the prices of the war stocks to
the S+P 500 price changes. We wanted to understand
if the war stocks behave the same way as the market
after terrorist attacks. To compare price changes of
the war stocks against the S+P 500, we computed an
aggerated price index for the war stocks in the same
way the S+P 500 is calculated. The results from Table
5 show that whilst the aerospace and defence stock
prices and the S+P 500 are lower after the attacks,
there is no significant statistical difference. However,
the aerospace and defence stocks outperformed the
S+ P500 one day after the terrorist attacks with a
confidence level of 0.95 and t value of -5.41. We
measured the aerospace and defence stock price
difference one month before and after the terrorist
attacks and found that prices were statistically
significantly lower after the terrorist attack with a
confidence level of 0.95 and t value of 2.62, however,
the market did recover significantly after a month
with a confidence level of 0.95 and t value of 3.8.
Table 5: Comparisons between war stocks, S+P 500 and
war stocks V S+P 500 before and after terrorist attacks.
Indicators Mean
Diff
√
t-
value
Sig
.
.07% 2.81 .177 =
.
4.41% 50.24 .215 =
.
-.19% 878 -5.41 ++
.
1.40% 3.48 2.62 ++
.
22.89 14.7 3.8 ++
4 RESULTS
We find that Islamic terrorist groups and terrorist
attacks share similar characteristics. Little similarity
exists between the terrorist networks and the online
financial community network.
(i) We can see that the Islamic terrorist groups
increase recruitment over a period a year period
leading into the attacks. This is evidenced by the
increase in the number of nodes joining the terrorist
networks.
(ii) Communication increases within the terrorist
groups with notable higher interaction during and
after the attacks again evidenced with the increases in
edges on the networks. Furthermore, the average
communication between each terrorist increases
during and after the attacks as noted with the
increases in the average degree.
(iii) Terrorist group leader’s communication
frequency didn’t change before and during the attacks
however communication increased significantly
during the attacks from other members of the terrorist
groups.
(iv) A high level of “cliquishness” exists within the
networks indicating that each clique or sub group
performs a particular role or function supporting the
attack.
(v) Low density is a common feature of the Islamic
terrorist groups and is a mechanism deployed to
protect identity and objectives.
From an individual terrorist group perspective, we
found the following:
(vi) The Al-Qaeda organisational structures
demonstrate superior formation in terms of diameter,
clustering, modularity and density. The principle aim
of the group is to protect its members and retain a veil
of secrecy from inception of the attack to the
completion of the mission. The Al-Qaeda
The Terror Network Industrial Complex: A Measurement and Analysis of Terrorist Networks and War Stocks
179

organisation structure consists of large diameters to
avoid penetration, low efficiency making it harder to
contact various group members. Low density
ensuring that only certain cliques on the networks are
connected and others are not. A high average shortest
path metric essentially confirms that trading
efficiency for secrecy is of vital importance to the
group. Much of these structures would correlate to
clandestine organisational structures deployed by the
CIA when training Mujahideen operatives during the
Soviet Afghan war in the late 70’s early 80’s. Jemaah
Islamiyah share similar characteristics but not as
superior. Al-Qaeda also inherit stronger community
structures within their organisation.
(vii) Remarkably, the ISIS organisation structure
tends to trade secrecy for efficiency as deliberated by
the social network metrics. Whilst an effort is made
to reduce density in their network, it is boosted by a
high metric for efficiency and low average shortest
path metric. Similarly LeT also appear to more
concerned with efficiency rather than allowing
members to be captured or identified.
The aerospace and defence sector analysis in this
study found that:
(viii) War stocks and the S+P 500 are lower the day
after terrorist’s attacks in this study, however the war
stocks outperformed the S+ P500 one day after for the
aforementioned attacks. Findings indicated that war
stocks were significantly lower one month after the
attacks but the S+P 500 rebounded one month after
the attacks.
5 RELATED WORKS
Krebs uncloaked terrorists in his paper (Krebs 2002).
He demonstrated the superiority of social network
analysis in identifying terrorists. His paper focused on
newspaper articles in the media about the 911
terrorists. He highlighted the fact that terrorist
networks are structured to protect their members and
protect objectives and secrecy. (Raab and Milward,
2003) and (Helfstein and Wright, 2011) support and
concur with Krebs hypothesis. Whilst this is evident
in our analysis for Al-Qaeda, it is not evident for other
groups such as LeT and ISIS. (Morselli, 2007) argued
that various exogenous and endogenous factors may
come into play. (Baker and Faulkner, 1993) stated
that terrorist networks can be structured in simple or
complex fashion based on information requirements
depending on your rank or requirement for receiving
data regarding the group or attack activity.
Interestingly, (Choudhary et al, 2016) used an
analytical hierarchical model combined with
centrality measurement to rank key players, identify
centrality and rank terrorists. To this end some find
that terrorist networks are decentralised (Helfstein
and Wright, 2011) or centralised (Baker and
Faulkner, 1993). (Morselli, 2007) in his paper looks
at the network characteristics in terms of efficiency
whilst (Krebs 2002) and (Raab and Milward, 2003)
state efficiency as the resilience of the network.
Conventional wisdom would suggest that any
network that has not been disrupted and has the ability
to carry out its functions and successfully complete
the attack would be both efficient and resilient.
However, that does not appear to be the case,
considering one group may trade efficiency for
secrecy whilst still carrying out a successful attack.
(Krebs, 2002) stated that successful networks work
off decentralised structures with a central node
structure as characterised by his identification of
central node and mastermind Mohammad Atta in his
paper. Networks can or cannot contain internal
working communities. (Gill and Freeman,2013)
identified that clustering exists within terrorist
networks and is a prominent feature, on the contrary,
(Helfstein and Wright, 2011) found that terrorist
networks in some cases do not display a high level of
clustering. Interestingly, our study shows the
clustering coefficient is evident for all groups in our
study. Density is closely associated with secrecy
(Morselli 2007, Helfstein and Wright, 2011) and
again this is a noticeable feature in our study and
concurs with the said authors.
6 CONCLUSION
This study analysed multiple Islamic terror networks
in terms of their efficiency, communication and
composition of network metrics. The study found that
Islamic terrorist groups deploy similar characteristics.
Our study showed Islamic terrorist groups increase
recruitment during the planned attacks, communica-
tion increases during and after the attacks between
subordinate terrorists, and low density is a common
feature of Islamic terrorist groups. The Al-Qaeda
organisation structure was the most complex and
superior in terms of secrecy, diameter, clustering,
strong community modularity and density followed
by Jemaah Islamiyah. The ISIS and LeT
organisational structures were concerned with
efficiency rather than secrecy and therefore, were
more prone to penetration from the intelligenza
communities. War stocks decreased after terrorist
events and outperformed the S+P 500 the day after
WEBIST 2018 - 14th International Conference on Web Information Systems and Technologies
180

the attacks but were lower one month after the attacks
whilst the market rebounded one month later.
Future studies will include analysis of terrorist
networks with prediction models using Twitter-based
communities during terrorist attacks and their effects
on the aerospace and defence sector.
REFERENCES
Crossley N, Stevenson R, Edwards G, and Harries E.
(2010). Covert Social Movement Networks: A Report
for the British Home Office.
Krebs VE. (2002). Mapping terrorist networks.
Connections 24 (3): 43-52.
Everton SF. (2011). Network Topography, Key Players and
Terrorist Networks. Connections 32 (1): 12
Baker WE, and Faulkner RR. (1993). The social
organization of conspiracy: Illegal networks in the
heavy electrical equipment industry. American
sociological review: 837-860
Natarajan M. (2000). Understanding the structure of a drug
trafficking organization: a conversational analysis.
Crime Prevention Studies 11: 273-298.
Koschade S. (2006). A social network analysis of Jemaah
Islamiyah: The applications to counterterrorism and
intelligence. Studies in Conflict & Terrorism 29 (6):
559-575.
Morselli C, Giguire C, and Petit K. (2007). The
efficiency/security trade-off in criminal networks.
Social Networks 29 (1): 143-153.
Demiroz F, and Kapucu N. (2012). Anatomy of a dark
network: the case of the Turkish Ergenekon terrorist
organization. Trends in organized crime 15 (4): 271-
295.
Enders W, and Su X. (2007). Rational Terrorists and
Optimal Network Structure. The Journal of Conflict
Resolution 51 (1): 33-57
http://www.terrorism-info.org.il/en/c/al-qaeda/ [ONLINE]
Available at: http://www.terrorism-info.org. [Accessed
15 Feb 2018].
Watts and Strogatz (1998) D. J. Watts, and S. H. Strogatz,
"Collective dynamics of 'smallworld' networks",
Nature, 393, (1998), 440-442
Ozgul F., Erdem Z. (2015) Resilience of Criminal
Networks. In: Agarwal N., Xu K., Osgood N. (eds)
Social Computing, Behavioral-Cultural Modeling, and
Prediction.
Bastian M., Heymann S., Jacomy M. (2009). Gephi: an
open source software for exploring and manipulating
networks.
Raab J, and Milward HB. (2003). Dark Networks as
Problems. Journal of Public Administration, Research
and Theory: J-PART 13 (4): 413-439.
Helfstein S, and Wright D. (2011). Covert or Convenient?
Evolution of Terror Attack Networks. Journal of
Conflict Resolution 55 (5): 785-813.
Gill J, and Freeman JR. (2013). Dynamic elicited priors for
updating covert networks. Network Science 1 (01): 68-
94.
Choudhary, Pankaj & Singh, Upasna. (2016). Ranking
Terrorist Nodes of 9/11 Network using Analytical
Hierarchy Process with Social Network Analysis.
Josep A. Rodríguez and José A. Rodríguez and José A.
Rodríguez, The March 11th Terrorist Network: In its
weakness lies its strength.
Gutfraind, A., & Genkin, M. (2016). A graph database
framework for covert network analysis: An application
to the Islamic State network in Europe. Social
Networks. DOI: 10.1016/j.socnet.2016.10.004
Azad S, Gupta A (2011). A quantitative assessment on
26/11 Mumbai attack using social network analysis.
J Terror Res 2(2):4–14
Transnational Terrorism database. 2018. http://doitapps.
jjay.cuny.edu/jjatt/data.php. [ONLINE] Available at:
http://doitapps.jjay.cuny.edu/jjatt/data.php. [Accessed
12 Jan 2018].
Pierpaolo Dondio and James Usher. (2017). Analysing the
behaviour of online investors in times of geopolitical
distress: a case study on war stocks. In Proceedings
of the International Conference on Web Intelligence
(WI '17). ACM, New York, NY, USA, 275-283.
The Terror Network Industrial Complex: A Measurement and Analysis of Terrorist Networks and War Stocks
181
