
Flow Neurophysiology in Knowledge Work: Electroencephalographic
Observations from Two Cognitive Tasks
Michael T. Knierim
1
, Mario Nadj
1
, Anuja Hariharan
1,2
and Christof Weinhardt
1
1
Institute of Information Systems & Marketing, Karlsruhe Institute of Technology, Fritz-Erler-Str. 23, Karlsruhe, Germany
2
Opitz Consulting, Leitzstr. 45, Stuttgart, Germany
Keywords: Flow, Neurophysiology, Knowledge Work, Physiological Computing, Bio-Adaptive Systems.
Abstract: In an effort to study flow experiences in the context of less structured knowledge work (KW), we explored a
paradigm we call controlled experience sampling (cESM). Participants worked on a naturalistic, cognitive
task (a personal scientific thesis), and a difficulty-manipulated math task. Results show that the cESM
approach elicits a consistent flow experience with intensities as least as high as in the math task flow condition.
An interesting finding is that given similar flow intensities, different perceptions of stress arise between the
two paradigms. EEG results from both tasks suggest increased frontal upper alpha band (10-12Hz) activity
with increased task attention, that has higher temporal stability in flow than in a boredom condition, and that
is laterally indifferent. Integrating with the presently available literature, the results further consolidate an
understanding of flow as a state of fronto-lateral activation.
1 INTRODUCTION
The experience of flow, where the individual is
completely involved in a challenging task
(Csikszentmihalyi, 1996), is deemed a beneficial state
in the work environment due to its links to improved
performance and well-being (Spurlin and
Csikszentmihalyi, 2017). As the requirements for
flow are complex (e.g. absence of distractions,
structure of the task, state of the individual, etc.) (Ceja
and Navarro, 2012), flow facilitation at work is still a
central challenge (Spurlin and Csikszentmihalyi,
2017). However, the recent advancements on the
biological basis of flow (Harris et al., 2017; Knierim
et al., 2017) highlight promising avenues for
supportive bio-adaptive systems (Rissler et al., 2018).
Within the emerging research a central focus lies on
highly controlled game tasks (Moller et al., 2010),
leaving gaps to understand flow neurophysiology in
more unstructured tasks typical to knowledge work
(KW). Furthermore, the focus on artificial laboratory
tasks has been argued to be a central limitation in
studying the (flow) experience of effortless attention
(Hommel, 2010). Therefore, in an attempt to increase
external validity and naturalistic character of flow
laboratory research we propose the adaption of the
experience sampling method (ESM)
(Csikszentmihalyi and Hunter, 2003) to the
laboratory setting. This adaption signifies a controlled
approach (cESM) prompting individuals to work on a
personalized KW task during observation with
neurophysiological sensors and through repeated
interruption in order to “catch flow in the act”. By
comparing observations to a validated flow induction
paradigm, the main research question of how well the
cESM approach can elicit flow is to be answered.
Furthermore, while there have been serious
advancements in the field of brain-computer
interfaces that keep extending the applicability of
real-time neuroimaging to in situ phenomena like
attention, operator workload and engagement
(Blankertz et al., 2016; Ewing et al., 2016; Kosti et
al., 2018), the study of neural correlates of flow in
more externally valid scenarios is still sparse
(Katahira et al., 2018). In general, the knowledge of
how flow can be described using neural measures still
lacks of repeated insights, which is why this work fills
several important gaps. Overall, our work contributes
to flow research by: (1) advancing the understanding
of flow elicitation in laboratory settings in the context
of KW, and by (2) extending flow neurophysiology
knowledge by consolidation of related work, across
task analysis and study of high interest brain regions.
42
Knierim, M., Nadj, M., Hariharan, A. and Weinhardt, C.
Flow Neurophysiology in Knowledge Work: Electroencephalographic Observations from Two Cognitive Tasks.
DOI: 10.5220/0006926700420053
In Proceedings of the 5th International Conference on Physiological Computing Systems (PhyCS 2018), pages 42-53
ISBN: 978-989-758-329-2
Copyright © 2018 by SCITEPRESS – Science and Technology Publications, Lda. All rights reserved

2 BACKGROUND
2.1 Flow Theory
Flow research spans contexts like arts (de Manzano et
al., 2010), gaming (Moller et al., 2010; Harmat et al.,
2015), or writing (Csikszentmihalyi, 1996; Erhard et
al., 2014) and has found the state to occur remarkably
similar across contexts. The experience is described
in nine dimensions, that are classified temporally (see
Table 1).
Table 1: Flow Experience Components (cf. Nakamura and
Csikszentmihalyi, 2009).
Component Class
1) Challenge-skill balance Antecedents
2) Clear Goals
3) Unambiguous Feedback
4) Action-Awareness Merging During
Experience
5) Sense of Control
6) Loss of Self-Consciousness
7) Transformation of Time
8) High Concentration
9) Autotelic experience Consequences
2.2 Research Paradigms
In the past, primarily self-reports have been used to
develop flow descriptions (interviews & surveys)
(Moneta, 2012). The ESM was specifically designed
for this purpose, in order to surpass interview
limitations (e.g. recall bias) and to study flow close to
its occurrence through repeated interruption
(Csikszentmihalyi and Hunter, 2003). The naissance
of experimental flow induction has only later and
recently occurred, focusing on the paradigm of
difficulty manipulation (DM) (Moneta, 2012). The
manipulation of difficulty is used to elicit experiences
of boredom, flow, and anxiety (through
low/balanced/high difficulty). It has been criticized
whether or not the approach can elicit real flow
experiences, given the reduced motivation and
involvement common in laboratory tasks (Moller et
al., 2010), and given the elicitation of effortful
attention from novel and artificial tasks (Hommel,
2010). Other approaches have focused on
engagement (E) paradigms where participants are for
example asked to play a game and report their
experience afterwards (e.g. Labonté-Lemoyne et al.,
2016). Flow physiology research has extensively used
the DM paradigm. Based on a previous survey of 20
studies on the peripheral nervous system (PNS)
(Knierim et al., 2017) and three studies published
since then (Klarkowski, 2017; Tian et al., 2017;
Barros et al., 2018), we found that 13 of 23 studies
used this paradigm. Furthermore, 17 of 23 studies
used game tasks, a pattern similarly visible in flow
neuroimaging research (see next section). This shows
a focus with low external validity, that has led to calls
for creative laboratory research (Harris et al., 2017).
2.3 Flow Neurophysiology
Given the youth of experimental paradigms, flow
research has only recently produced increased
amounts of theoretic and empiric research on
underlying neurophysiological processes (Peifer,
2012; Harris et al., 2017). One of the first
propositions of flow neurophysiology is the reduction
of prefrontal cortex activity during flow in favour of
more implicit, automated processing of learned
behaviour (Transient Hypofrontality = TH) (Dietrich,
2004). Extending this proposition, linear reductions
of default mode network activity with flow
experience have been put forward that would
alternatively explain the experience of automaticity
and the absence of self-referential processing (Peifer,
2012; Harris et al., 2017). Furthermore, the
proposition of flow as an emergent property of highly
synchronized activity in attention and reward
networks of the brain has been highlighted
(Synchronization Theory = ST) (Weber et al., 2009;
Harris et al., 2017).
Extending the aforementioned literature review
corpus, several peer-reviewed studies of flow
neurophysiology were identified. Much of this
research has focused on hemodynamic imaging (e.g.
Ulrich et al., 2014; Harmat et al., 2015; Barros et al.,
2018). Also, there has of late been an increase in
electroencephalographic (EEG) flow research (Wolf
et al., 2015; Ewing et al., 2016; Katahira et al., 2018).
Yet there has been little consolidation of these lines
of work. For this report we decided to focus on results
on frontal brain regions, as the study of frontal
regions has been preferred often based on the early
TH account. (Dietrich, 2004). So far, for TH’s main
hypothesis of overall frontal activity reduction during
flow, little support has been found in fMRI (Ulrich et
al., 2014) and fNIRS (Harmat et al., 2015; Barros et
al., 2018) imaging studies. Instead, it appears parts of
the prefrontal cortex (PFC), specifically lateral parts,
are highly active during flow, yet the medial PFC
shows activity decreases during flow, and boredom
conditions show a more general PFC reduction
(Harris et al., 2017; Barros et al., 2018).
Frontal activity has also been reported on in most
of the related flow EEG studies, with repeated results
Flow Neurophysiology in Knowledge Work: Electroencephalographic Observations from Two Cognitive Tasks
43
supporting the region as a location of interest. While
two of these studies (Chanel et al., 2011; Berta et al.,
2013) report on the relevance of frontal activity for
the machine-learning (ML) based classification of
flow states, six other studies describe activity in more
detail (see Table 2). Aggregating the results of these
studies that primarily focused on frequency band
activity across difficulty-manipulated conditions, we
conclude several results that have not been integrated:
(1) One of the more clear findings is a difference
in frontal theta band activity in flow conditions, with
increases compared to boredom task conditions, and
either similarity between flow and overload
conditions (Soltész et al., 2014; Katahira et al., 2018)
or decreases from flow to overload conditions
indicating an inverted U-shaped relationship between
frontal theta activity and task demands (Ewing et al.,
2016). Support for theta band differentiation has also
been noted in ML research on flow classification
(Chanel et al., 2011).
(2) Repeated observations have been made for
frontal alpha activity. While some find increased
alpha power with higher flow self-reports (Léger et
al., 2014; Labonté-Lemoyne et al., 2016), within the
DM group comparison studies, findings point more to
decreases in alpha activity with increasing task
difficulty (Ewing, Fairclough and Gilleade, 2016;
Katahira et al., 2018 report the inverse relationship,
but use amplitudes as unit of analysis). ML research
also finds frontal alpha activity to be a differentiating
feature (Berta et al., 2013).
(3) Lastly, a few observations have also been
made regarding frontal beta band activity in flow,
with ML reports demonstrating differentiation
potential alone (Chanel et al., 2011; Berta et al.,
2013), left frontal beta band reductions correlated
with higher flow self-reports (Léger et al., 2014), but
also right frontal beta band increases with task
difficulty (Klarkowski, 2017).
Within this body of research, additional interesting
EEG observations have been mentioned that are lateral
differences, specifically frontal alpha asymmetry
(FAA) (Wolf et al., 2015; Labonté-Lemoyne et al.,
2016), frequency band separation, (e.g. individualized
theta, alpha band and beta band splits) (Berta et al.,
2013; Soltész et al., 2014; Ewing et al., 2016), and also
temporal differences of frequency band activity within
task conditions (Soltész et al., 2014). In this study, we
followed up on several of these in favor of an in-depth
analysis of frontal activity patterns.
3 METHOD
3.1 Materials & Procedure
Overall, 12 students (3 female) ages 21-30
participated voluntarily in our laboratory study. Each
participant worked on (1) writing for a scientific
thesis, and on (2) solving math equations in
manipulated difficulties. Scientific writing was
chosen for its challenging and frequent task nature for
scholars and students (exemplary KW). Also, writing
(scientific or literary) has previously been related to
engaging experiences in general and flow in
particular (Csikszentmihalyi, 1996; Erhard et al.,
2014; Galluch et al., 2015).
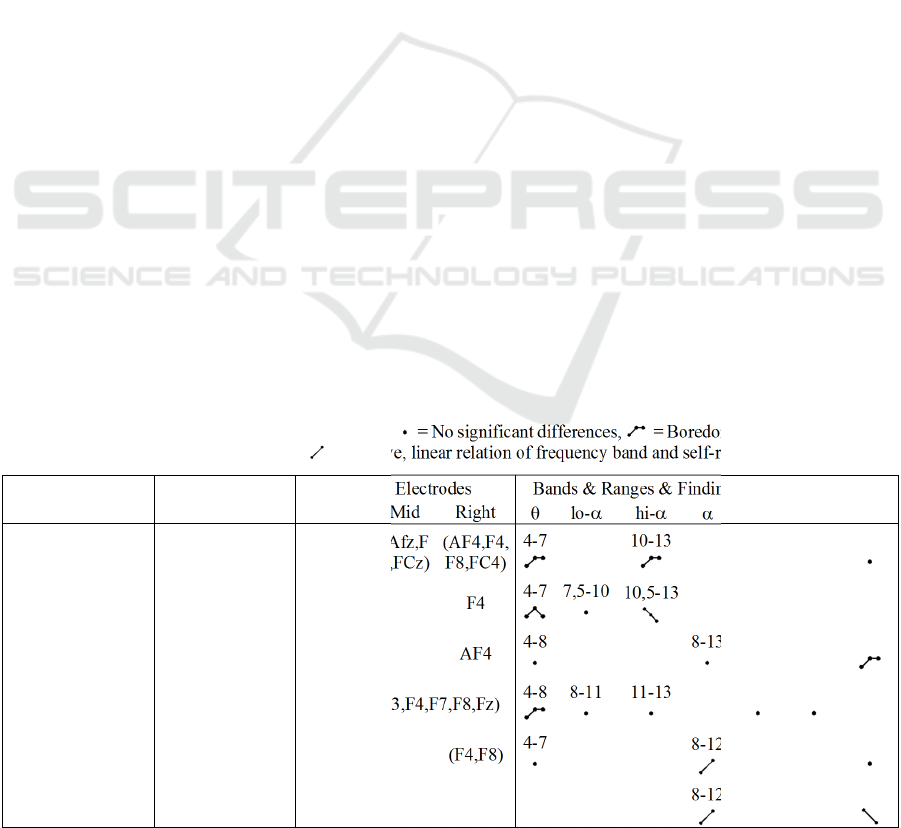
Table 2: Frontal EEG results in related work (Legend: Par. = Paradigm, Anal. = Type of analysis, (Q-)Com. = (Quasi-)
Condition comparison, Regr. = Regression EEG & self-reports, Un. = Unit of analysis, µ = Frequency amplitude, µ
2
=
Frequency power. Exemplary explanation of symbols: = No significant differences, = Boredom condition significantly
different from flow & overload condition, = Positive, linear relation of frequency band and self-report).
Reference Par. Anal. Un. Frontal Electrodes Bands & Ranges & Findings (Frontal sites only)
Left Mid Right
θ
lo-α hi-α
α
lo-
β
hi-
β
β
a
Katahira et al.,
2018
DM Com. µ
(AF3,F3,
F7,FC3)
(Afz,F
z,FCz)
(AF4,F4,
F8,FC4)
4-7
10-13
14-30
Ewing et al., 2016 DM Com. µ
2
F3
F4
4-7 7,5-10
10,5-13
Klarkowski, 2017 DM Com. µ
2
AF4
4-8
8-13
13-30
Soltész et al., 2014 DM Com. µ
2
(Fp1,Fp2,F3,F4,F7,F8,Fz)
4-8 8-11 11-13
13-25
25-35
Labonté-Lemoyne
et al., 2016
E
Q-
Com.
µ
2
(F4,F8)
4-7
8-12
13-30
Léger et al., 2014 DM Regr. µ
2
F3
8-12
12-22
PhyCS 2018 - 5th International Conference on Physiological Computing Systems
44
Participants brought their own, active thesis project
(bachelor or master level) to work on for a session of
20-25 minutes. Initially they were given time to
inspect the state of their document and to define a
challenging, yet achievable goal for a writing session.
To standardize the goal setting approach the SMART
mnemonic was used (Doran, 1981). This approach
was also considered to facilitate the flow experience.
For example, setting a goal that is specific (S) (i.e.
less abstract) has been found to facilitate high quality
writing outcomes (Flower and Hayes, 1981), and
should further provide on one of the flow pre-
requisites of having a clear goal. Deriving a goal
attainment measure (M), was considered to be helpful
in fulfilling the second flow pre-requisite of
unambiguous feedback. Lastly, the focus on a
relevant (R) and achievable (A) goal, was considered
to further enhance the optimality of a task challenge.
The thesis writing software was standardized to
Microsoft Word in full-screen mode.
The math task was chosen as reference to a
validated DM task (Ulrich et al., 2014; Katahira et al.,
2018). Replicating the design by Ulrich et al., (2014),
participants sum two or more numbers. Two
adjustments were made to the design as task difficulty
was found to be too high in previous tests. The
boredom condition was adjusted so that, subjects
solved randomly drawn equations in one of three
forms (101 + 1, + 2, or + 3). The flow condition was
altered so that, difficulty was increased/decreased
when three sequential responses were
correct/incorrect. There was a constant waiting period
between trials of four seconds. The math and writing
task order was randomized. Also, the three math task
conditions were ordered randomly, which resulted in
a total count of 12 procedure variations (2 * 3!
combinations). All variations were executed once. At
the start of the experiment, participants completed
eyes-open and eyes-closed baseline phases in which
they were asked to “let their mind wander to wherever
it takes them”, to keep their eyes focused on a black
fixation cross on a white screen (in the eyes-open
phase), and to avoid unnecessary movements. The
same message and fixation cross were shown for the
washout screens prior to each math task condition and
between math and writing task. The complete
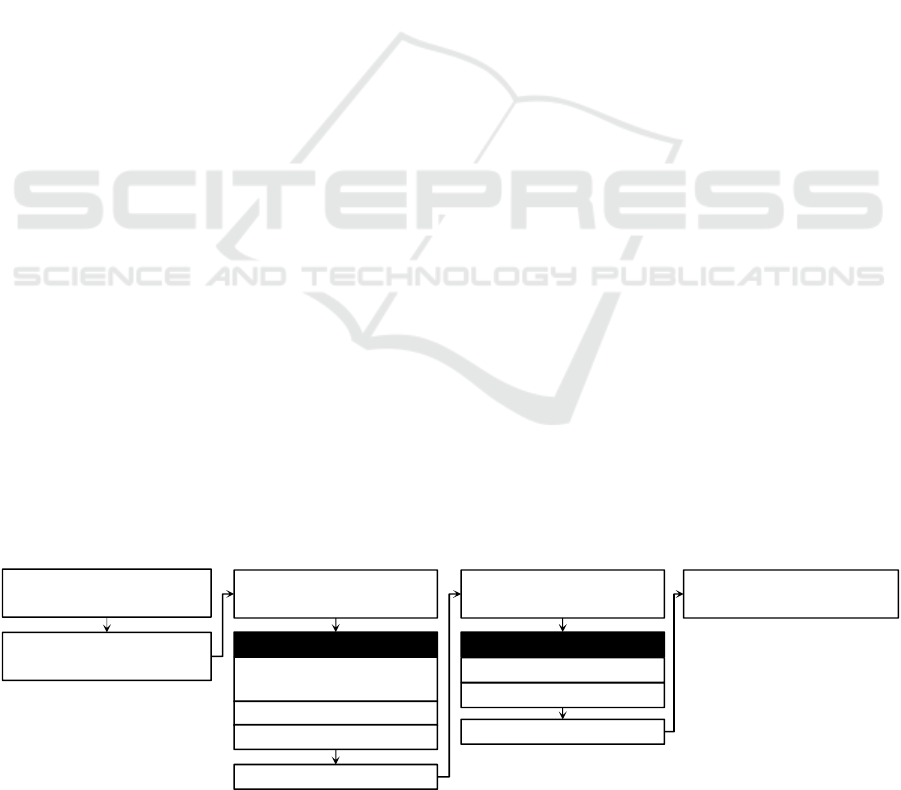
procedure is outlined in Figure 1. In the recruitment
survey participants reported mean thesis challenge
levels of 4.3 (SD: 0.98) and Wilcoxon comparisons
showed no difference in preference for writing or
math tasks (measured using three questions from
Ulrich et al., 2014).
3.2 Measures
Round questionnaires contained scales on flow and
task demand (ten item Flow Short Scale (FKS) and
one additional task demand question all by Engeser
and Rheinberg, 2008), stress (five item construct by
Tams et al,. 2014), and affect (single question arousal
SAM scale by Bradley and Lang, 1994), amongst
others. Between-task surveys included scales on task
importance (Engeser and Rheinberg, 2008). Almost
all questions used 7-p Likert scales (SAM arousal
used 9-p). Additionally, ECG data was collected in
Lead II configuration using gelled electrodes. EDA
data was collected using gold cup electrodes on the
left foot. However, we focus in this report on the
analysis of EEG data only. EEG data was collected
with an Emotiv Epoc+ headset. This 14-channel
wireless headset uses saline-based electrodes,
collecting data at a sampling rate of 256Hz. Electrode
sites are: AF3, F3, F7, FC5, T7, P7, O1, O2, P8, T8,
FC6, F8, F4, AF4 (10-20 system). Two reference
electrodes, the ‘‘common mode sense’’ (CMS) and
‘‘driven right leg’’ (DRL) are placed on the left and
right mastoids. While the headset comes with
downside regarding data quality, it has been found to
deliver adequate data for our type of study (Barham
et al., 2017) and has been used in previous studies
related to the KW context (Kosti et al., 2018), and to
Figure 1: Experiment procedure.
Preparation
Conclusion
Rest Eyes Open (5min)
Rest Eyes Closed (1min)
Introduction, Sensor
Attachment, & Start Survey
Exit Survey, Sensor
Removal, & Debriefing
Math OR (Randomized) Writing
Orientation (2min)
Goal Setting (Open)
Writing Round (3x)
Round Survey
Task Survey
Round Survey
Boredom/Flow/Overload
Randomized (5min)
Washout Screen (60s)
Orientation (3min)
Calibration (4min)
Task Survey
Math Round (3x)
Writing (7min)
Flow Neurophysiology in Knowledge Work: Electroencephalographic Observations from Two Cognitive Tasks
45

flow experiences (Klarkowski, 2017). Prior to
application of the headset, the felt-pad electrodes
were moistened with a standard 0,9%-NaCl saline
solution. After application, acceptable contact quality
was controlled for all electrode sites using the
proprietary impedance information supplied by the
manufacturer’s API.
3.3 Psychometric Data Preparation
Outliers were removed for all psychometric variables
(>2 SD from the construct mean). Distribution
normality (Shapiro-Wilk test) and homogeneity of
variances (Fligner-Killen test) did not hold for many
samples (p < 0.05), prompting non-parametric test
use. Removing one item from the stress construct
improved Cronbach’s Alpha in the math boredom
condition. Further item removal did not improve
Alpha values, which left the stress construct Alpha
level bordering a critical value of 0.6 that is deemed
acceptable in some cases (Hair et al., 2011). Given the
high internal consistency across phases (see Table 3),
and corroborating results from the arousal item, the
stress construct was retained.
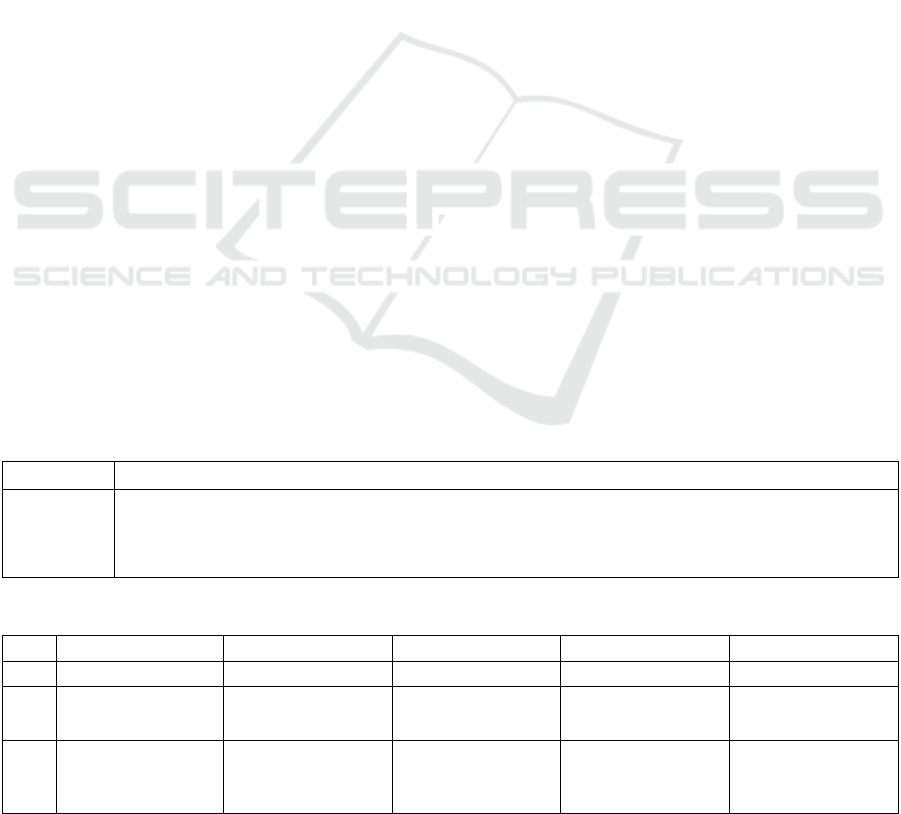
Table 3: Cronbach’s Alpha levels per experiment phase (m-
B/F/O/All = Math Boredom/Flow/Overload/All conditions,
w1-3/All = Writing round 1-3/All rounds).
mB mF mO mAll w1 w2 w3 wAll
Flow 0.68 0.88 0.89 0.80 0.77 0.98 0.93 0.95
Stress 0.84 0.58 0.78 0.84 0.84 0.78 0.90 0.82
3.4 EEG Data Pre-Processing
EEG data was processed along the guidelines of Cohen
(2014) and Picton et al. (2000). Data was processed
only for a homogenized sub-sample (three female
participants were excluded) (Picton et al., 2000). Also,
two data sets had to be excluded due to recording
failure. The retained sample for EEG analysis
comprised 7 right-handed males. Data preparation,
feature extraction, and analysis were conducted in R,
signal processing and artefact removal in EEGLab
(Ver. 14.1.1). Initially, experiment phases of interest
were extracted for each participant (eyes open baseline,
all three math task conditions, all three writing task
rounds). Channels were first centred through mean
subtraction. Afterwards, the extracted data was loaded
into EEGLab where a 0.5-45Hz bandpass, and a 50Hz
notch filter were applied. Signal data was then visually
inspected for artefact removal. First, channels that had
failed to collect data were removed. Then, paroxysmal
artefacts were removed manually. Afterwards, using
the infomax algorithm, an independent component
analysis (ICA) was performed to identify and remove
components of the data related to eye blinks and
sideway saccades (EOG artefacts). Next, data was re-
imported in R in order to extract frequency band
information for the frontal electrodes (AF3, F3, F7,
FC5, FC6, F8, F4, AF4) similar to (Ewing et al., 2016)
on the basis of 2s long epochs with 50% overlap and
tapered using a Hann windowing function. Average
band power (µV
2
) was extracted using the Fast Fourier
Transformation (FFT). Only artefact-free and
complete epochs were used for feature extraction
(epochs containing more than 95% of required
samples, i.e. > 2s * 256Hz = 512 samples). Extracted
frequency bands are: Theta (4-8Hz), Alpha (8-12Hz),
and Beta (12-30Hz). Also, for the Alpha and Beta band
additional sub-segments were extracted that are low
Alpha (8-10Hz), high Alpha (10-12Hz), low Beta (12-
15Hz), mid Beta (15-20Hz), and high Beta (20-30Hz).
Afterwards, frequency band data was normalized (Ln
transformation). Electrodes were pooled by computing
the mean for three regions of interest that are all frontal
sites (AF3, F3, F7, FC5, FC6, F8, F4, AF4), left frontal
sites (AF3, F3, F7, FC5), and right frontal sites (FC6,
F8, F4, AF4) for each epoch. Next, feature epochs were
aggregated temporally by computing the median over
each experiment phase. Median use was preferred as a
way of conservative data interpretation, taking care of
potential outliers. Finally, to facilitate comparisons
between experiment phases, change scores were
computed by subtracting the eyes open baseline phase
mean from each experiment phase (e.g.
∆theta
=
theta
Task
– theta
Baseline
). For an additional analysis of
temporal segments of each experiment phase, the same
procedure outlined above was repeated on 30s-long
epochs within each phase. The window length of 30s
was chosen based on the report by Soltész et al. (2014)
who argue that at the start of phases temporal
differences could occur in this interval already.
Distribution tests indicated that assumption of
normality was violated for many groups (Shapiro-Wilk
on the temporally and spatially aggregated data sets for
each condition and frequency band, p < 0.05), which is
why non-parametric tests were used afterwards.
Fligner-Killeen tests showed no violation of variance
homogeneity assumptions.
4 RESULTS
We report on four psychometric (flow, task demand,
stress, arousal) measures together with multiple EEG
features compared across six experiment phases
(three math conditions, three writing rounds). Beyond
PhyCS 2018 - 5th International Conference on Physiological Computing Systems
46
statistical comparisons, the reduced number of
samples in the EEG data prompted us to include
additional descriptive analyses. We believe this
approach also has merit in light of the young age of
the research on flow neurophysiology. The
descriptive approach has more of a case study
character, a format that has previously been employed
for flow PNS measures (Harmat et al., 2011).
4.1 Psychometric Data
Friedman tests indicated the presence of main effects
in psychometric variables at significant levels (p <
0.01). Variable means and standard deviations are
shown in Table 4, and post-hoc pairwise Wilcoxon
comparisons of experiment phases in Table 5.
The task demand variable was inspected for a
manipulation check (cf. Keller et al., 2011; Tozman
et al., 2015). Between all math conditions significant
differences were found, displaying increasing task
demand from boredom to overload conditions. DM
success was thereby confirmed. Within the writing
samples task demand levels lay continuously between
the math boredom and overload condition. Possibly
task demand in writing was also lower than in the
math flow condition (trend level indication). No
differences were found within the writing task for
task demand, with the exception of one trend level
difference between writing round 1 and 3. Also, no
differences were found in all other psychometric
variables across writing rounds and are therefore not
reported further.
Within the math task, flow report (FKS)
comparisons show significant differences between
the math flow and overload condition. Also, repeated
significant differences between the math boredom
and overload conditions with the writing rounds are
found. Lastly, a trend level indication is visible for
higher reported flow in writing round 1 compared to
the math flow condition. As there are no significant
differences within the writing task, flow was reported
as high in writing as in the math flow condition in all
writing rounds. Support for this consistency is also
visible in the range of flow reports per participant
(mean range = 1.13, SD = 0.62, writing task only).
The stress report comparison showed significant
differences between all math task conditions,
increasing with difficulty at every step. In the writing
task, stress levels were consistently below the math
flow and overload conditions. Comparisons of the
arousal reports reveal a similar pattern, with
increasing arousal from math boredom to overload
conditions. Albeit only with a significant difference
for the boredom condition with the other two. Like
stress, arousal was consistently reported lower in
writing than in math flow and overload conditions.
Finally, after both tasks, participants rated the
importance of the task. No significant differences
were found (Means: math = 3.82, writing = 4).
4.2 EEG Data
4.2.1 Results Between-Phase Comparisons
Friedman tests were computed for each feature
(pooled sites) and frequency band to detect main
effects across experiment phases. A main effect was
found only for the hiAlpha band (p < 0.05). No
different effects were found for either the left side or
right side alone, which is why the analysis of
hemispheric differences was not pursued further.
Table 4: Psychometric variable means & standard deviations (in parentheses) across experiment phases.
mB mF mO w1 w2 w3
Flow 4.03 (0.80) 4.53 (1.16) 4.02 (1.21) 5.43 (0.59) 4.93 (1.55) 5.09 (1.14)
Stress 2.96 (1.32) 4.18 (0.74) 4.75 (1.18) 2.81 (1.26) 2.79 (1.02) 2.64 (1.07)
Arousal 2.73 (1.19) 6.18 (0.98) 6.27 (1.27) 3.33 (1.50) 2.82 (1.08) 3.91 (1.64)
Demand 1.45 (0.93) 5.18 (0.60) 6.09 (0.70) 4.42 (0.90) 4.17 (1.19) 3.73 (1.01)
Table 5: P-values psychometric & EEG data pairwise Wilcoxon tests across experiment phases.
Demand Flow Stress Arousal ∆hiAlpha
mB mF mO mB mF mO mB mF mO mB mF mO mB mF mO
mF <.01 >.1 <.05 <.01 <.1
mO <.01 <.05 >.1 <.05 <.01 <.05 <.01 >.1 <.05 >.1
w1 <.01 <.1 <.01 <.01 <.1 <.01 >.1 <.05 <.01 >.1 <.01 <.01 <.05 <.1 <.1
w2 <.01 <.1 <.01 >.1 >.1 <.05 >.1 <.01 <.01 >.1 <.01 <.01 <.1 >.1 >.1
w3 <.01 <.05 <.01 <.05 >.1 <.1 >.1 <.01 <.01 <.1 <.01 <.01 <.05 >.1 <.1
Flow Neurophysiology in Knowledge Work: Electroencephalographic Observations from Two Cognitive Tasks
47

Post-hoc pairwise Wilcoxon tests were conducted
on the remaining “all frontal” feature hiAlpha
frequency band (see Table 5). Within the math task,
the hiAlpha band shows significantly higher levels in
the boredom condition than in the overload condition,
and the flow condition indicated on trend level, and
no difference between flow and overload condition.
Across tasks, the hiAlpha band activity in the math
boredom condition is significantly higher than in
writing rounds 1 and 3, and also higher than in writing
round 2, indicated at trend level. For the hiAlpha
band, trend level differences also indicate lower
hiAlpha in writing round 1 than in the math flow
condition, and lower hiAlpha in writing rounds 1 and
3 than in the math boredom condition.
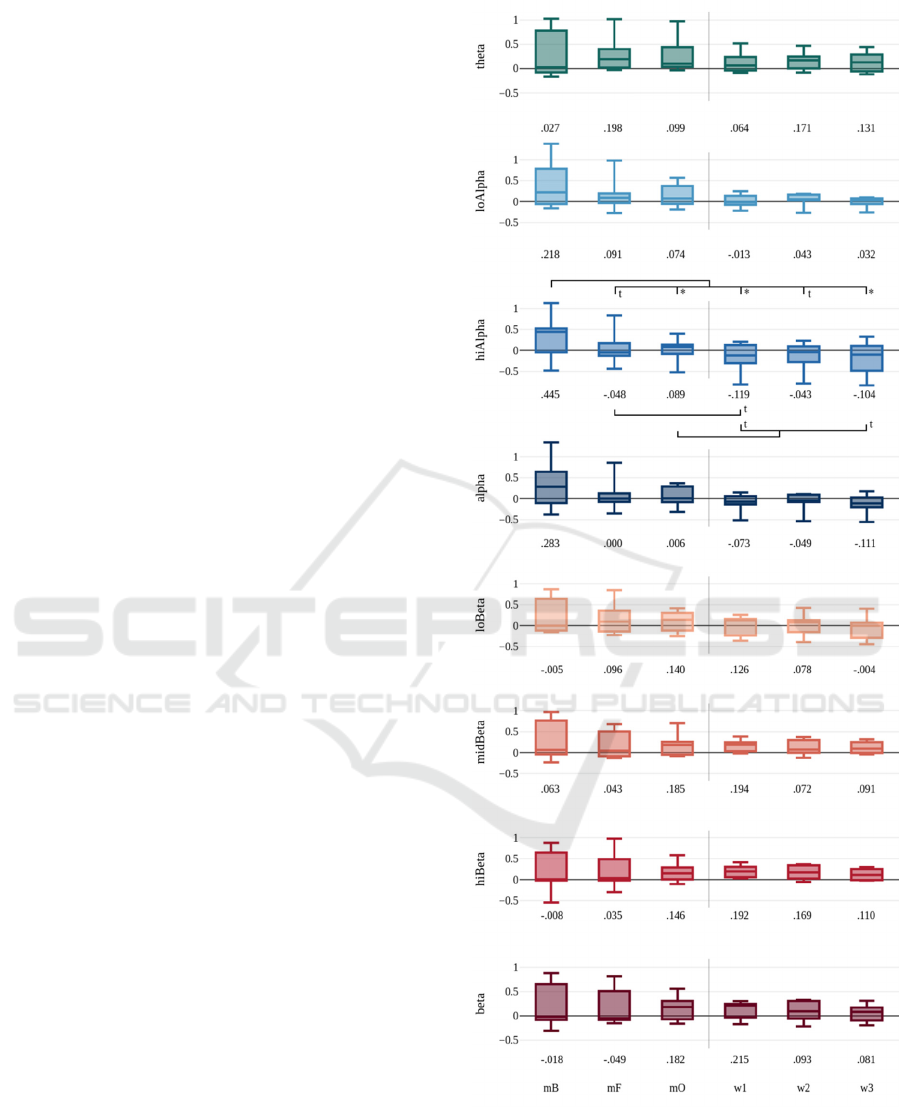
To further deepen the analysis, phase medians
were descriptively compared. Difference thresholds
were defined conservatively by ascertaining that
classified results fit the previously described
Wilcoxon tests as medium to larger differences (e.g.
the significant hiAlpha difference between the math
boredom and math flow condition has a median
difference of 0.493). Therefore, differences between
0.15 and 0.30 are considered as smaller, between 0.30
and 0.45 as moderate, and above 0.45 as larger
differences. This process lead to 33.3% of math
comparisons, 0% of writing comparisons, and 37.5%
of across task comparisons being subject of
descriptive interpretation. Within the writing task, no
differences are found, indicating a consistent
experience. Within the math task, median
comparisons show higher hiAlpha in math boredom
compared to math flow and overload conditions (mB-
mF = 0.493, mB-mO = 0.356), a contrast that is
similarly visible in the broad alpha band, although
with smaller differences (mB-mF = 0.284, mB-mO =
0.277). Furthermore, the descriptive comparison
points to higher theta in the math flow than the math
boredom condition (mB-mF = 0.171), also to higher
hiBeta in math overload compared to math boredom
(mB-mO = 0.154) and also to higher beta in the math
overload condition compared to both boredom and
flow conditions (mO-mB = 0.2, mO-mF = 0.231), all
with smaller differences. Across tasks, the descriptive
data again shows increased hiAlpha in the math
boredom condition compared to all three writing
rounds (mB-w1 = 0.564, mB-w2 = 0.488, mB-w3 =
0.548) with larger differences. The same pattern is
visible for the broad alpha band (mB-w1 = 0.356,
mB-w2 = 0.332, mB-w3 = 0.394), albeit with
moderate differences, and the loAlpha band (mB-w1
= 0.231, mB-w2 = 0.175, mB-w3 = 0.186) with
smaller differences. Furthermore, the median
differences point to lower hiAlpha in writing rounds
1 and 3 than in the math overload condition (mO-w1
= 0.208, mO-w3 = 0.192) with smaller differences.
Also, hiBeta shows higher levels in writing round 1
than in math boredom and flow conditions (mB-w1 =
0.2, mF-w1 = 0.157), as does the broad beta band
(mB-w1 = 0.233, mF-w1 = 0.265), all with smaller
differences. Both the median levels and group
significance differences are visualized in Figure 2.
4.2.2 Results within-Phase Comparisons
To analyse the potential of temporal variation in
frequency band activity during flow (Soltész et al.,
2014), within experiment phase effects were
investigated. Friedman tests on 30s-based segments
of each experiment phase were computed (10/14
segments for each math/writing task phase).
Results show main effects for the alpha and
hiAlpha band in the math boredom condition and
writing round 3 (all p < 0.05), and for the beta and
midBeta band in writing round 1 (both p < 0.01). For
writing round 3 post-hoc pairwise Wilcoxon tests
revealed only a single significant difference in the
hiAlpha band (out of 91 comparisons), which is why
this finding is considered an anomaly. For writing
round 1 on the other hand, multiple significant
differences are found for midBeta (19/25) and beta
(20/23) (p < 0.05/0.1), with the most pronounced
differences for early vs. late segments, pointing to a
beta activity increase in the first minutes of writing
round 1. For the math boredom condition, multiple
significant differences are found for alpha (5/11) and
hiAlpha (11/14) (p < 0.05/0.1) (out of 45
comparisons). This pattern is more volatile with alpha
showing a difference of the first 30s to the mid part of
the boredom task round (alpha appears to peak
slightly in the first 1-3min), but hiAlpha shows
repeated differences between segment 1 and 3-6, then
again, a difference of segment 3 to segments 7-9, and
segment 6 to 7-9, indicating an early and late peak
(and a mid-part valley). No repeated start or end
effects were found in all bands and experiment
phases. Also, besides the beta pattern in writing round
1, the phases showing higher flow reports are more
strongly marked by consistency than volatility.
Significant differences are shown in Figures 3 & 4.
5 DISCUSSION
5.1 Psychometrics Findings
Within the writing task, all variables indicate
experience consistency, despite repeated interruption.
PhyCS 2018 - 5th International Conference on Physiological Computing Systems
48
This is an important finding as interruptions are often
considered a central flow hindrance (Rissler et al.,
2017), which is why we anticipated more experiential
variance. Possibly, some factors in the writing task
design (like the goal setting procedure) dampened
such interruption impacts by providing structure.
Within the math task, our results show DM
success with results comparable to previous research,
showing that flow is reported most strongly when task
demands are balanced (Keller et al., 2011; Tozman et
al., 2015; Klarkowski, 2017).
The results are taken as first support that the
cESM approach (with this scientific writing design)
can be used to elicit flow, with at least similar
intensities compared to a standard DM paradigm (the
math task). However, a clear difference between the
two paradigms appears as writing is perceived to be
less stressful and demanding than the math task in
flow and overload conditions. A key reason for the
stress difference could be that per design multiple
stress factors present in the math task and typical DM
designs (task demand overload, social-evaluative
threat, lack of control) (Tozman et al., 2017) were not
present in the writing task. In the past, these stressors
have been purposefully introduced to DM designs in
order to elicit motivated task performances (Ulrich et
al., 2014; Tozman et al., 2015, 2017). At the same
time, in these approaches repeated sightings of
psychometric reports that point to increased
stress/arousal in balance and overload conditions
compared to boredom conditions have been made,
even in contexts where threat experiences could be
less likely (e.g. in gaming) (Harmat et al., 2015;
Tozman et al., 2015, 2017; Klarkowski, 2017). Our
results indicate, that a naturally important task
lacking these stressors, results in similar reported
flow intensities without perceptions of strain. It
would appear that the critique on the applicability of
the DM paradigm to elicit real flow could therefore
receive some support (Moller et al., 2010), as could
the proposition that naturalistic tasks are perceived as
less effortful (Hommel, 2010). However, these results
could also indicate a central limitation to how flow is
collected psychometrically.
5.2 EEG Findings
Within the writing task, EEG results mostly support
the view of a consistent experience across writing
trials. The only effect that shows variation is the
initial beta increase within the first part of writing task
round 1 (temporal analysis). Given that this variation
is not apparent in later phases, we believe it to be most
likely attributable to a type of task initiation activity.
Figure 2: Experiment phase frequency band activity over all
frontal electrodes pooled (y-axis = change scores of ln-
transformed avg. frequency band power). Median values of
each phase are listed beneath. Bars show Wilcoxon test
results with p < 0.05 (*) and p < 0.1 (t).
Flow Neurophysiology in Knowledge Work: Electroencephalographic Observations from Two Cognitive Tasks
49
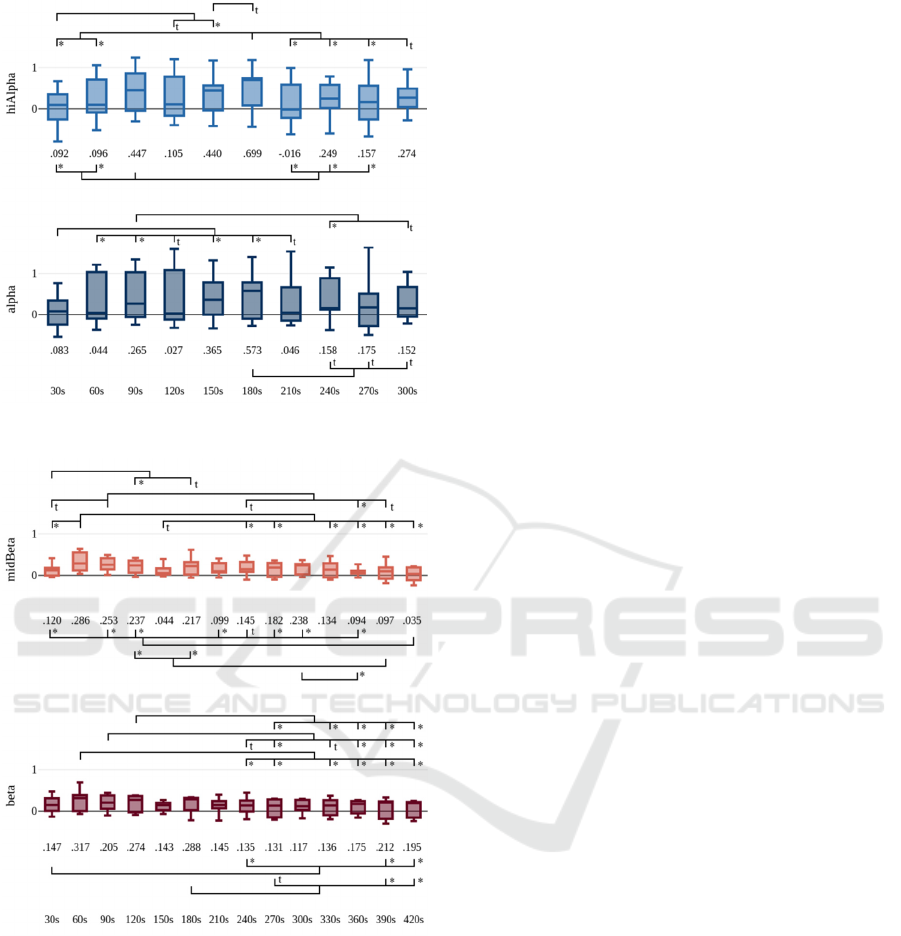
Figure 3: Temporal variation math boredom condition.
Figure 4: Temporal variation writing round 1.
It has been reported in flow and writing research
(Flower and Hayes, 1981; Csikszentmihalyi, 1996),
that initiation of a writing session takes additional
effort to structure the task that may be required less at
later stages. Given that beta activity is often related to
increased excitatory cognitive activity, we believe
this findings shows an initially increase in cognitive
effort that dissipates after a while, and that is not
specifically related to flow experience or neural
correlates thereof, as something similar is not visible
in the math flow condition either.
Within the math task, EEG results integrate in
several ways with previous work. The finding of
frontal theta activity changes (descriptive analysis)
with difficulty increases is supported, yet only
weakly. This could be a spurious effect caused by our
small sample or point to a need to further specify theta
band activity (like Ewing et al., 2016 who select
individualized theta band activity from the 4-7Hz
range). The finding of lower hiAlpha activity with
increasing task difficulty (statistical & descriptive
analyses) is interesting in multiple ways. First, the
separation of the alpha band shows that hiAlpha is
more of a differentiating feature between math task
conditions, a finding that has not been outlined as
such in previous work, yet would explain why some
of the work that includes separation does find frontal
alpha to contribute valuable diagnostic information
between difficulty conditions (Ewing et al., 2016;
Katahira et al., 2018), while others that work with the
broad alpha band do not (Chanel et al., 2011;
Klarkowski, 2017). Whether or not the hiAlpha band
provides diagnostic potential for flow observation
beyond indication of a difference to boredom,
remains a subject of future work. Presently it appears
that flow and overload conditions show a similar level
of hiAlpha, that is lower than in the boredom phase
(thus showing a potentially reduced activity in frontal
brain regions in the boredom phase). The results of
frontal theta and alpha increases with sustained
attention and increased task difficulty are in line with
previous EEG research on mental workload (Borghini
et al., 2014). The results are also fairly similar to a
recent fNIRS-based study that finds frontal brain
activity to be reduced in easy/boredom conditions and
to increase when task difficulty increases (Barros et
al., 2018). The aforementioned authors attribute this
activity to attention on the task, which we find
plausibly transferrable given the volatile hiAlpha
signature only present in the math boredom phase
(temporal analysis), specifically as mind wandering
during this condition was noted explicitly by one
participant in the final experiment survey comment
section. However, it needs to be noted that the frontal
alpha reduction is not a unanimous finding in the
related work. While it is also inferred from the
amplitude-based results of Katahira et al. (2018), the
results by Léger et al. (2014) and Labonté-Lemoyne
et al. (2016) point in the opposite direction. Mainly,
this might stem from the difference in experimental
approaches and analyses. Labonté-Lemoyne et al.
(2016) for example observe two interacting
participants and don’t manipulate difficulty
externally. A last finding with potential implications
is the increase of beta activity in the math overload
PhyCS 2018 - 5th International Conference on Physiological Computing Systems
50

condition compared to the boredom and flow
conditions (descriptive analysis). As previously
outlined, such beta band activity might be indicative
of a threshold when cognitive effort increases
strongly. Lower beta activity has been found to be
linked to higher flow experience self-reports (Léger
et al., 2014), yet again has also been found to increase
with task difficulty increases from boredom levels
(Klarkowski, 2017). It appears frontal beta can
increase at a certain level of difficulty. We would
expect this phenomenon to be visible when the
perceived stress levels increase, yet find no such
pattern. However, other studies have also found no
beta difference at all on frontal sites (Soltész et al.,
2014; Katahira et al., 2018).
Considered across tasks, beta increases would not
necessarily appear to be detrimental to flow, or
related to it for that matter, at least as the first writing
round that shows beta increases (descriptive &
temporal analyses), does not show differences in flow
experience reports (compared to the math flow
condition). Other comparisons across tasks further
support the potential relation of the hiAlpha band to
flow experience, or at least an expected corollary of it
that is attention on the task. Whether or not there is an
actually realized decrease in hiAlpha in the writing
task compared to the math overload condition
(statistical & descriptive analyses) could be an
interesting additional support of the relation of flow
experience to increased voluntary task attention.
In summary of the different frontal EEG features
investigated it can be noted, that a role of theta band
activity across tasks is in this data not supported,
pointing again to a reduced role in flow experience.
Overall, alpha band separation shows the most useful
diagnostic extension. For the beta band, this seems
less so to be the case, although a few results point to
potentially higher diagnostic properties of the
midBeta and hiBeta band. While frontal hemispheric
differences would intuitively appear to be related to
flow (e.g. as FAA is related to task approach
motivation) (Wolf et al., 2015; Labonté-Lemoyne et
al., 2016), our findings show no such pattern. Lastly,
the temporal sub-segmentation of experiment phases
indicates that at least for frontal sites, flow
experiences could be rather marked by consistency
than volatility. The findings of lower hiAlpha activity
in flow-related experiment phases point to further
support of frontal brain activity in flow experience.
This finding is in contrast to initial TH reasoning
(Dietrich, 2004), but in line with both previous EEG
work (Ewing et al., 2016), and other neuroimaging
studies indicating a more nuanced frontal activation
picture (Ulrich et al., 2014; Harmat et al., 2015;
Barros et al., 2018). Given the lack of midline frontal
electrode positions for the herein used headset and a
neglect of such dedicated differentiation of lateral and
medial frontal sites in related work (see Table 2), it
appears that the differentiating potential of frontal
EEG could be dependent on capturing more spatial
nuances (which might be difficult to attain) or have to
be accompanied by other sensors. Whether or not
frontal EEG activity alone can differentiate flow
experience from other experiential states has yet to be
explored further. Regardless of frontal activity, what
might perhaps be most interesting in the context of
this research approach, is that given the psychometric
differences in stress perceptions, it might be possible
to study a difference between the experience of flow
as a state of effortless (cESM) or effortful (DM)
attention (Hommel, 2010), if this perceptual
difference is confirmed in future work to be present
and relevant.
5.3 Study Limitations
The small sample size is a main limitation of this
study, which is why the results can only be treated as
preliminary. Through integration with related work
we have tried to somewhat overcome this limitation.
Considering the experiment design, future work
should increase experiential variance in the writing
task (e.g. by including a controlled, writing boredom
phase), and employ more psychometric scales
(involvement, effort, effortlessness, etc.) to enable
more detailed insights. Similarly, the integration of a
more self-determined difficulty adjustment as in
Barros et al. (2018), could provide additional
comparability between the two paradigms.
Physiologically, the work is limited to frontal sites in
favor of a more detailed inspection. We did not take
into account that there are other topographical regions
of interest that could be providing interesting
information on what differentiates flow from other
experiences. Some research for example points to the
explicit role of central (Katahira et al., 2018),
temporal (Wolf et al., 2015), or parietal and occipital
brain regions (Chanel et al., 2011).
6 CONCLUSIONS
We took an extensive look at psychometric and
physiological data in two flow induction paradigms
and compared data to unintegrated results of related
EEG studies. The summarized contributions are:
(1) We provide evidence for the applicability and
utility of the cESM approach to study flow in more
Flow Neurophysiology in Knowledge Work: Electroencephalographic Observations from Two Cognitive Tasks
51

unstructured tasks in the context of KW. The writing
task design appears to elicit a constant flow
experience that is at least as high in intensity as in an
established DM paradigm. At the same time the
cESM approaches elicits lower perceptions of stress,
which makes the approach an interesting, perhaps
qualitatively different option for flow research.
(2) We provide further evidence for neural
activity in flow experience, specifically in the form of
outlining the role of frontal EEG results, first by
consolidating related work, then by analysis across
two cognitive tasks. The results point to further
refusal of the hypofrontality hypothesis and instead
point to frontal activation that is visible through split
of the alpha band over averaged frontal sites (likely
indicating increased task attention). Furthermore,
temporal physiological and experiential volatility is
in this alpha band only indicated for a boredom
condition. This could support the hypothesis that flow
is actually experienced as fairly stable (Léger et al.,
2014) at least within these short time segments (5-
7min), and that volatility might be either visible in
different brain regions or over longer periods.
In future work, frontal alpha activity together with
heart rate variability (HRV) data could be a fruitful
approach to flow detection, given the observed HRV
decreases in autonomous flow experiences (Barros et
al., 2018). HRV reductions beyond what is expected
in higher task difficulties together with stable, frontal
hiAlpha activity could be a marker of flow experience
or at least its corollary of increased task attention, that
is explained by shared regulatory mechanisms
(Peifer, 2012; Barros et al., 2018). Although this
might not characterize flow neurophysiology
uniquely, it could show sufficient diagnosticity to
infer flow (vs. boredom or overload) experiences
whilst they are occurring automatically, thus enabling
the utilization of flow-facilitating bio-adaptive
systems in KW. Further detection performance might
then be achieved by inclusion of higher spatial
resolution on frontal brain activity, as the recent
fNIRS work by Barros et al. (2018) proposes flow to
be marked by activation of lateral frontal areas and
deactivation of medial frontal areas. Whether or not
this can be achieved using EEG data could be an
interesting avenue for future work, as would be the
search for neurophysiological differences that could
explain the stress perception difference and with it the
potential difference of flow experience as a state of
effortless attention (Hommel, 2010).
REFERENCES
Barham, M. P. et al. (2017) ‘Acquiring research-grade ERPs
on a shoestring budget: A comparison of a modified
Emotiv and commercial SynAmps EEG system’,
Psychophysiology, 54(9), pp. 1393–1404.
Barros, M. F. de S. et al. (2018) ‘Flow experience and the
mobilization of attentional resources’, Cognitive,
Affective, & Behavioral Neuroscience, pp. 1–14.
Berta, R. et al. (2013) ‘Electroencephalogram and
Physiological Signal Analysis for Assessing Flow in
Games’, IEEE Transactions on Computational
Intelligence and AI in Games, 5(2), pp. 164–175.
Blankertz, B. et al. (2016) ‘The Berlin brain-computer
interface: Progress beyond communication and control’,
Frontiers in Neuroscience, 10, pp. 1–24.
Borghini, G. et al. (2014) ‘Measuring neurophysiological
signals in aircraft pilots and car drivers for the assessment
of mental workload, fatigue and drowsiness’,
Neuroscience and Biobehavioral Reviews. Elsevier Ltd,
44, pp. 58–75.
Bradley, M. M. and Lang, P. J. (1994) ‘Measuring Emotion:
The Self-Assessment Manikin and the Semantic
Differential’, Journal of Behavior Therapy and
Experimental Psychiatry, 25(1), pp. 49–59.
Ceja, L. and Navarro, J. (2012) ‘“Suddenly I get into the
zone”: Examining discontinuities and nonlinear changes
in flow experiences at work’, Human Relations, 65(9),
pp. 1101–1127.
Chanel, G. et al. (2011) ‘Emotion Assessment From
Physiological Signals for Adaptation of Game Difficult’,
IEEE Transactions on Systems, Man, and Cybernetics –
Part A, 41(6), pp. 1052–1063.
Cohen, M. X. (2014) Analyzing neural time series data:
theory and practice. MIT press.
Csikszentmihalyi, M. (1996) Flow and the psychology of
discovery and invention. 1st edn. New York: Harper
Collins.
Csikszentmihalyi, M. and Hunter, J. (2003) ‘Happiness in
everyday life: The uses of experience sampling’, Journal
of Happiness Studies, 4, pp. 185–199.
Dietrich, A. (2004) ‘Neurocognitive mechanisms underlying
the experience of flow’, Consciousness and Cognition,
13(4), pp. 746–761.
Doran, G. T. (1981) ‘There’s a S.M.A.R.T. way to write
managements’s goals and objectives.’, Management
Review, 70(11), pp. 35–36.
Engeser, S. and Rheinberg, F. (2008) ‘Flow, performance and
moderators of challenge-skill balance’, Motivation and
Emotion, 32(3), pp. 158–172.
Erhard, K. et al. (2014) ‘Professional training in creative
writing is associated with enhanced fronto-striatal
activity in a literary text continuation task’, NeuroImage,
100, pp. 15–23.
Ewing, K. C. et al. (2016) ‘Evaluation of an Adaptive Game
that Uses EEG Measures Validated during the Design
Process as Inputs to a Biocybernetic Loop’,
Frontiers in
Human Neuroscience, 10, pp. 1–13.
PhyCS 2018 - 5th International Conference on Physiological Computing Systems
52

Flower, L. and Hayes, J. R. (1981) ‘A Cognitive Process
Theory of Writing’, College Composition and
Communication, 32(4), pp. 365–387.
Galluch, P. S. et al. (2015) ‘Interrupting the Workplace:
Examining Stressors in an Information Technology
Context.’, Journal of the Association for Information
Systems, 16(1), pp. 1–47. Available at:
http://proxy.lnu.se/login?url=http://search.ebscohost.co
m/login.aspx?direct=true&db=buh&AN=100815876&l
ang=sv&site=eds-live&scope=site.
Hair, J. F. et al. (2011) ‘PLS-SEM: Indeed a Silver Bullet’,
The Journal of Marketing Theory and Practice, 19(2),
pp. 139–152.
Harmat, L. et al. (2011) ‘Heart Rate Variability During Piano
Playing: A Case Study of Three Professional Solo
Pianists Playing a Self-Selected and a Difficult Prima
Vista Piece’, Music and Medicine, 3(2), pp. 102–107.
Harmat, L. et al. (2015) ‘Physiological correlates of the flow
experience during computer game playing’,
International Journal of Psychophysiology, 97(1), pp. 1–
7.
Harris, D. J. et al. (2017) ‘Neurocognitive mechanisms of the
flow state’, Progress in Brain Research, 237(1), pp. 221–
243.
Hommel, B. (2010) ‘Grounding attention in action control:
The intentional control of selection’, Effortless attention:
A new perspective in the cognitive science of attention
and action, pp. 121–140.
Katahira, K. et al. (2018) ‘EEG correlates of the flow state:
A combination of increased frontal theta and moderate
frontocentral alpha rhythm in the mental arithmetic task’,
Frontiers in Psychology, 9, pp. 1–11.
Keller, J. et al. (2011) ‘Physiological aspects of flow
experiences: Skills-demand-compatibility effects on
heart rate variability and salivary cortisol’, Journal of
Experimental Social Psychology, 47(4), pp. 849–852.
Klarkowski, M. (2017) The Psychophysiologial Evaluation
of the Player Experience. Queensland University of
Technology.
Knierim, M. T. et al. (2017) ‘The psychophysiology of flow:
A systematic review of peripheral nervous system
features’, Lecture Notes in Information Systems and
Organisation, 25, pp. 109–120.
Kosti, M. V. et al. (2018) ‘Towards an affordable brain
computer interface for the assessment of programmers’
mental workload’, International Journal of Human
Computer Studies, 115, pp. 52–66.
Labonté-Lemoyne, É. et al. (2016) ‘Are We in Flow?
Neurophysiological Correlates of Flow States in a
Collaborative Game’, in Proceedings of the 2016 CHI
Conference Extended Abstracts on Human Factors in
Computing Systems, pp. 1980–1988.
Léger, P. M. et al.
(2014) ‘Neurophysiological correlates of
cognitive absorption in an enactive training context’,
Computers in Human Behavior, 34, pp. 273–283.
de Manzano, Ö. et al. (2010) ‘The psychophysiology of flow
during piano playing’, Emotion, 10(3), pp. 301–311.
Moller, A. C. et al. (2010) ‘Developing an experimental
induction of flow: Effortless action in the lab’, in Bruya,
B. (ed.) Effortless Attention, pp. 191–204.
Moneta, G. B. (2012) ‘On the Measurement and
Conceptualization of Flow’, in Engeser, S. (ed.)
Advances in Flow Research, pp. 23–50.
Nakamura, J. and Csikszentmihalyi, M. (2009) ‘Flow theory
and research’, in Lopez, S. and Snyder, C. R. (eds)
Oxford Handbook of Positive Psychology. New York:
Oxford University Press, pp. 195–206.
Peifer, C. (2012) ‘Psychophysiological Correlates of Flow-
Experience’, in Engeser, S. (ed.) Advances in Flow
Research. New York, NY: Springer Science, pp. 139–
164.
Picton, T. W. et al. (2000) ‘Guidelines for using human
event-related potentials to study cognition : Recording
standards and publication criteria’, pp. 127–152.
Rissler, R. et al. (2017) ‘Towards an integrative theoretical
framework of IT-mediated interruptions’, in Proceedings
of the 25th European Conference on Information Systems
(ECIS), pp. 1950–1967.
Rissler, R. et al. (2018) ‘Got Flow? Using Machine Learning
on Physiological Data to Classify Flow’, in Proceedings
of the Conference of Human Factors in Computing
Systems (CHI).
Soltész, P. et al. (2014) ‘Towards understanding the
electrophysiology of flow’, in Flow, Emotional
Intelligence and Psychological Immunity: Empirical
Studies in Positive Psychological Perspective, pp. 85–92.
Spurlin, S. and Csikszentmihalyi, M. (2017) ‘Will Work Ever
be Fun Again?’, in Fullagar, C. J. and Delle Fave, A.
(eds) Flow at Work: Measurement and Implications, pp.
176–187.
Tams, S. et al. (2014) ‘NeuroIS—Alternative or Complement
to Existing Methods? Illustrating the Holistic Effects of
Neuroscience and Self-Reported Data in the Context of
Technostress Research’, Journal of the Association for
Information Systems, 15, pp. 723–753.
Tian, Y. et al. (2017) ‘Physiological signal analysis for
evaluating flow during playing of computer games of
varying difficulty’, Frontiers in Psychology, 8, pp. 1–10.
Tozman, T. et al. (2015) ‘Understanding the
psychophysiology of flow: A driving simulator
experiment to investigate the relationship between flow
and heart rate variability’, Computers in Human
Behavior, 52, pp. 408–418.
Tozman, T. et al.
(2017) ‘Inverted U-Shaped Function
Between Flow and Cortisol Release During Chess Play’,
Journal of Happiness Studies, 18(1), pp. 1–22.
Ulrich, M. et al. (2014) ‘Neural correlates of experimentally
induced flow experiences’, NeuroImage, 86, pp. 194–
202.
Weber, R. et al. (2009) ‘Theorizing flow and media
enjoyment as cognitive synchronization of attentional
and reward networks’, Communication Theory, 19(4),
pp. 397–422.
Wolf, S. et al. (2015) ‘Motor skill failure or flow-experience?
Functional brain asymmetry and brain connectivity in
elite and amateur table tennis players’, Biological
Psychology, 105, pp. 95–105.
Flow Neurophysiology in Knowledge Work: Electroencephalographic Observations from Two Cognitive Tasks
53
